Create Report
Note: Starting from v6.1, the default interface for creating or editing reports will be the
new designer. The appearance ofold designerhas beendeprecated. For more information related to this change, please refer to the corresponding section.
This section explains on how to create report and design a report in the Bold Reports® On-Premise.
- If the user has
All Reportspermission, then the user can create reports in any category. - If the user has
Reports in Categorypermission with some chosen categories, then the user can only create reports in those chosen categories. - Reports must be added in any one category.
- Reports can be designed in the Report Designer and then it can be published into the Report Server.
- Reports created by using the SSRS Report Builder can also be uploaded into the Report Server.
Steps to create a report
-
Click on the
[+]icon from the toolbar and click on theStart from Scratchoption.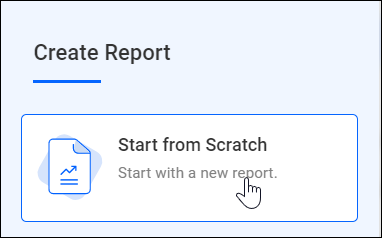
-
Enter the report name in the dialog box and click on
Add and Designbutton.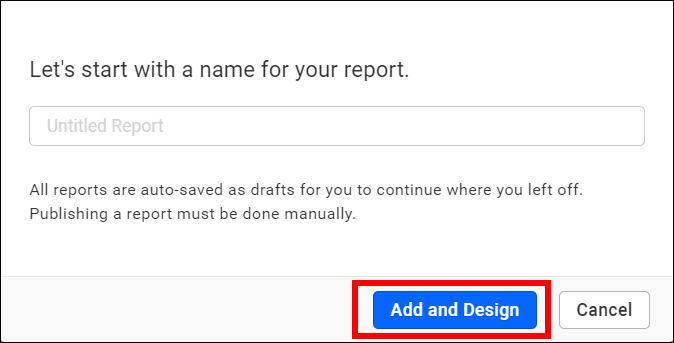
The report will be automatically saved as a draft if the user does not publish it, and you can view unpublished reports on the Drafts listing page.

-
Now, the report designer page opens in a new tab, with a blank report by default.
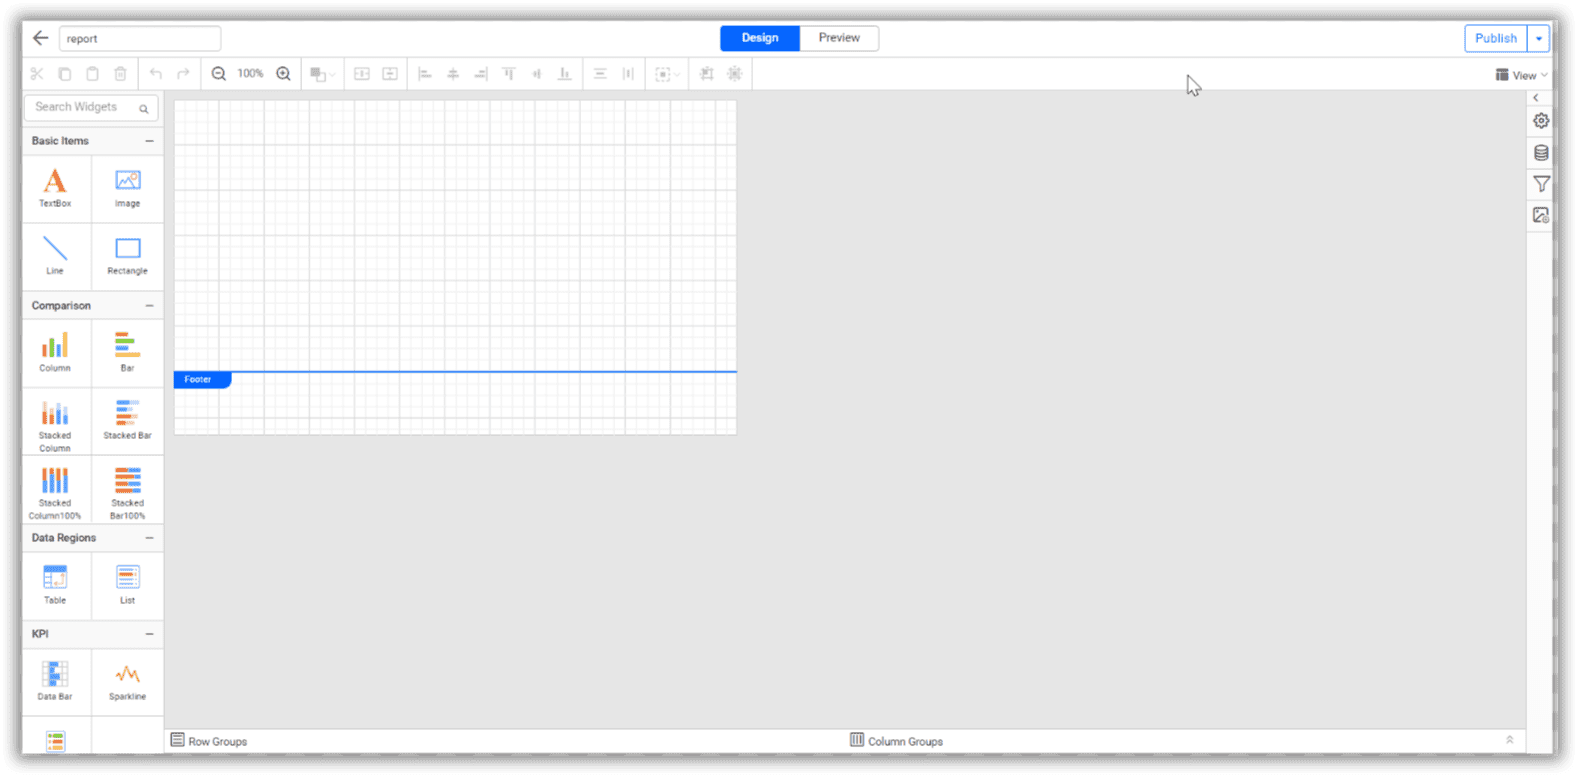
Read Write Deletepermission for thatSpecific Reportwill be added for the user who created the report.
Create Data
- To add a data, open the
Datapanel by clicking on the Data icon in the configuration panel.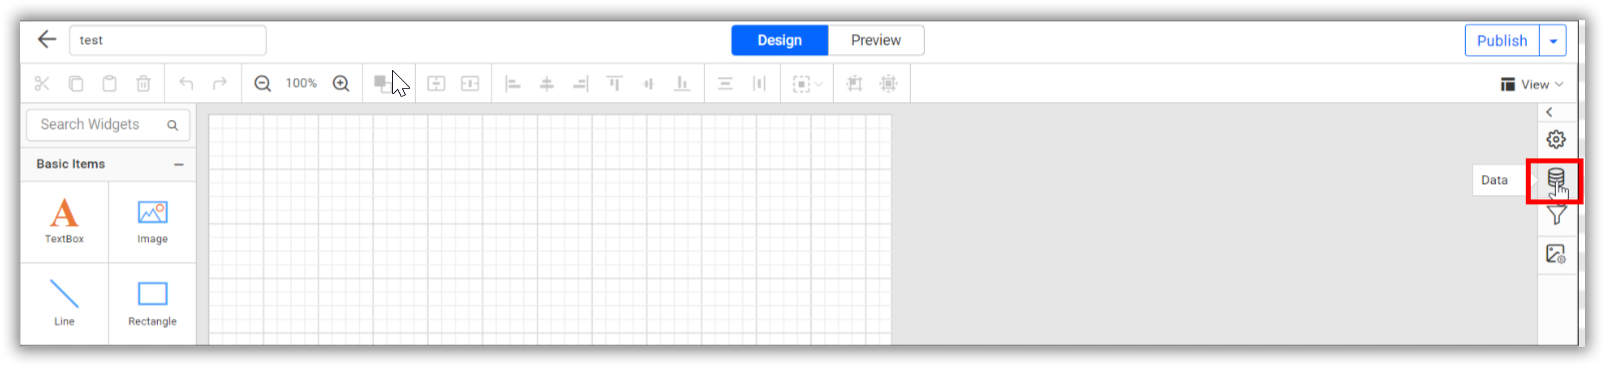
- Click on
EXPLORE SAMPLE DATAin the data panel.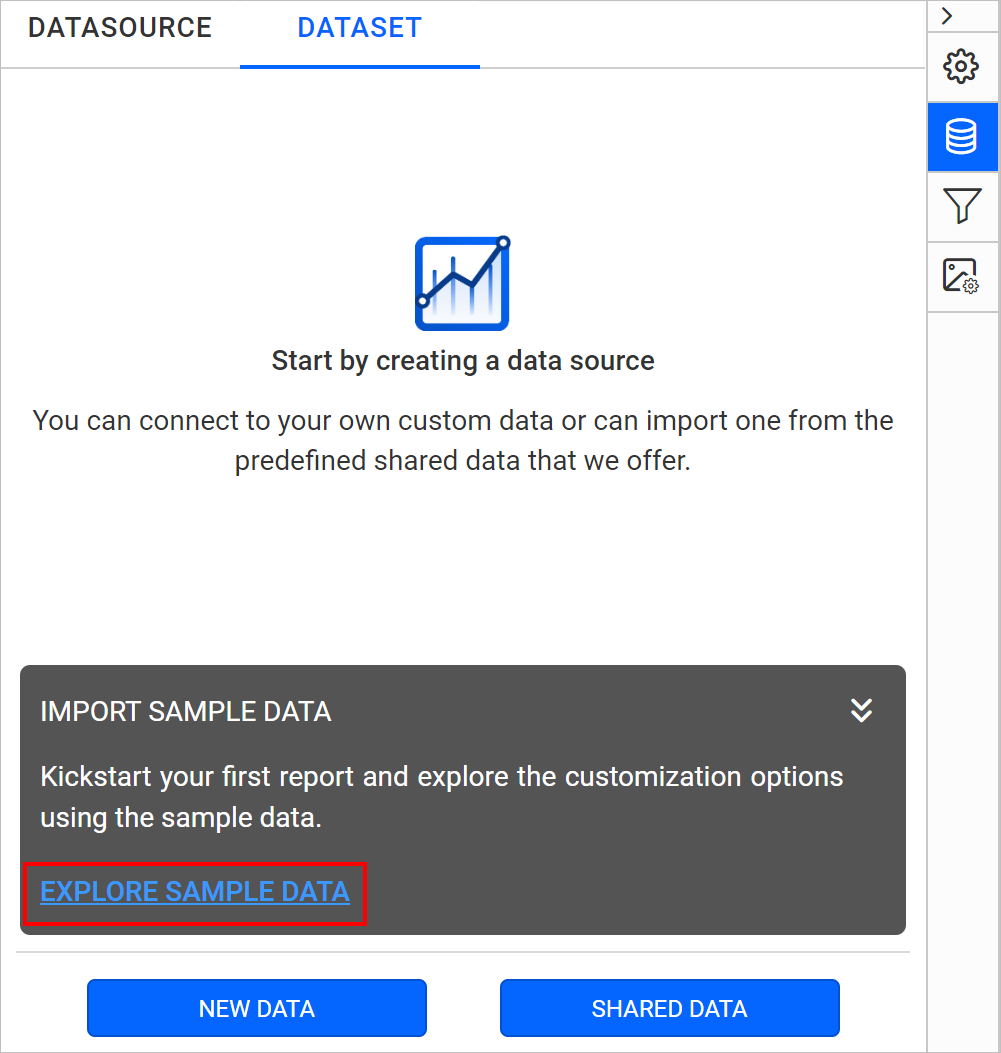
- From the available data, select
Salesdata and clickAdd.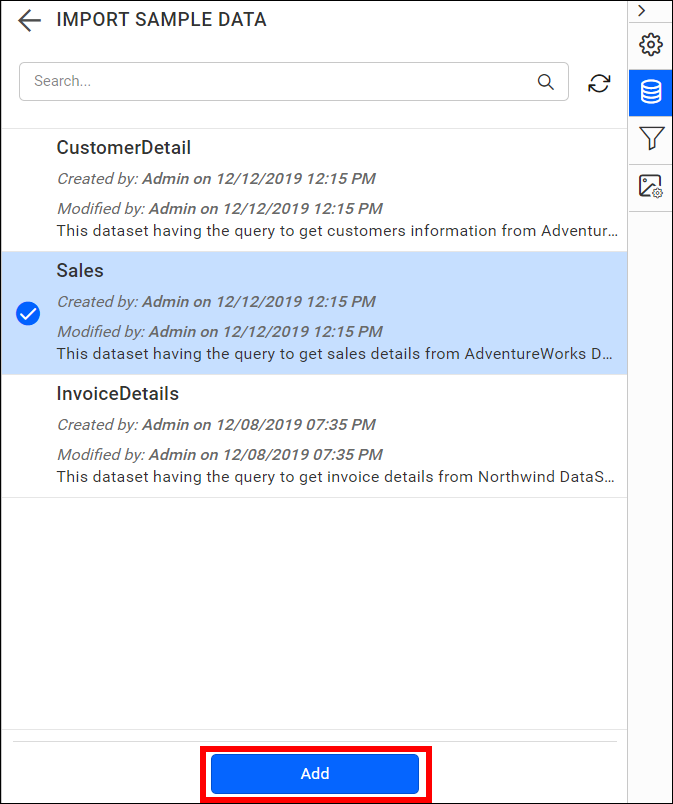
- Now, a new
DataSourceandDataSetwill be added in the report.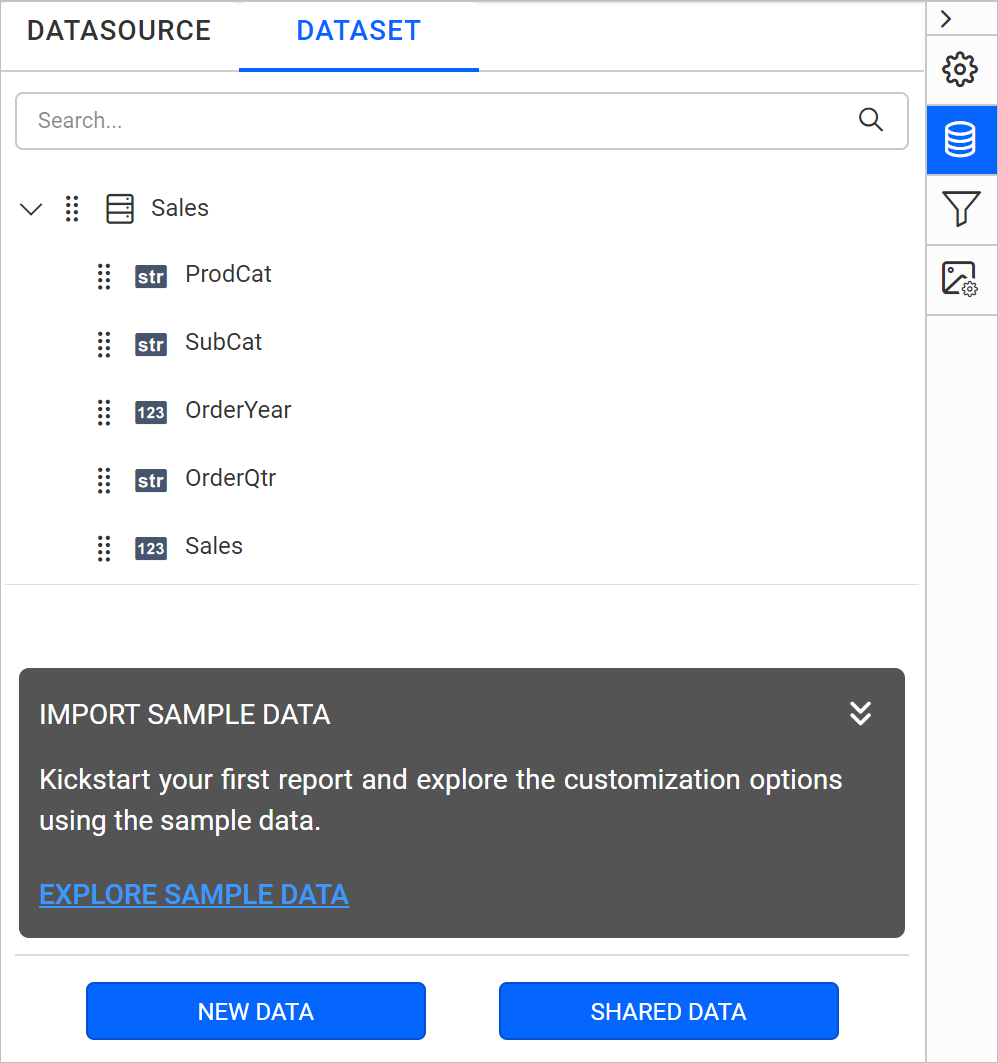
Add a chart report item
The left pane in the design view consists of basic items, data region, data visualization, and sub reports to design an interactive report.
Here, the
Chartreport item is used for demonstration.
-
Select any of the
Charttype in the left pane, then drag and drop it to the design area.Here,
Columnchart is used for demonstration.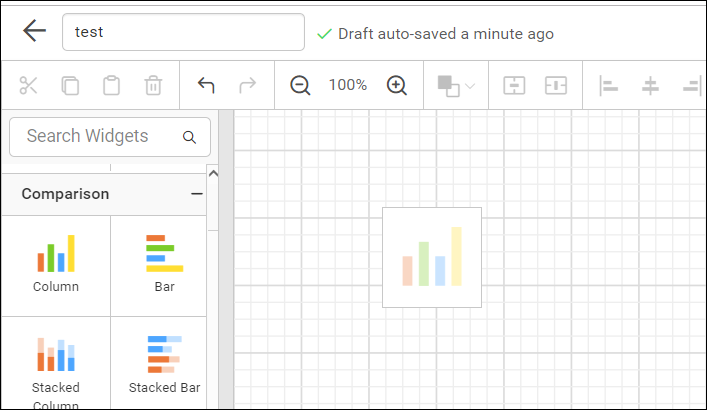
-
The above action will render the
Chartreport item in the design area.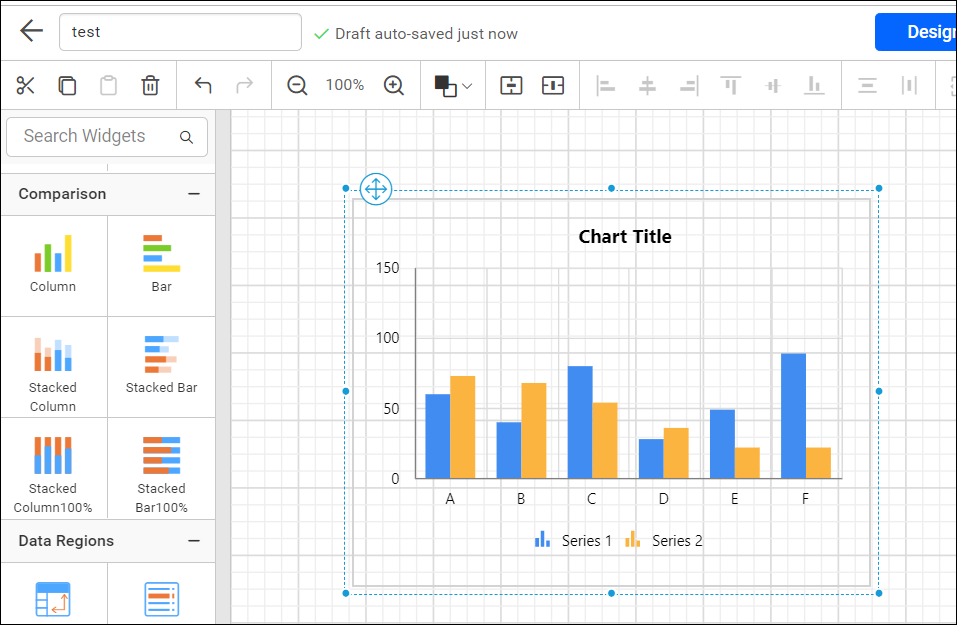
Assign Data
This step is applicable only for the report items that belongs to
data visualizationanddata regioncategory.
- To bind data to a report item placed in the design area, focus on that report item.
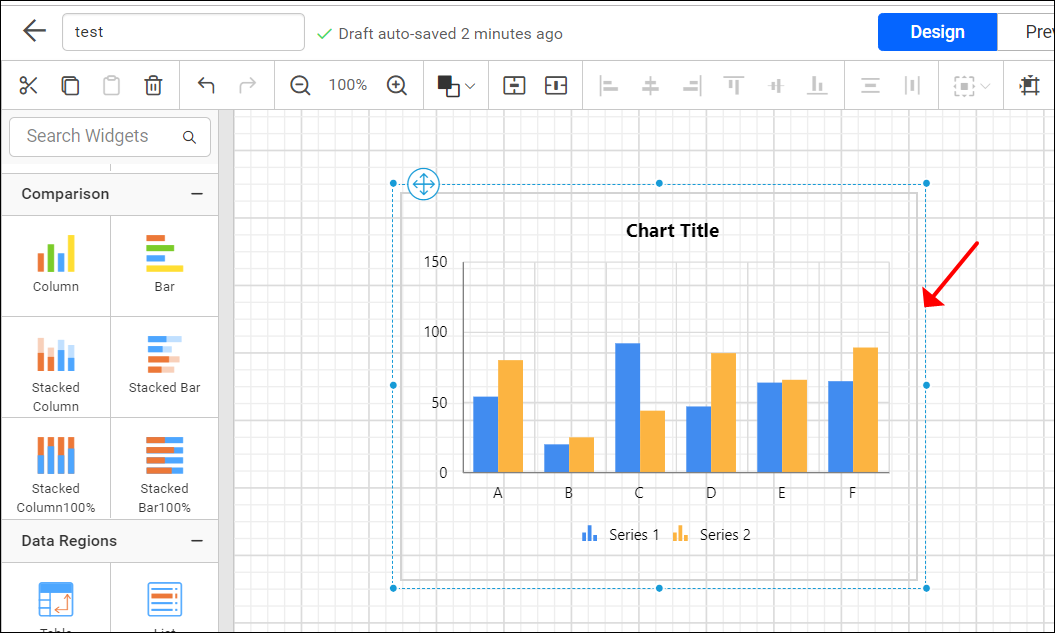
- Click
Propertiesbutton in the configuration panel, the property pane opens. Now, switch toDATAtab.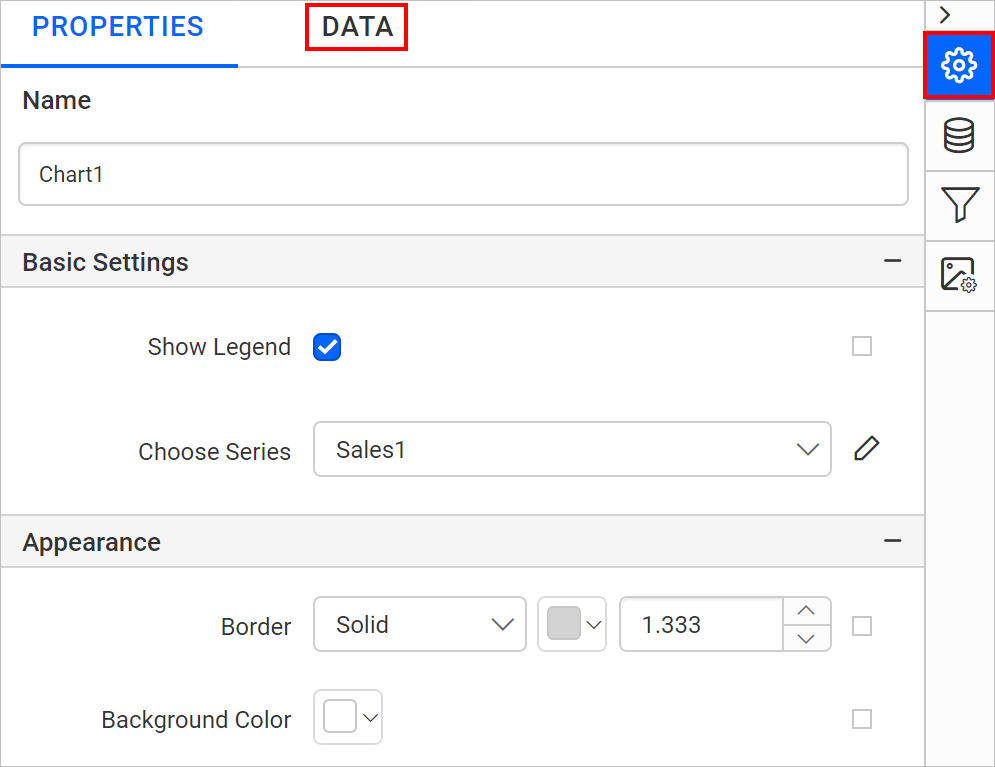
- The
DATAtab holds data configuration view. - The available data in the report will be listed in the drop-down, choose a data in the drop-down list.
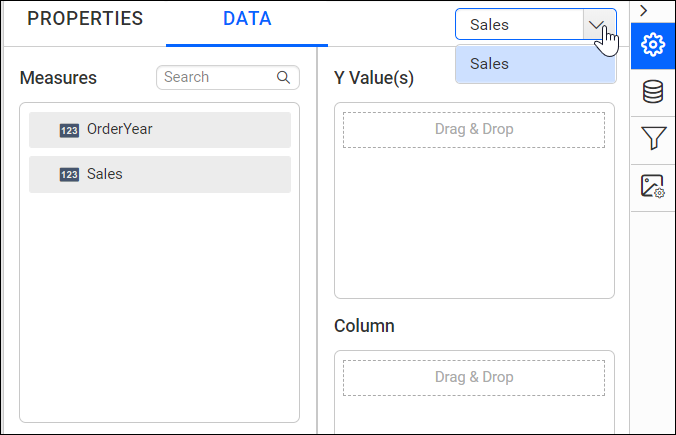
- The numeric columns and numeric expressions are listed under the
Measuressection; other type of columns and dimension expressions are listed under theDimensionssection.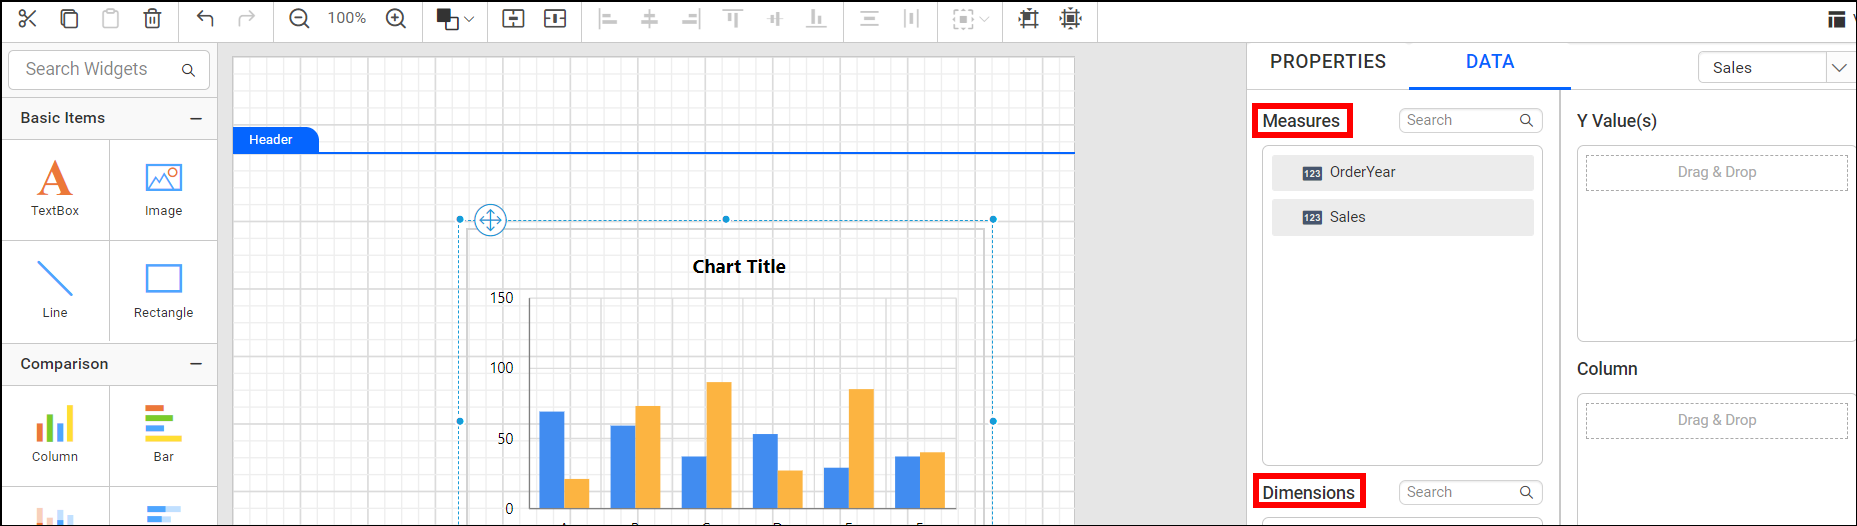
- Drag and Drop Measure Element:
Select and drag the numeric column (measure element) or the numeric expression column from the
Measuresection and drop it in theY Valuessection.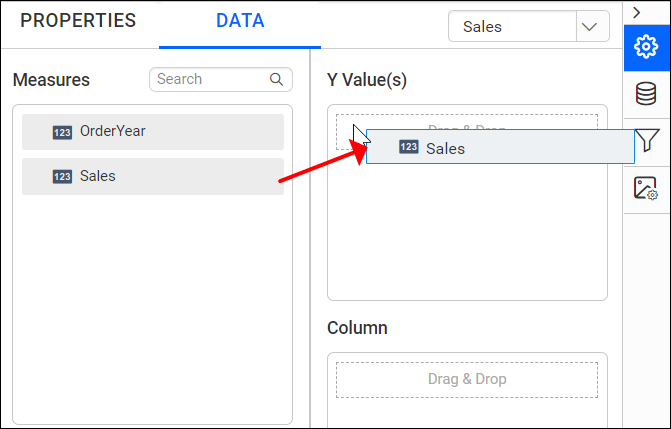 Now, the report item design will look like below:
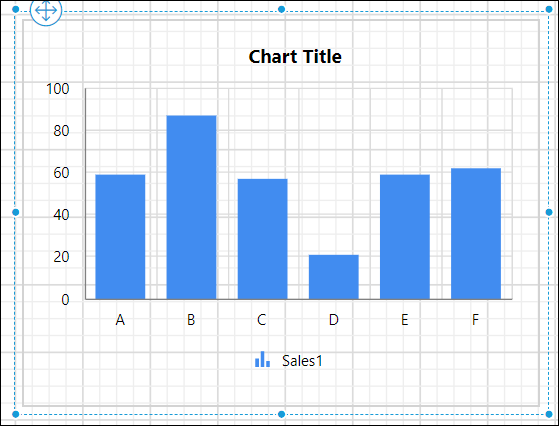
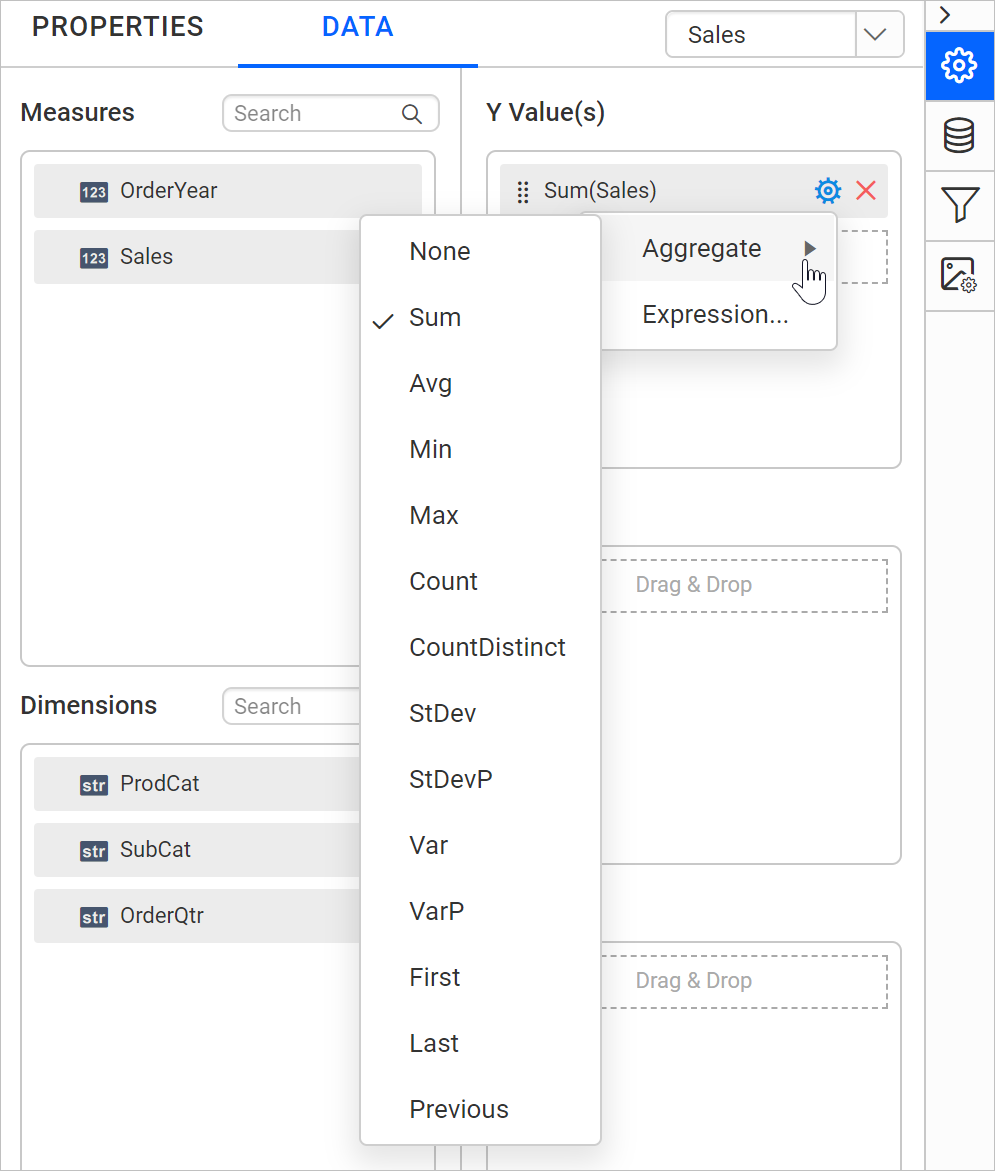
- Aggregate Options:
Click the
Settingsicon (highlighted below) to open the aggregation type drop-down list.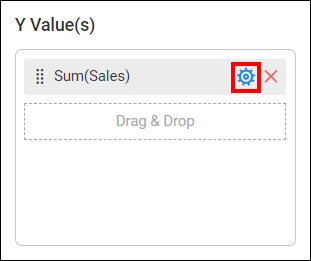 You can set the aggregation type by which you can compute the selected column.
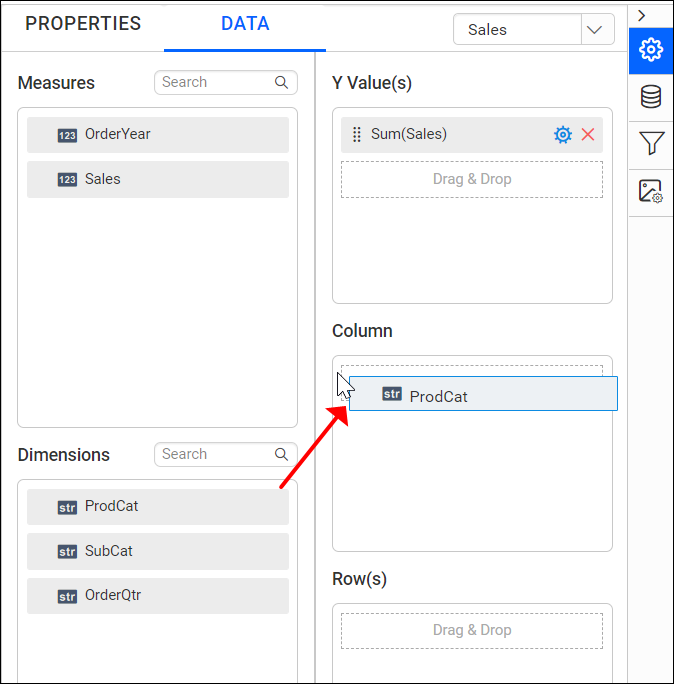
- Drag and Drop Dimension Element:
Select and drag the dimension element from the
Dimensionssection to measure against any of the selected numeric column(s) inY Value(s)section, and drop into theColumn(s)section.
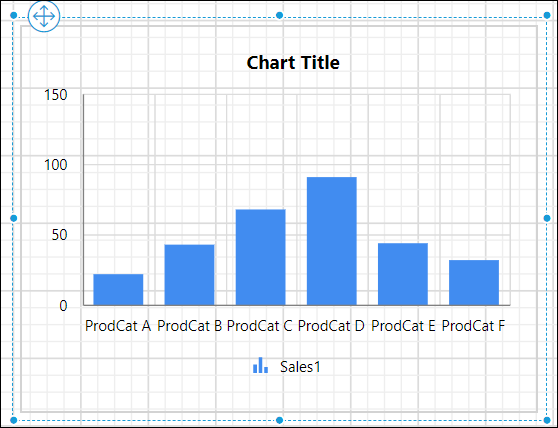
 Now, the report item design will look like below:
- Grouping:
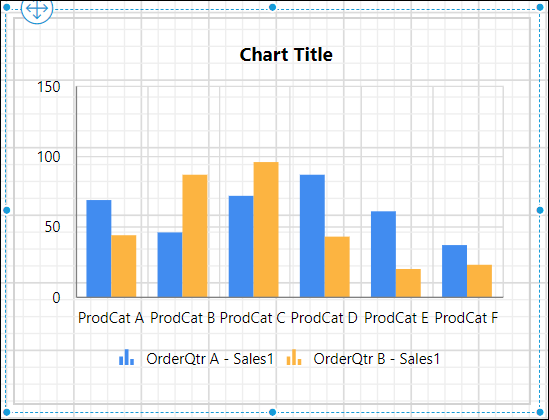
You can group the added column element with another column, by adding the respective dimension element into Row(s) section.
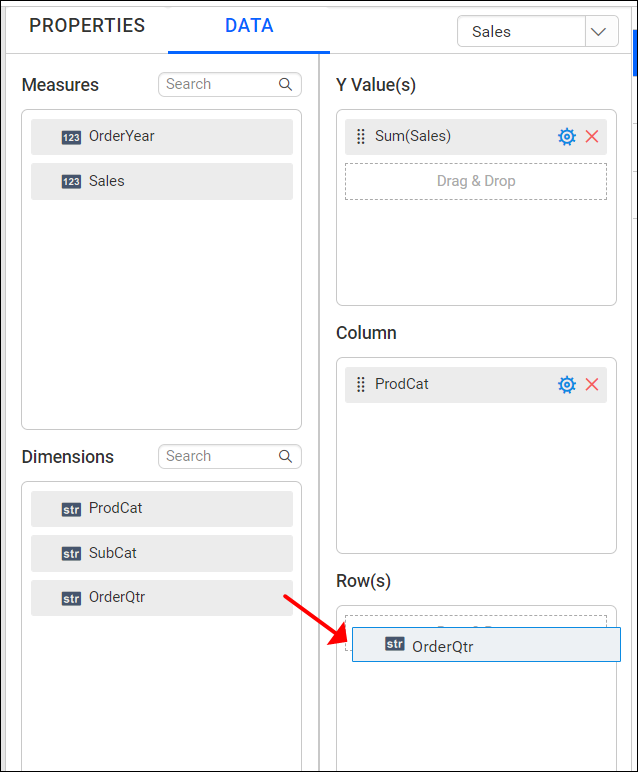 Now, the report item design will look like below.
Customize the appearance
Navigate to the PROPERTIES tab in the properties pane.
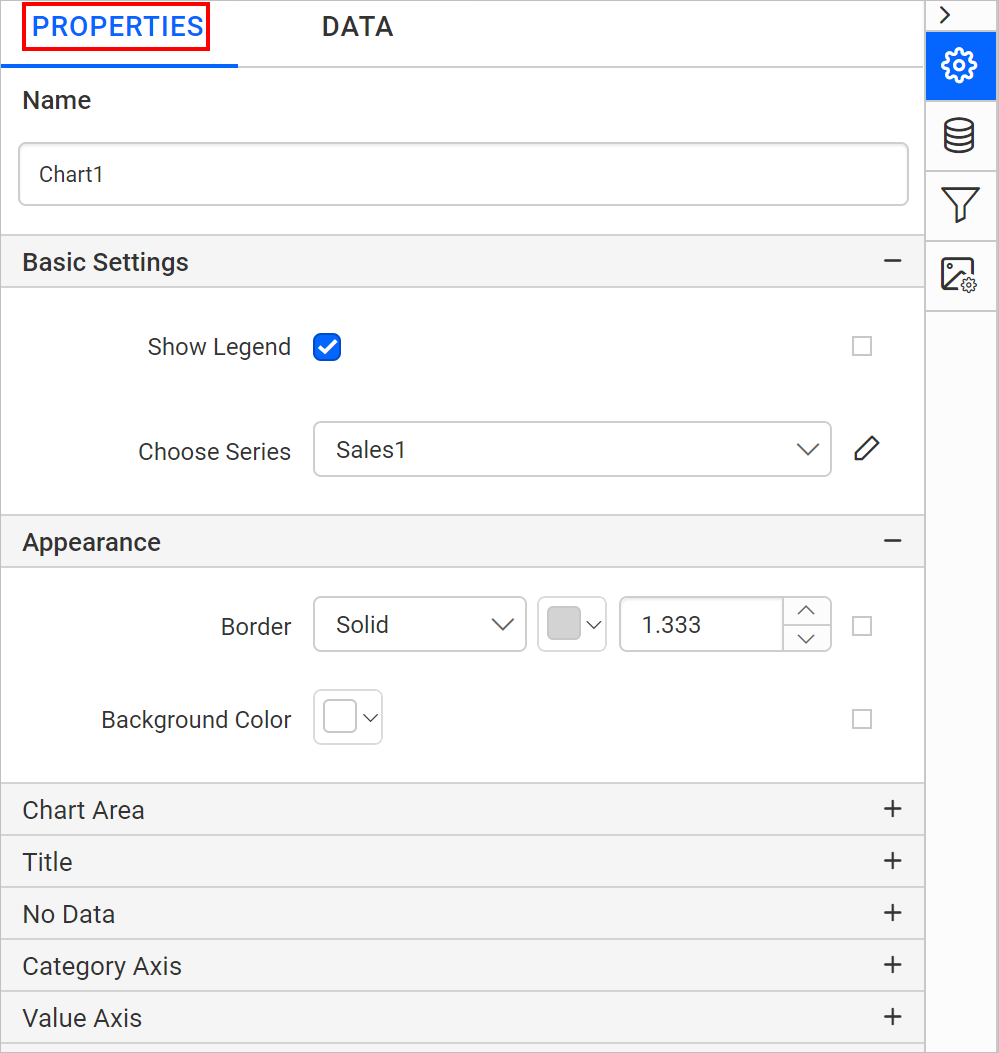
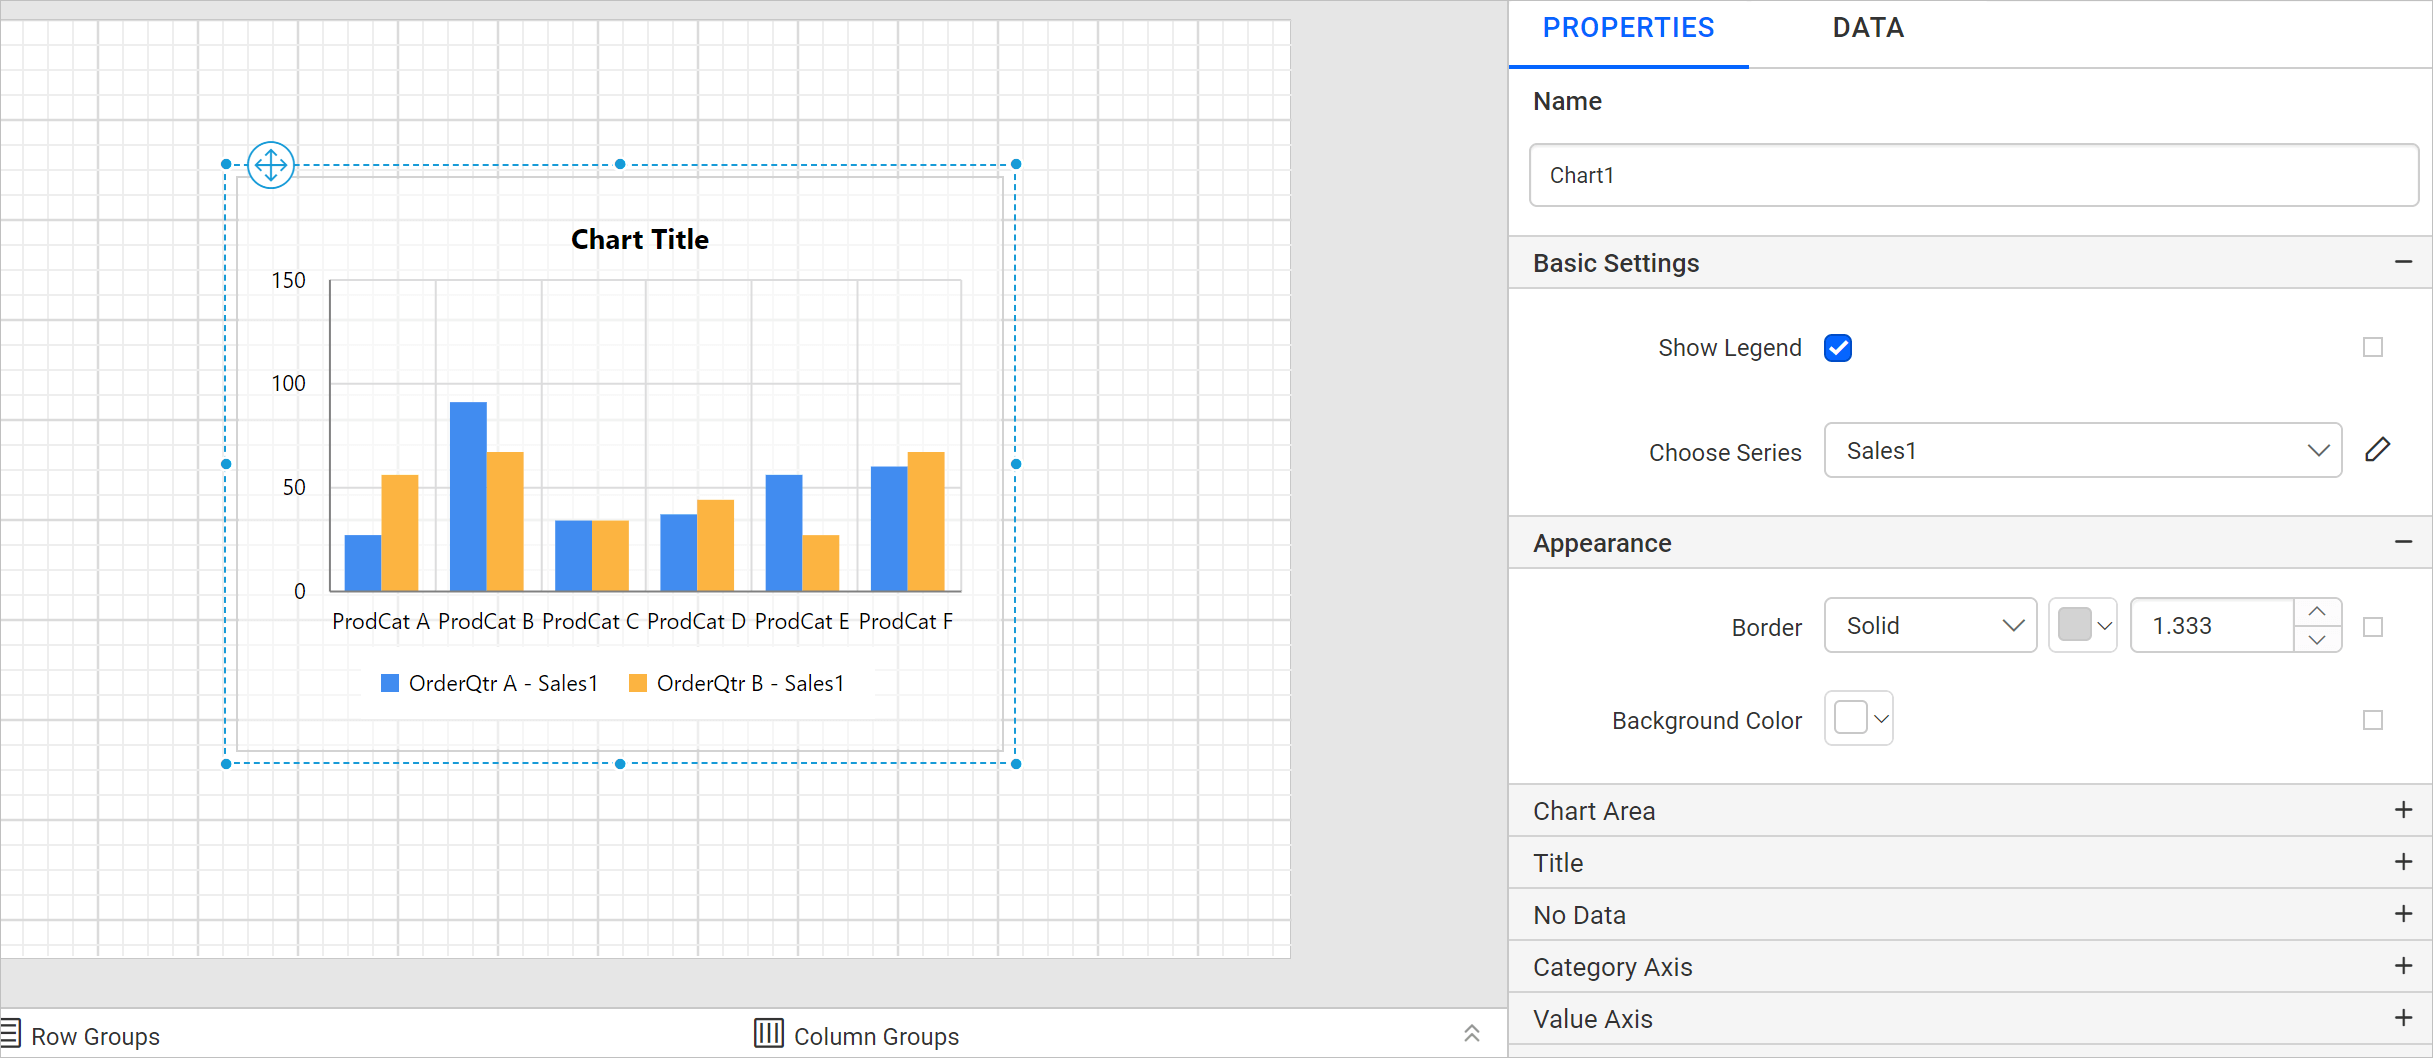
This pane holds some general settings and some specific to the report item. Configure the desired settings to the chart for better report design and to improve report readability.
Publish report
Once you finish designing the report, publish it using the Publish dialog. For step-by-step instructions, refer to the Publish Report section.
Preview report
- To see the report preview, click on the Preview button in the center of the report header.
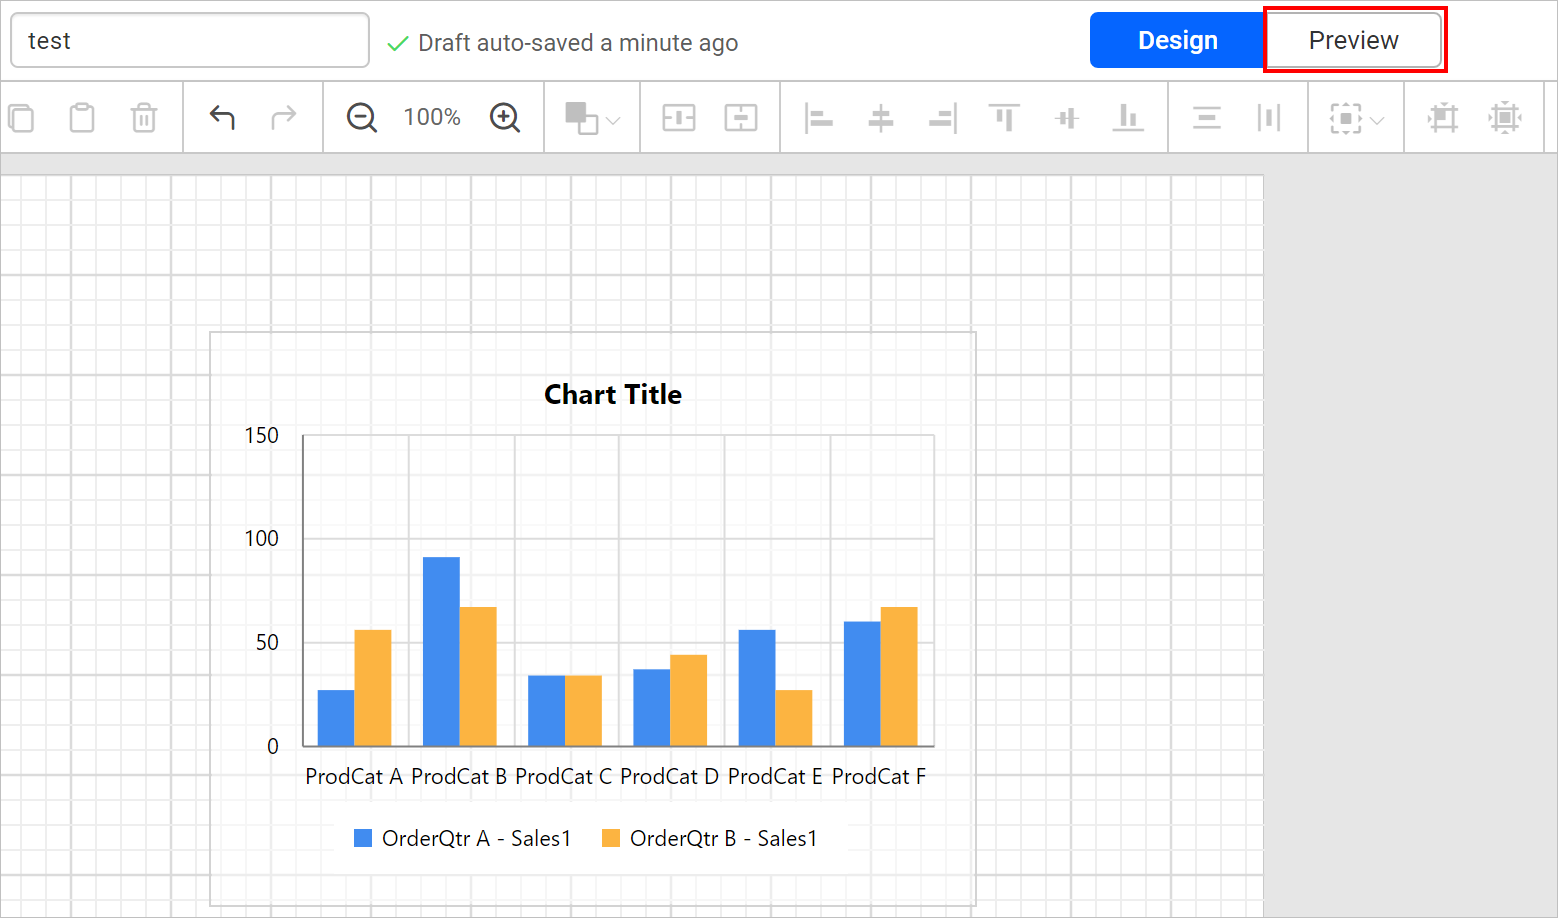
- Now, the report preview can be visualized like below.
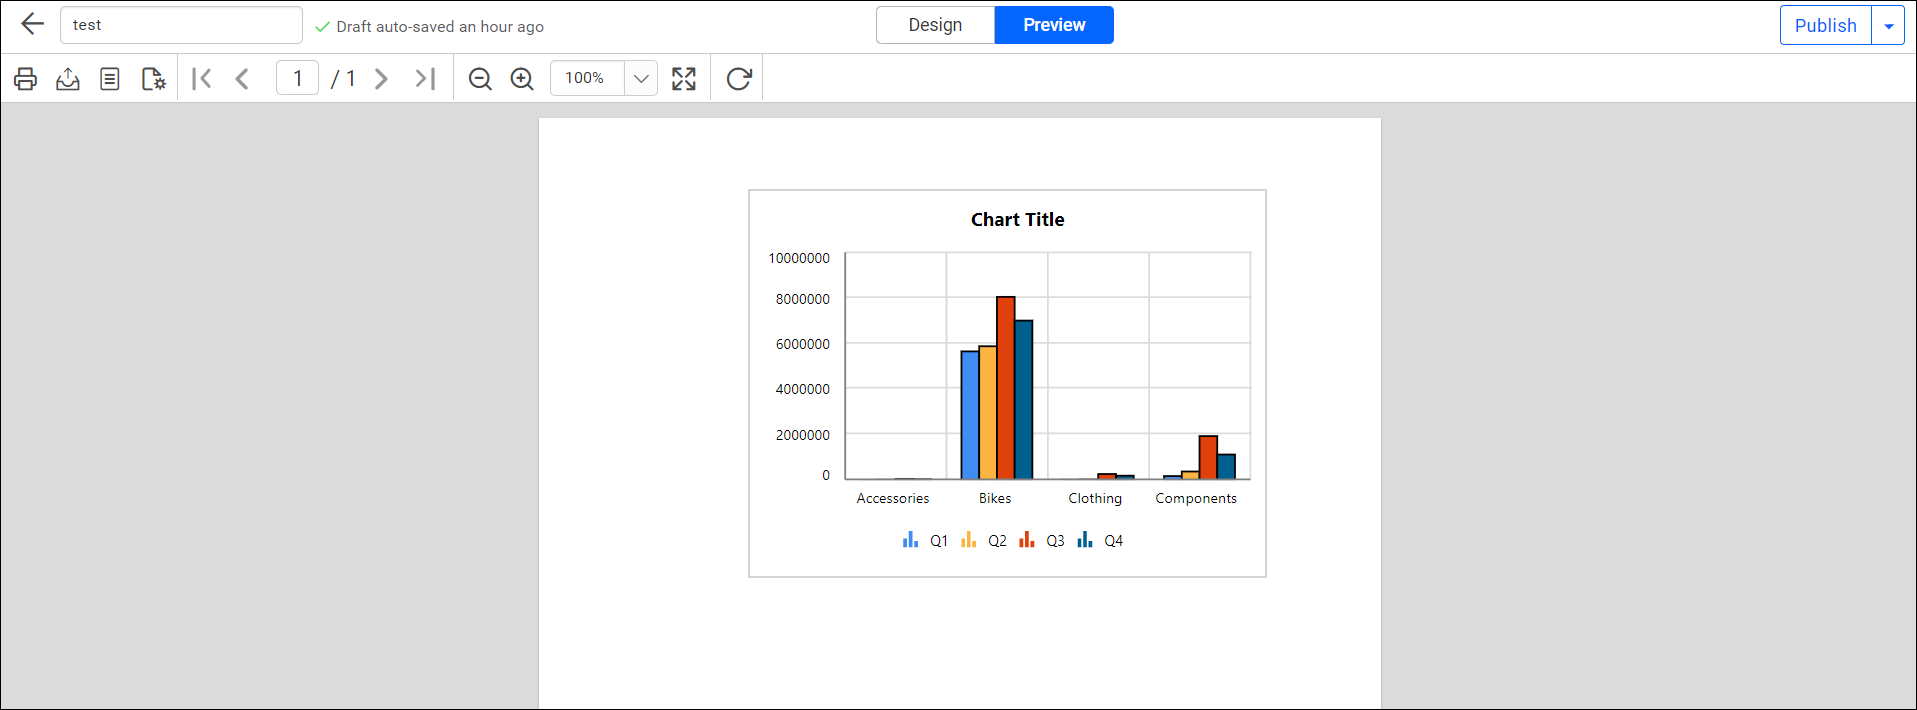
Download the above report design from the GitHub repository.
Breaking changes from v6.x
-
From v6.1 , when creating a new report or editing an existing one, the designer will be displayed by default using the
new designer. Theold designerlook has beendeprecated.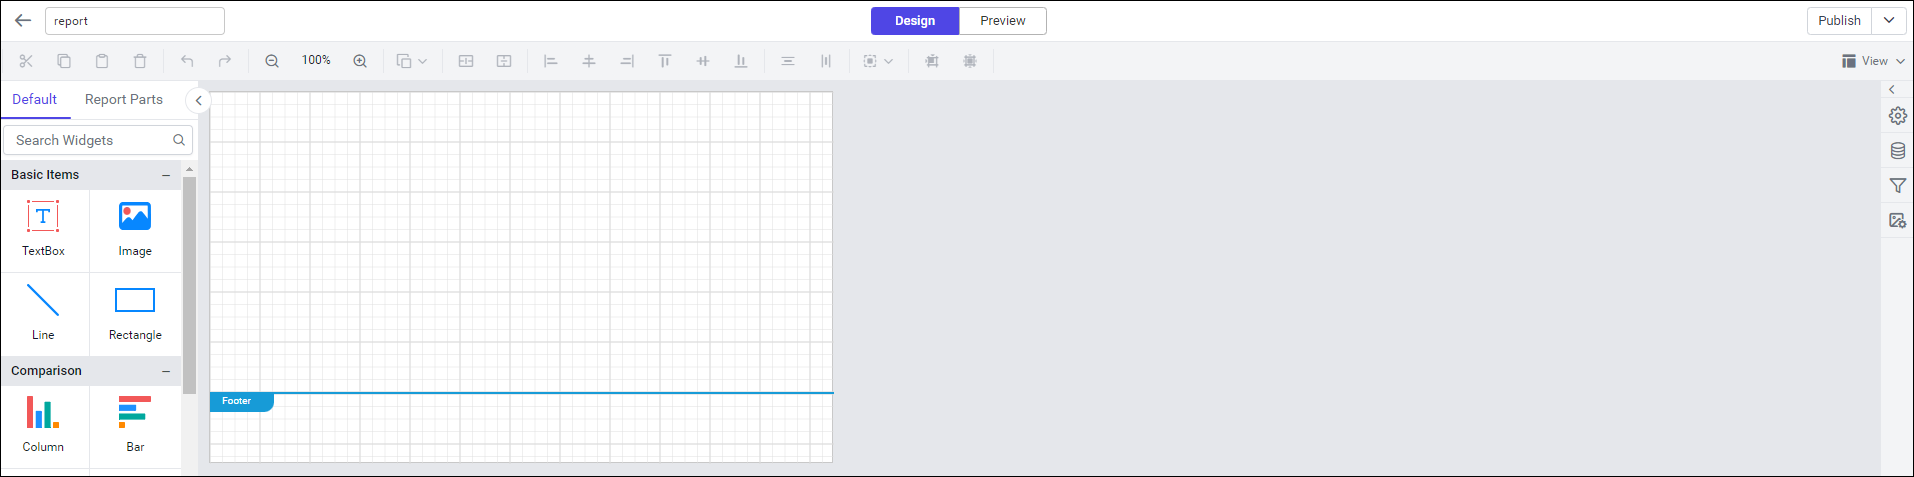
-
If you have previously saved your designer preference on the user profile page, that saved preference will no longer considered, and the related options will no longer be available.
See also
Link a Shared DataSource into a Report
Link a Shared DataSet into a Report
Create a Duplicate Copy of DataSource in a Report
Create a Duplicate Copy of DataSet in a Report
Add a Report Parameter to a Report
REST API Reference
The following table illustrates the list of available APIs related to Add reports in Bold Reports® On-Premise.
| Action | HTTP Method | Endpoint | Description |
|---|---|---|---|
| AddReport | POST | /api/site/{tenant-name}/v1.0/reports | Add report to the server. Report details must be passed as input. |