Color palette rule for map shapes in Bold Reports®
In the Bold Reports® Web Report Designer, the color palette rule fills each map shape in a layer with a color from the applied palette, then uses progressively lighter shades.
How do I apply a color palette to map shapes?
You apply a color palette to map shapes in the Bold Reports® Web Report Designer from the Shape Color Rule category.
- Under the
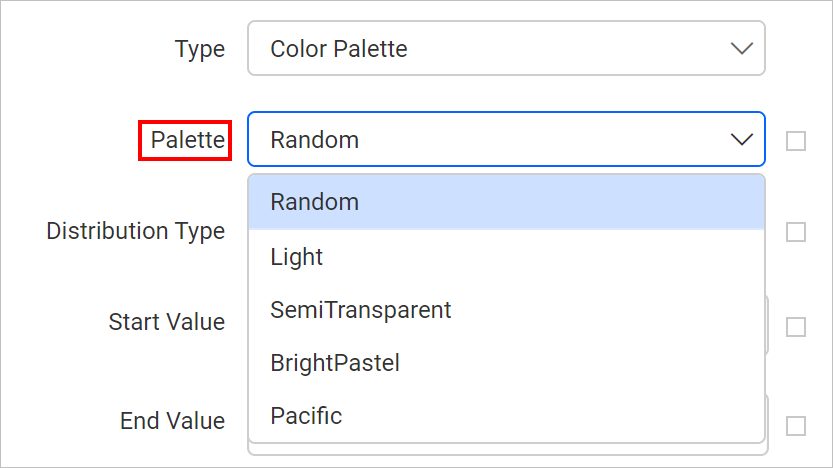
Shape Color Rulecategory, choose the Color Palette option in the type dropdown. - Choose a palette from the Palette dropdown that appears under the type dropdown.
For example, set the palette type to BrightPastel. The map design with sample data then looks like the following image.
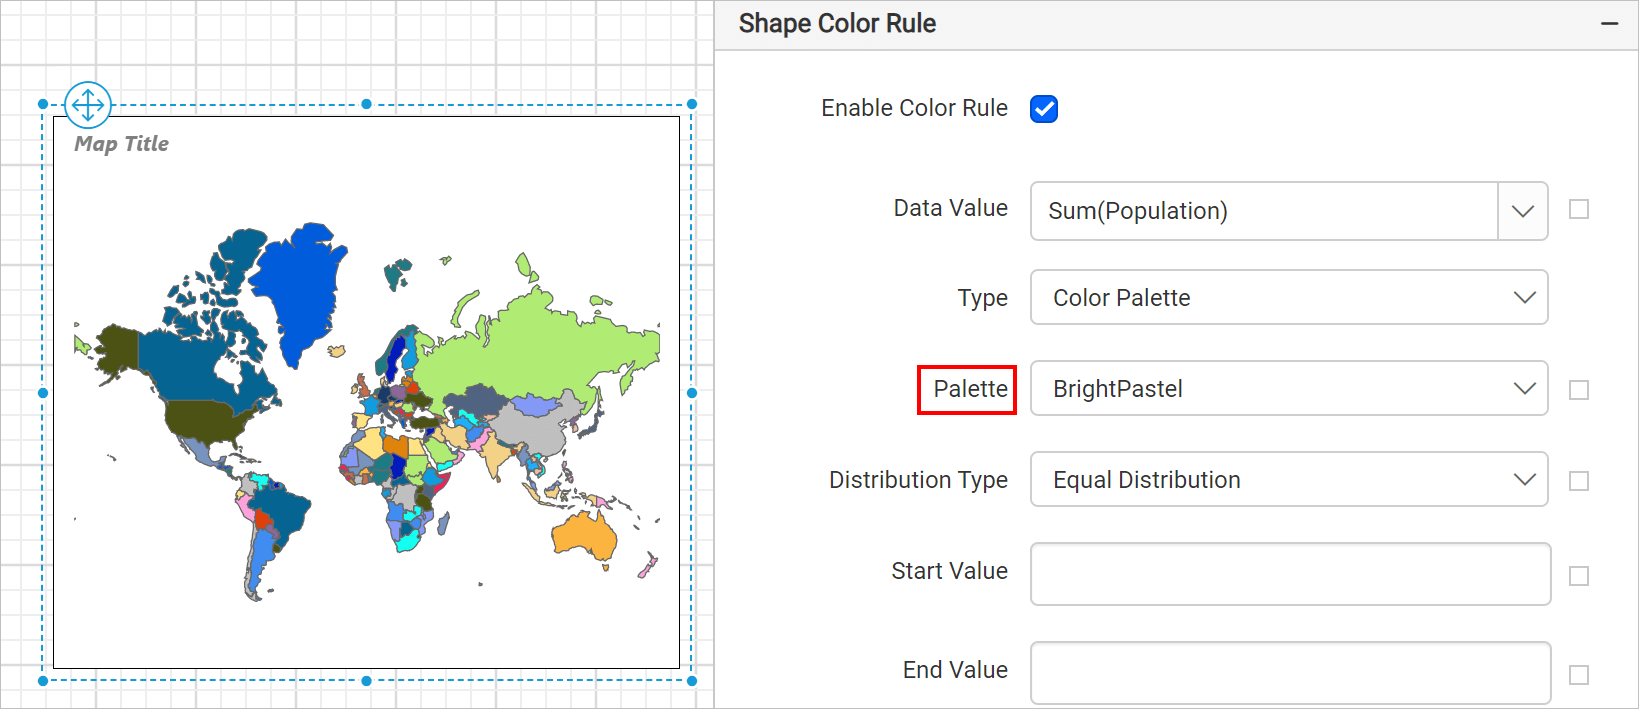
During report processing, Bold Reports® automatically distributes the map shape colors on the map surface based on the selected palette and distribution type.
Is there a use case example?
Yes. See the Design map using color palette rule section to design a simple election results analysis report by using the color palette rule in the Bold Reports® map report item.