Shape color rule
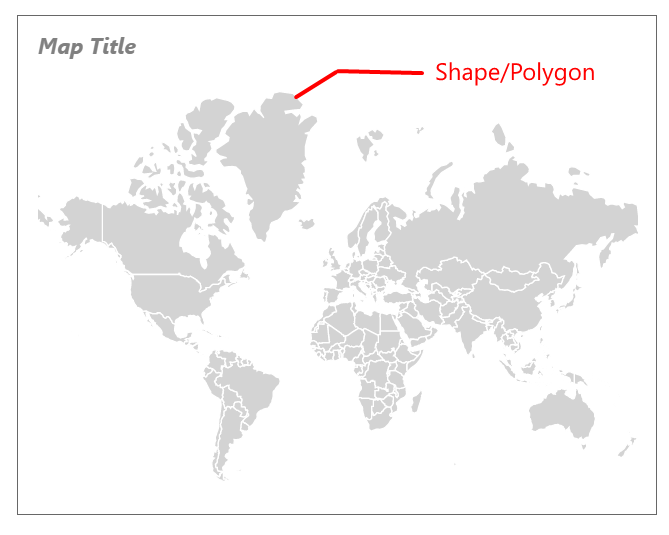
The shape color rule properties can be used to define color filling rules for map shapes/polygons with a user specified number of ranges. The shape color rules plays major role when designing choropleth maps.
Rules
It has three rules to apply colors on map shapes,
Similarly, it has four distribution types to distribute colors on map shapes,
Define shapes color rule
Shape color rules can be applied once you match the map shapes based on shape data and analytical data from a data set field.
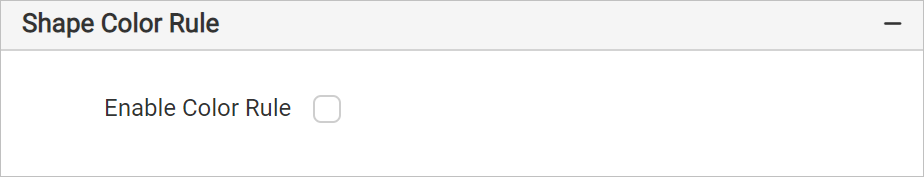
These properties are listed under Shape Color Rule in the map properties. To enable/disable shape color rule in the map surface, toggle the Enable Color Rule checkbox.
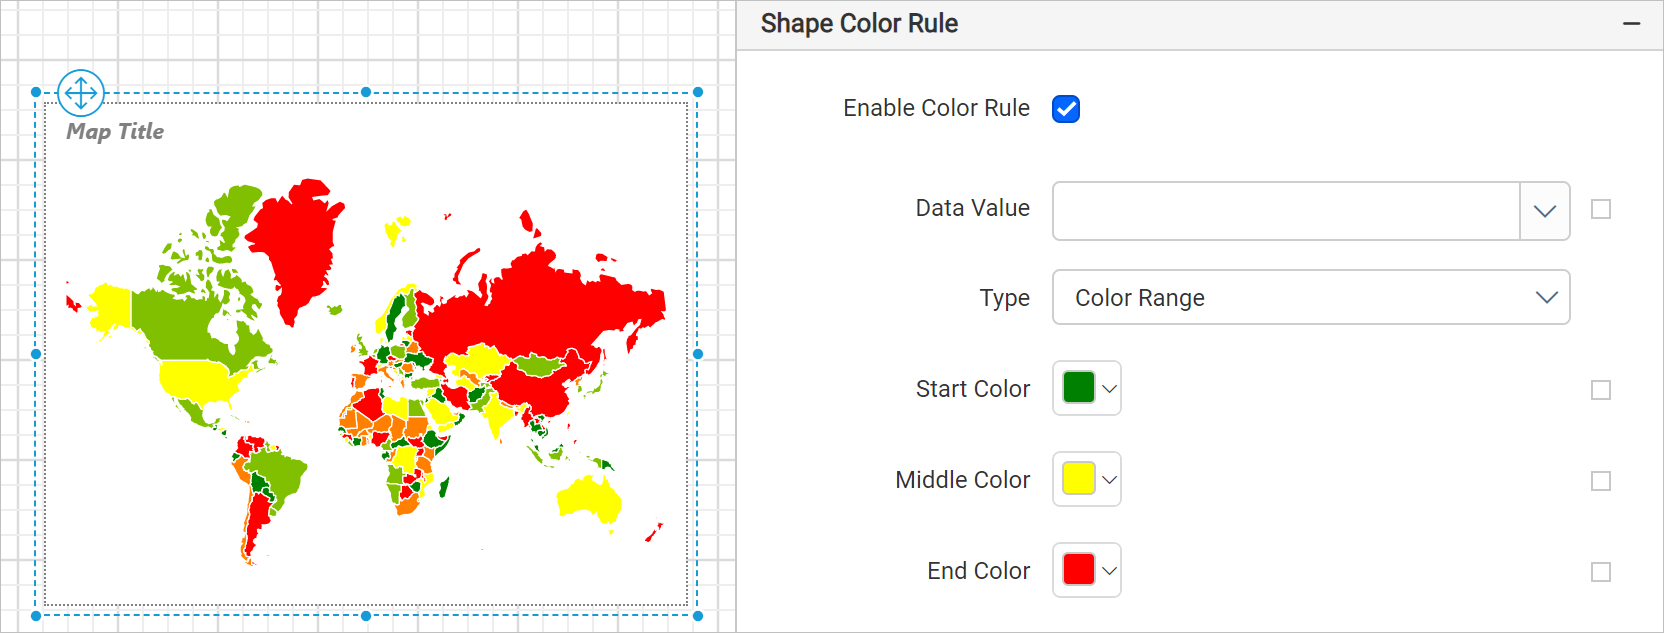
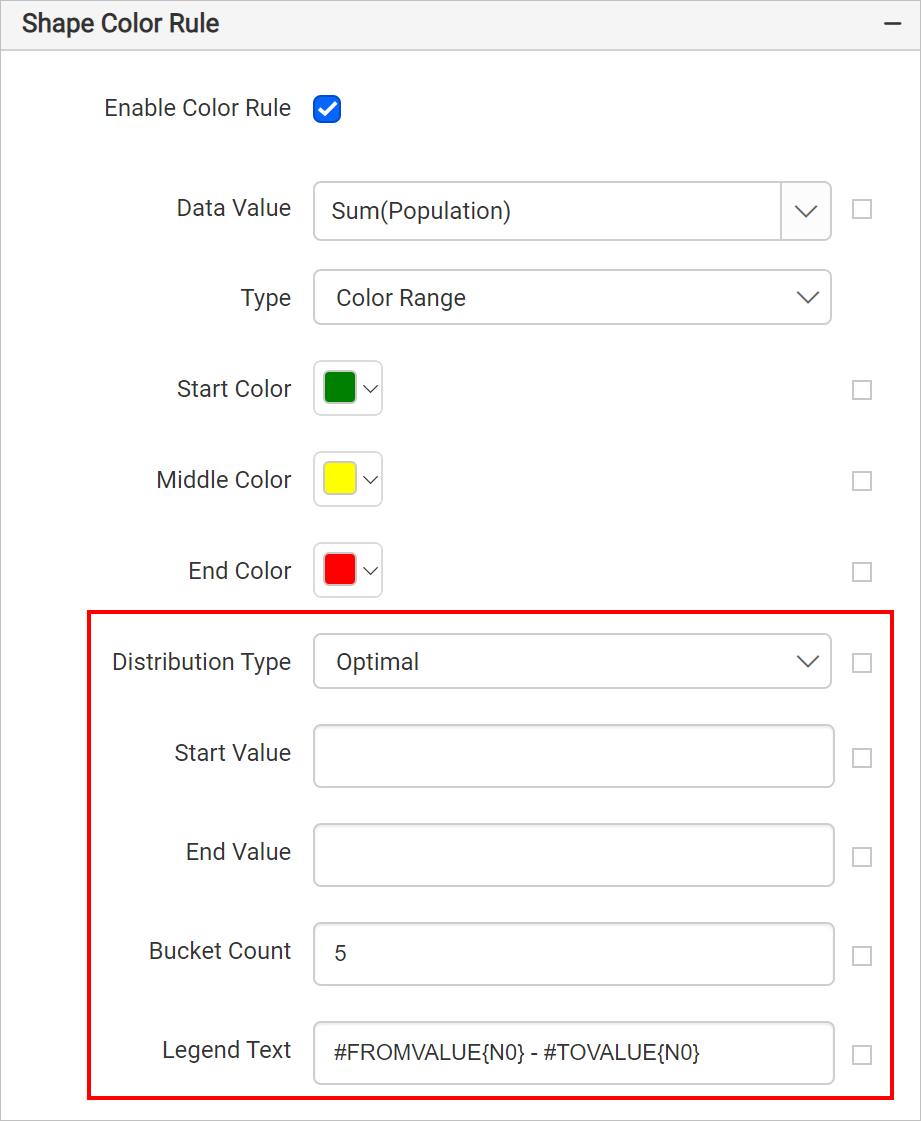
Once you enable the shape color rule, other properties required for defining shape color rule will start displaying under Shape Color Rule category and by default Color Range type will be applied on the map surface as shown below,
Data value
The data value field will list the available shape data fields and analytical data fields depending on the source of shape data and analytical data in the report.
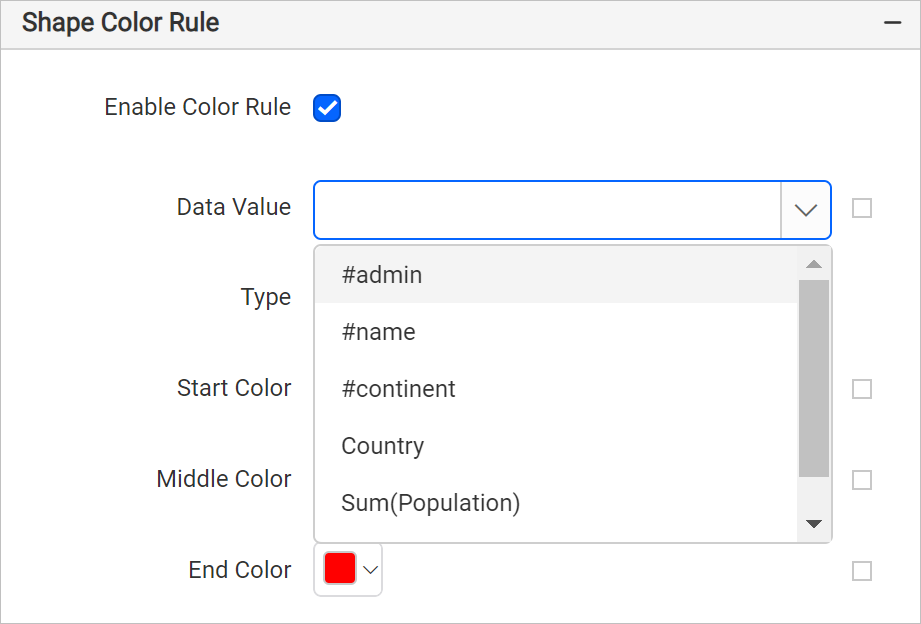
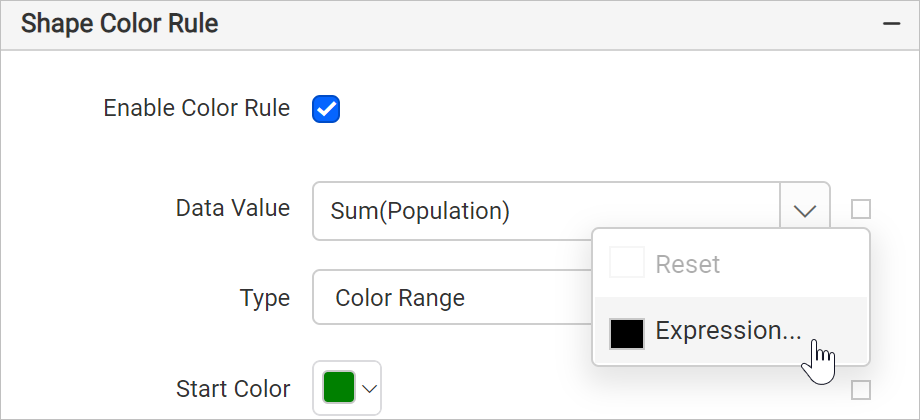
For example, to display population of each country on a map, you have to choose sum of population data field as data value. You can also set data value based on dynamic values, by using the Expressions. Refer Set Expressions and Reset Expressions section to open set/reset expression menu in properties panel.
Type
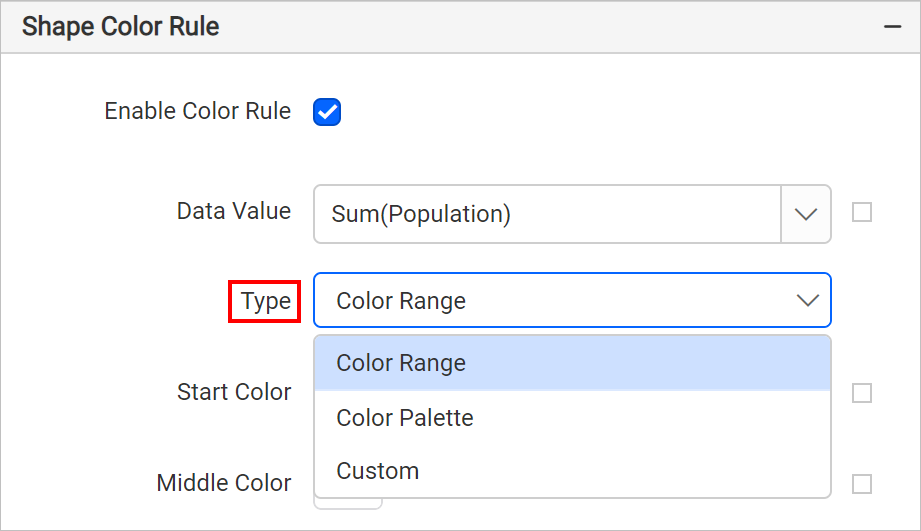
As explained earlier, the map shape color rule has three types of color rules: Color Range, Color Palette, and Custom. These options are listed in the Type drop-down,
Refer following sections to learn about each shape color rule,
Distribution type
The color distribution options govern the way colors are visualized on the map surface. Once you set value for Data Value property, the properties required to configure distribution type will start displaying under shape color rule category,
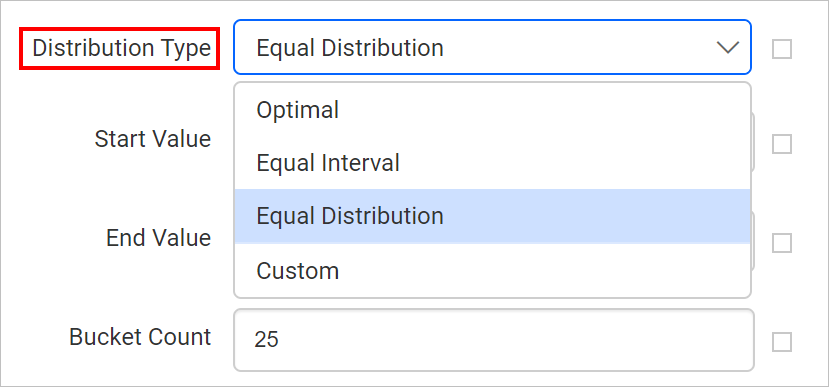
These options are listed in the Distribution Type drop-down,
Refer the following sections to design map using each distribution type,
On report preview, based on the selected distribution type the analytical data will be split into ranges and the specified color rules will be applied to the map shapes.