Overview
A map is a data visualization report item that can be used to present analytical data with a geographical background. It helps to visualize factors such as population density, election results, sales, weather, and popularity of social networking sites.
Map report item requires two types of data to visualize things on it. One is shape data and the other is analytical data(optional). Set of coordinates are called shape data. It can be a geodesic coordinates or geometric coordinates. Shape data defines the physical appearance of map whereas analytical data provides values to the shapes in it. For example, to display population of each country on a map, you need country name and population count as analytical data and country name and country location as shape data. To display such data on a map we must match the shape data and analytical data. If both comes from same source, the matching will be known. Otherwise, you have to define the matching manually.
Map report item supports single map layer. Each shape is also called as Polygon. A map layer can display either a build-in or custom shape data.
The Report Designer supports to create three types of map: a basic map that displays only locations, a color map varies map shape colors based on ranges of analytical data and a marker map that displays different marker styles based on ranges of analytical data. To render each type of map, we have to specify the rules that vary style or distribute colors on map shapes based on range of analytical data.
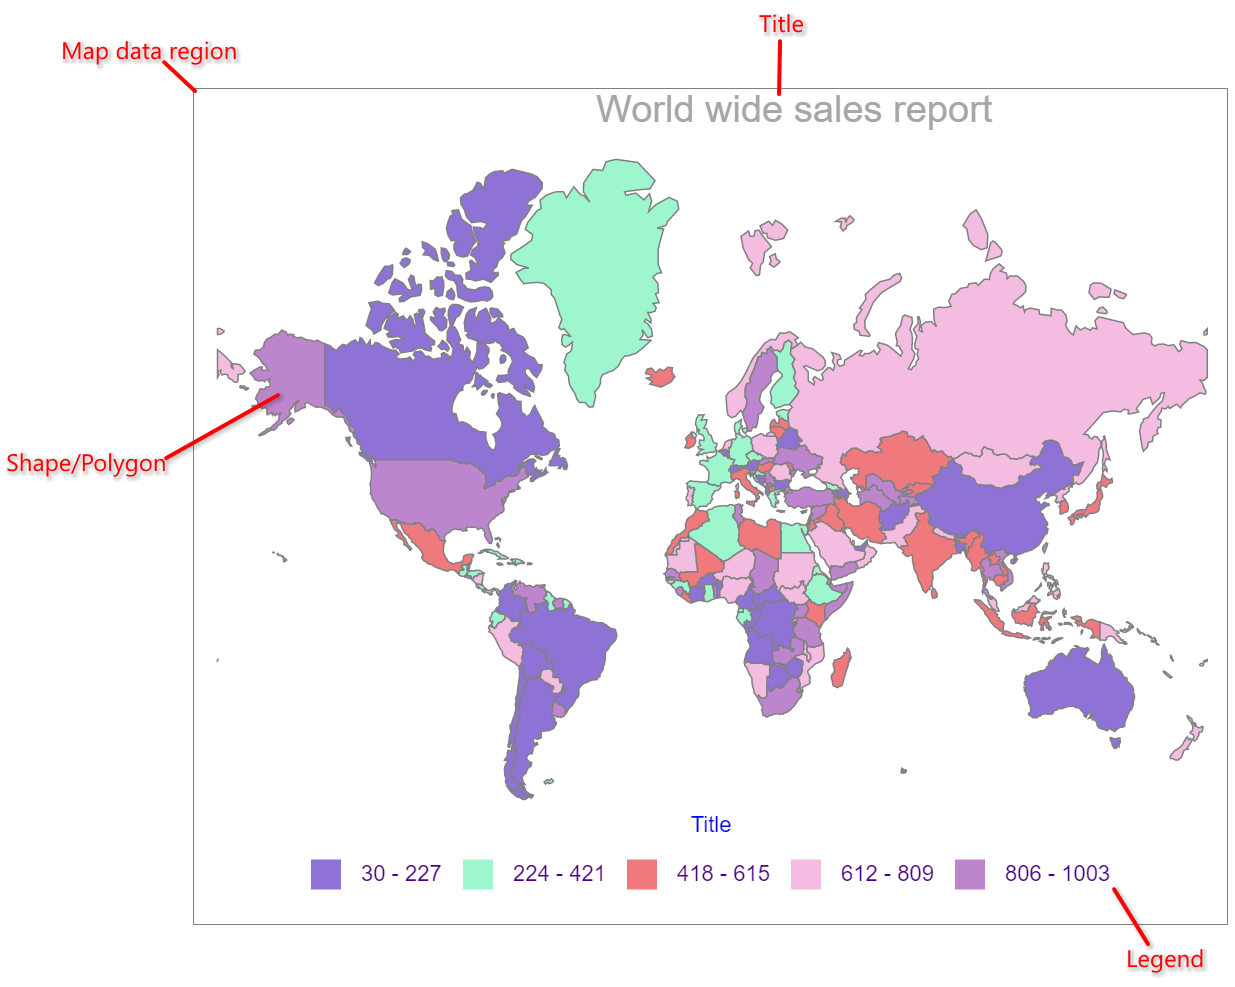
Map parts
The following snap shows the different elements used in the map.
Add map to the report
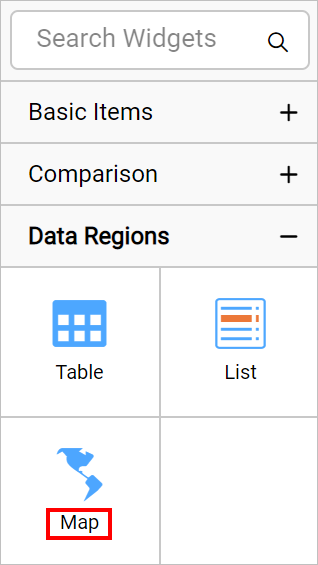
The Map report item is listed under Data Regions category in the item panel.
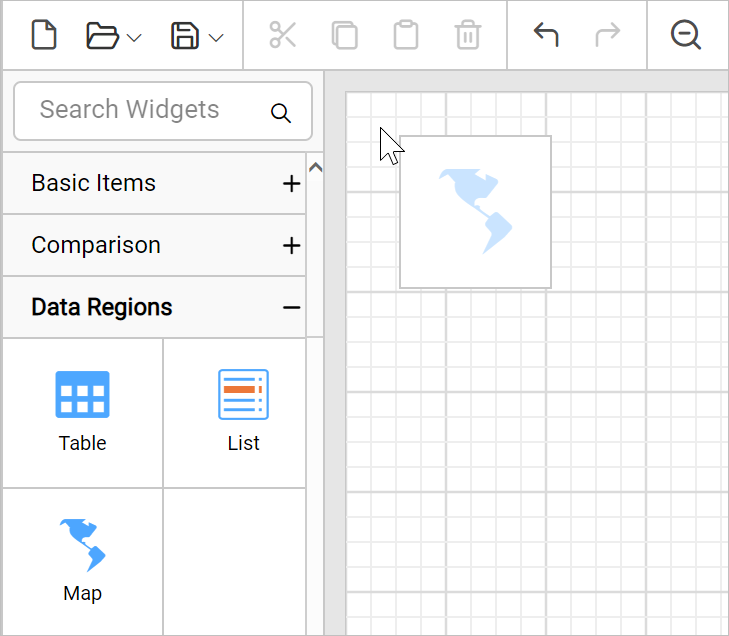
To add a Map report item to the report, drag and drop the map from the item panel into design area.
Now, the map item will be rendered in the design area and the map properties will be listed in properties panel.
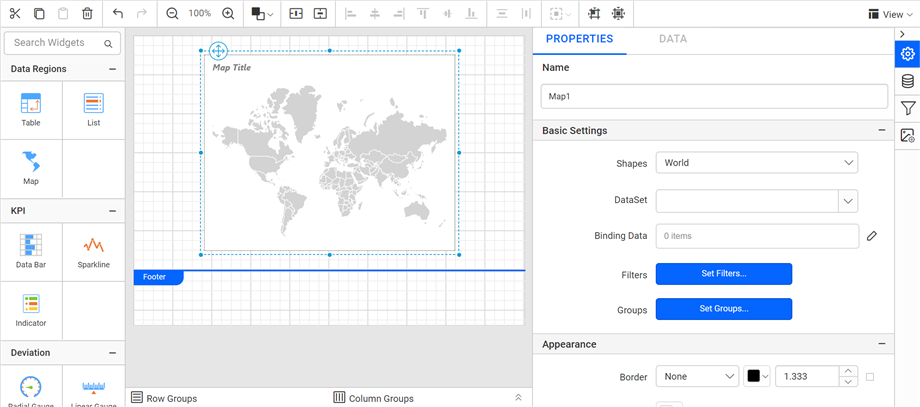
Configure data and format the map to visualize the analytical data with a geographical background.
By default map report item renders with world map shapes.
Design RDL report using map
Refer Design ssrs RDL report using map section to learn how to design a simple map in your report.