Tablix groups in Bold Reports® Web Report Designer
In the Bold Reports® Web Report Designer, a tablix group organizes the report dataset in a data region. Groups help you present different views of the same data in data regions.
The following image shows the areas of a tablix region with nested row groups and column groups.

Groups are organized as members of one or more hierarchies for each data region. A group hierarchy has parent/child groups that are nested and can have adjacent groups. Data associated with row group members expands horizontally across the page and data associated with column group members expands vertically down the page. The Grouping panel displays row group and column group members for the currently selected tablix data region on the design surface.
How do I create groups?
A group in a Bold Reports® tablix has a name and a set of group expressions. The set of group expressions can be a dataset field or a combination of multiple expressions. During data processing, the group expressions are combined and the resultant data is applied to the specific group. For example, a group can use a date field to organize the data in the data region. On report preview, data is organized by date, and then displayed with other dataset values for each date.
By default, table, matrix, or list report items are created with the Details group only. You can create groups manually to organize and group data in the tablix data regions.
What group types are available?
A Bold Reports® tablix supports row groups, column groups, and the details group.
-
Row groups and column groups - The data can be organized into groups by rows or columns. On report preview, the row groups expand vertically on a page and the column groups expand horizontally on a page. You can create a nested group or adjacent groups in the data regions. When you create a group for a data region, a set of rows or columns is added to the data region, and these rows or columns display the group data. Refer to the Row Groups and Column groups sections to create groups in a tablix data region.
-
Details Group - The Details group displays all data from the dataset after applying the dataset and data region filters. The
Detailsgroup is the only group that has no group expression. By default, a table or list report item is created with the Details group and adds a row to display the detail data. On report preview, the details row repeats once for every value in the data applied to the respective data region. Refer to the Create Details Group section to create a details group in a tablix data region.A details group is added as a child group in the Grouping panel, you cannot add child group to the details group further.
How do I edit group properties?
You edit group properties such as filters, sort, and groups expressions in the Bold Reports® Web Report Designer after you create groups. These properties organize the data visualization of the respective group in the data region. To edit an existing group, select the respective member in the Row or Column Groups pane of the grouping panel. The member properties are listed in the properties panel.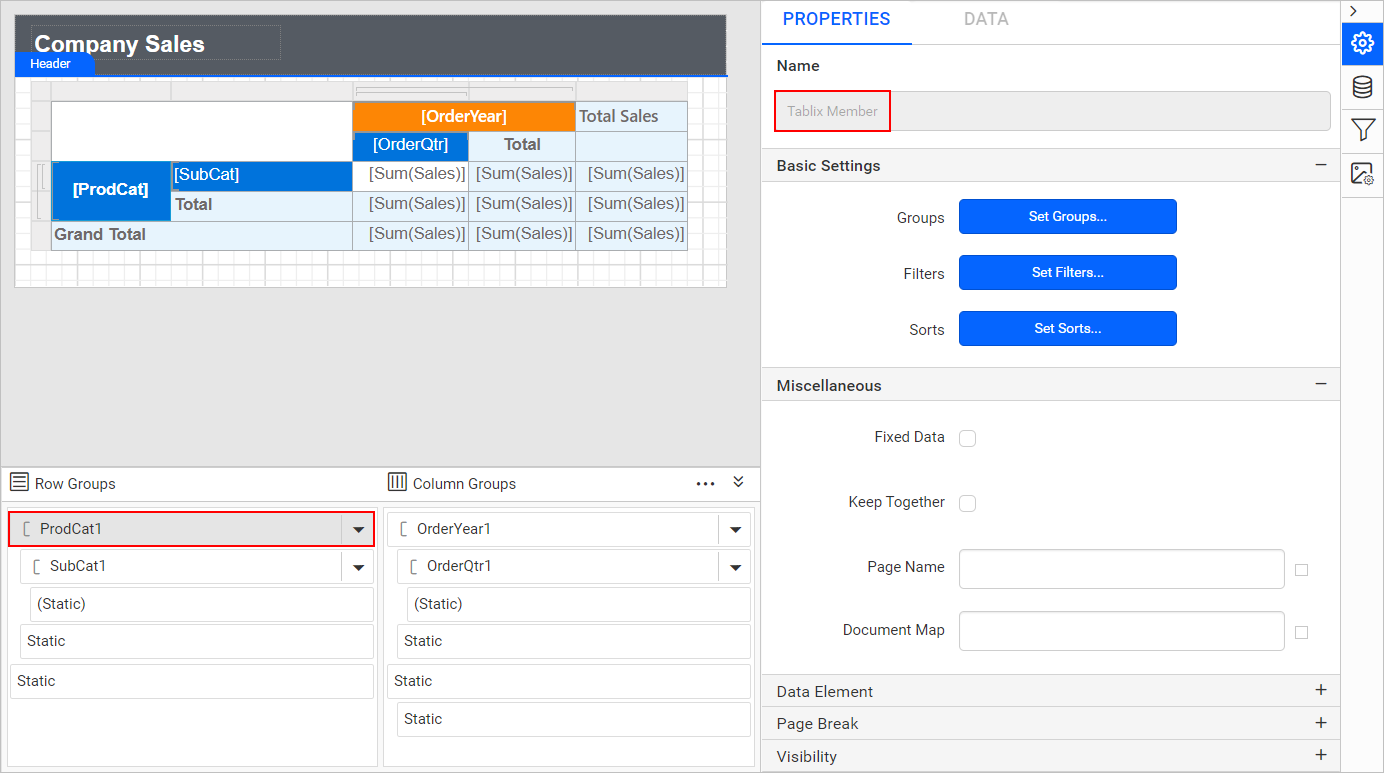
Refer to the Group properties section to modify the group properties.
What is group scope?
Group scope in a Bold Reports® tablix is defined by the hierarchy in which the groups are created in the data regions. You can create a nested group or adjacent groups in the data regions. To help you understand the scope of the groups in the selected tablix data region:
-
The visual cues are provided in the tablix data regions.

-
The groups are listed as tree structure in the grouping panel.
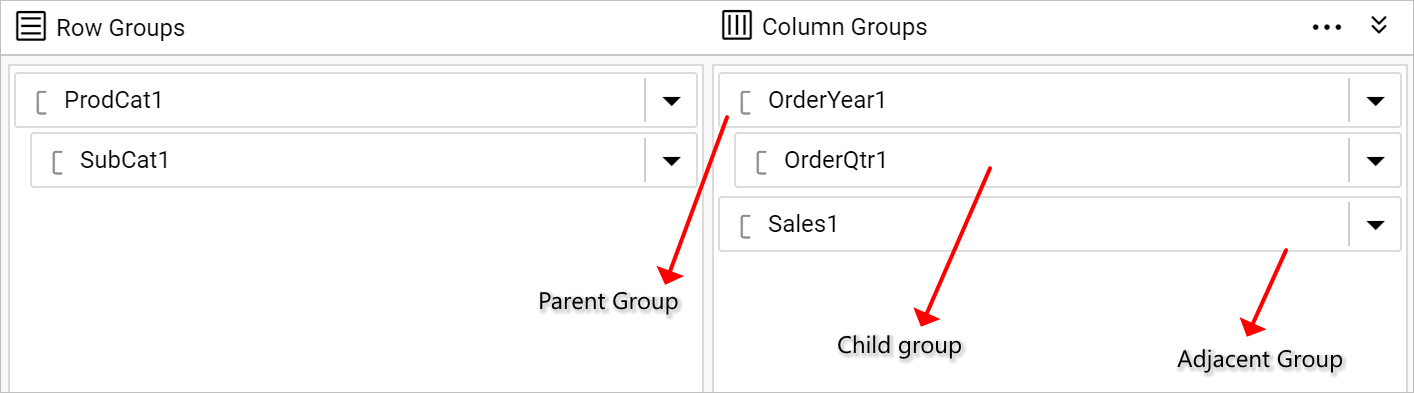
To understand the visual cues in the grouping panel, refer to the Grouping Panel Visual Cues section.