Chart Nested Data Regions
The data region such as a chart can be placed inside the another data region such as a tablix, to link more than one data region to the same dataset. This will provide different views of the same data. In the below steps, sales of each sub-category products for each product category group and order year is designed using chart and matrix data region.
Create dataset
To present data in the matrix format, create a dataset and bind data to the matrix data region. In this designing section, the following dataset query is used for dataset creation.
SELECT PC.Name AS ProdCat, PS.Name AS SubCat, DATEPART(yy, SOH.OrderDate) AS OrderYear, 'Q' + DATENAME(qq, SOH.OrderDate) AS OrderQtr,SUM(SOD.UnitPrice * SOD.OrderQty) AS Sales
FROM Production.ProductSubcategory PS INNER JOIN
Sales.SalesOrderHeader SOH INNER JOIN
Sales.SalesOrderDetail SOD ON SOH.SalesOrderID = SOD.SalesOrderID INNER JOIN
Production.Product P ON SOD.ProductID = P.ProductID ON PS.ProductSubcategoryID = P.ProductSubcategoryID INNER JOIN
Production.ProductCategory PC ON PS.ProductCategoryID = PC.ProductCategoryID
WHERE (SOH.OrderDate BETWEEN '1/1/2002' AND '12/31/2003')
GROUP BY DATEPART(yy, SOH.OrderDate), PC.Name, PS.Name, 'Q' + DATENAME(qq, SOH.OrderDate), PS.ProductSubcategoryID
Refer Create Data section and create dataset using the above query.
AdventuresWorksdatabase is used here.
Add matrix to the report
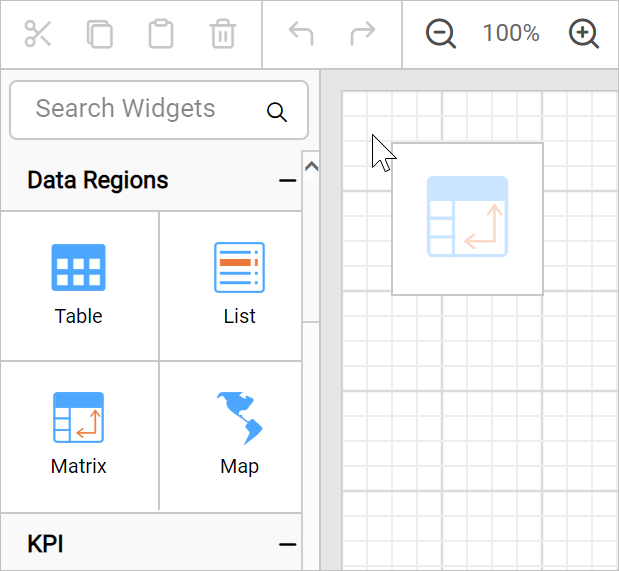
The matrix report item is listed in the item panel under the Data Regions category.

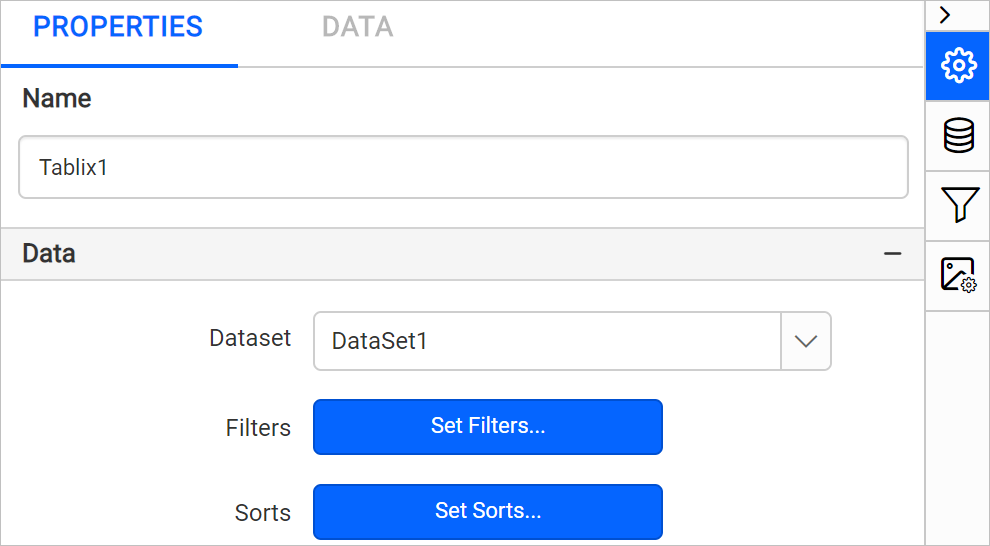
Drag and drop the matrix report item into the design area from the item panel. The properties of matrix report item will be listed in properties panel. By default, it will be named as Tablix1.
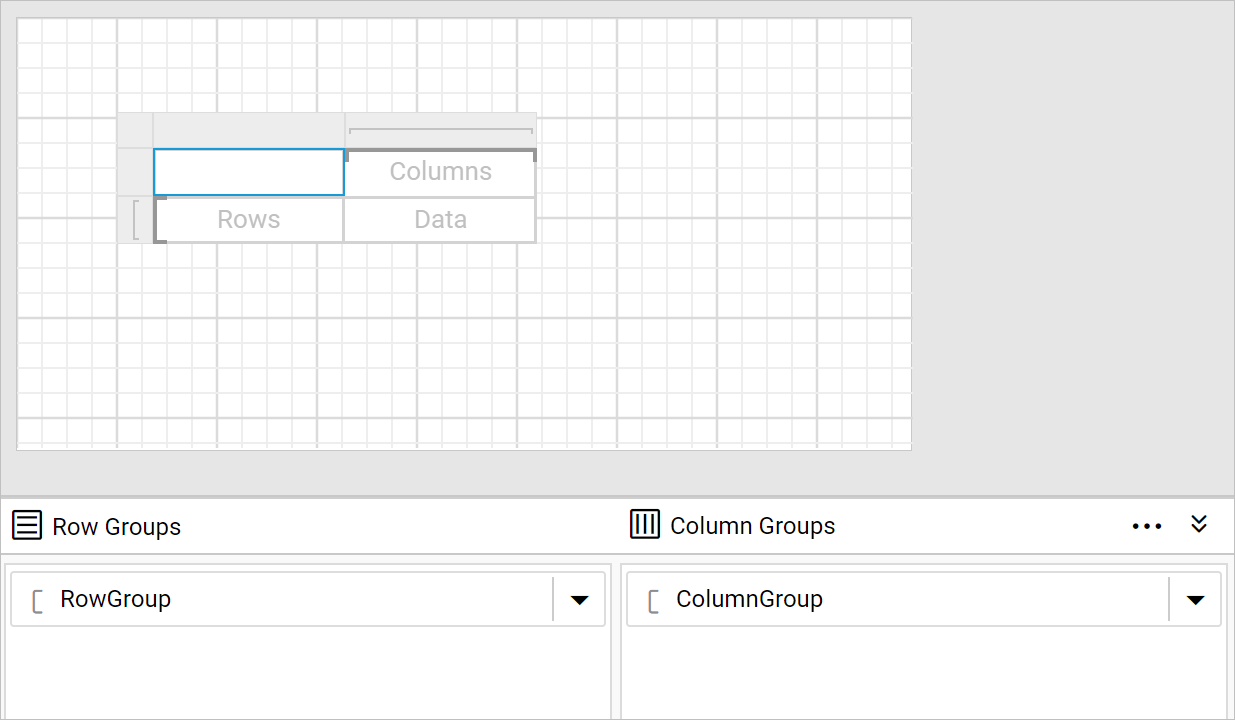
The matrix initially has empty default row group, column group and a data cell.
Assign data
Assign dataset to the Dataset property of matrix report item.
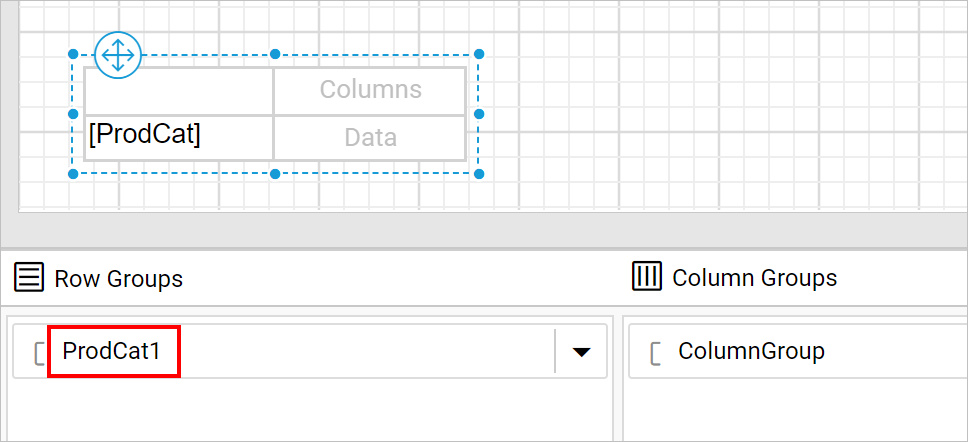
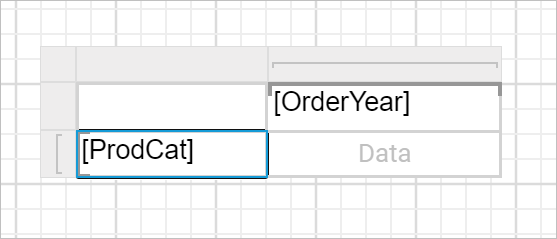
Refer Assign fields section and assign the ProdCat and OrderYear fields in initial matrix design.
The first field that we assign to the row group or column group will replace the initial empty default row group or column group. Now, I have assigned ProdCat field in row group, notice the Row Grouping pane.
Similarly, assign OrderYear in column group.
Add chart into the matrix
- Drag and drop a rectangle and place inside the second row, last cell.
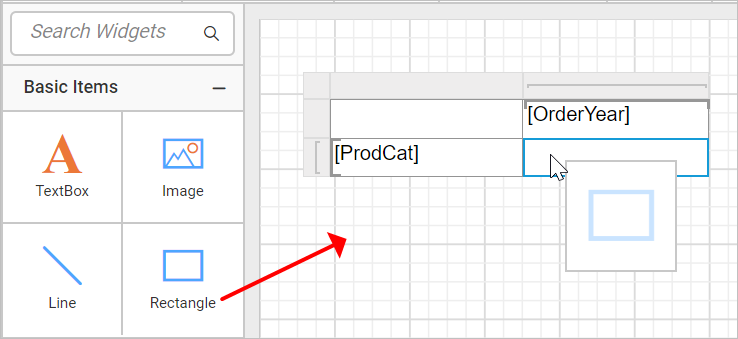
Use rectangles to control the sizing of inserted chart item.
- Now, drag a
Exploded-piechart from the item panel and place inside the rectangle.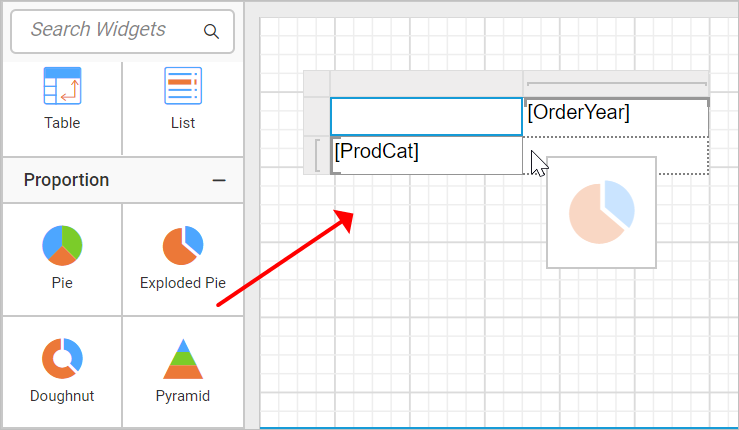
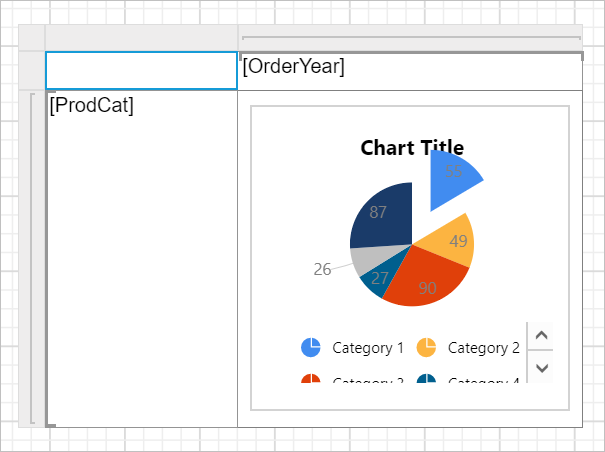
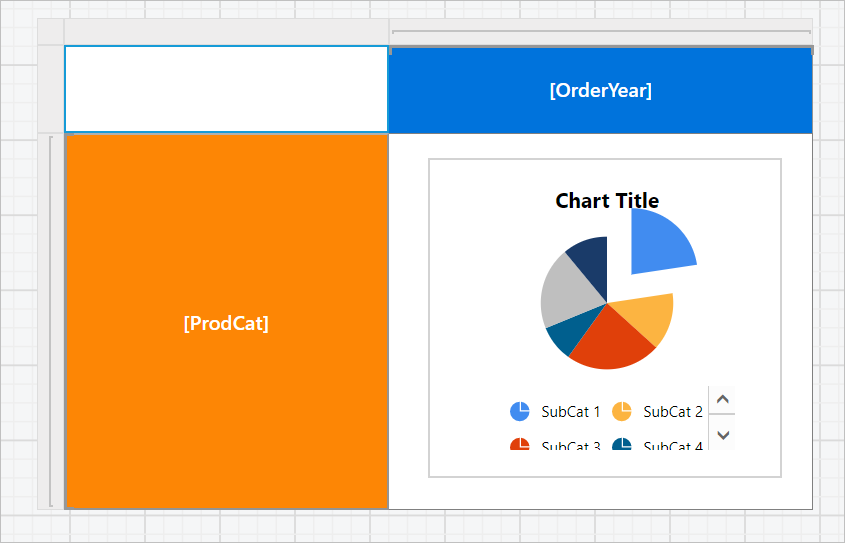
- The chart will be placed inside rectangle within table cell as below,
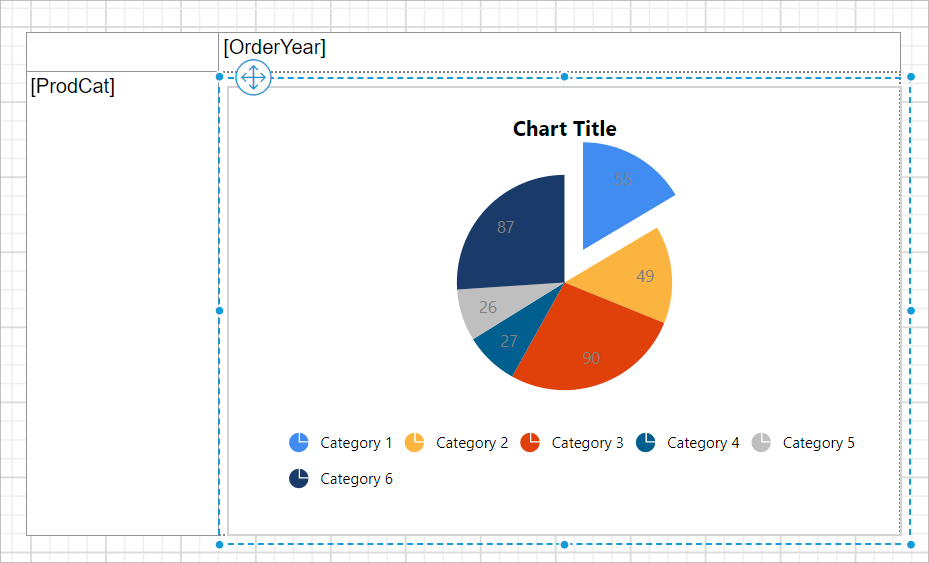
- Resize the chart and matrix design as required.
Assign data to chart
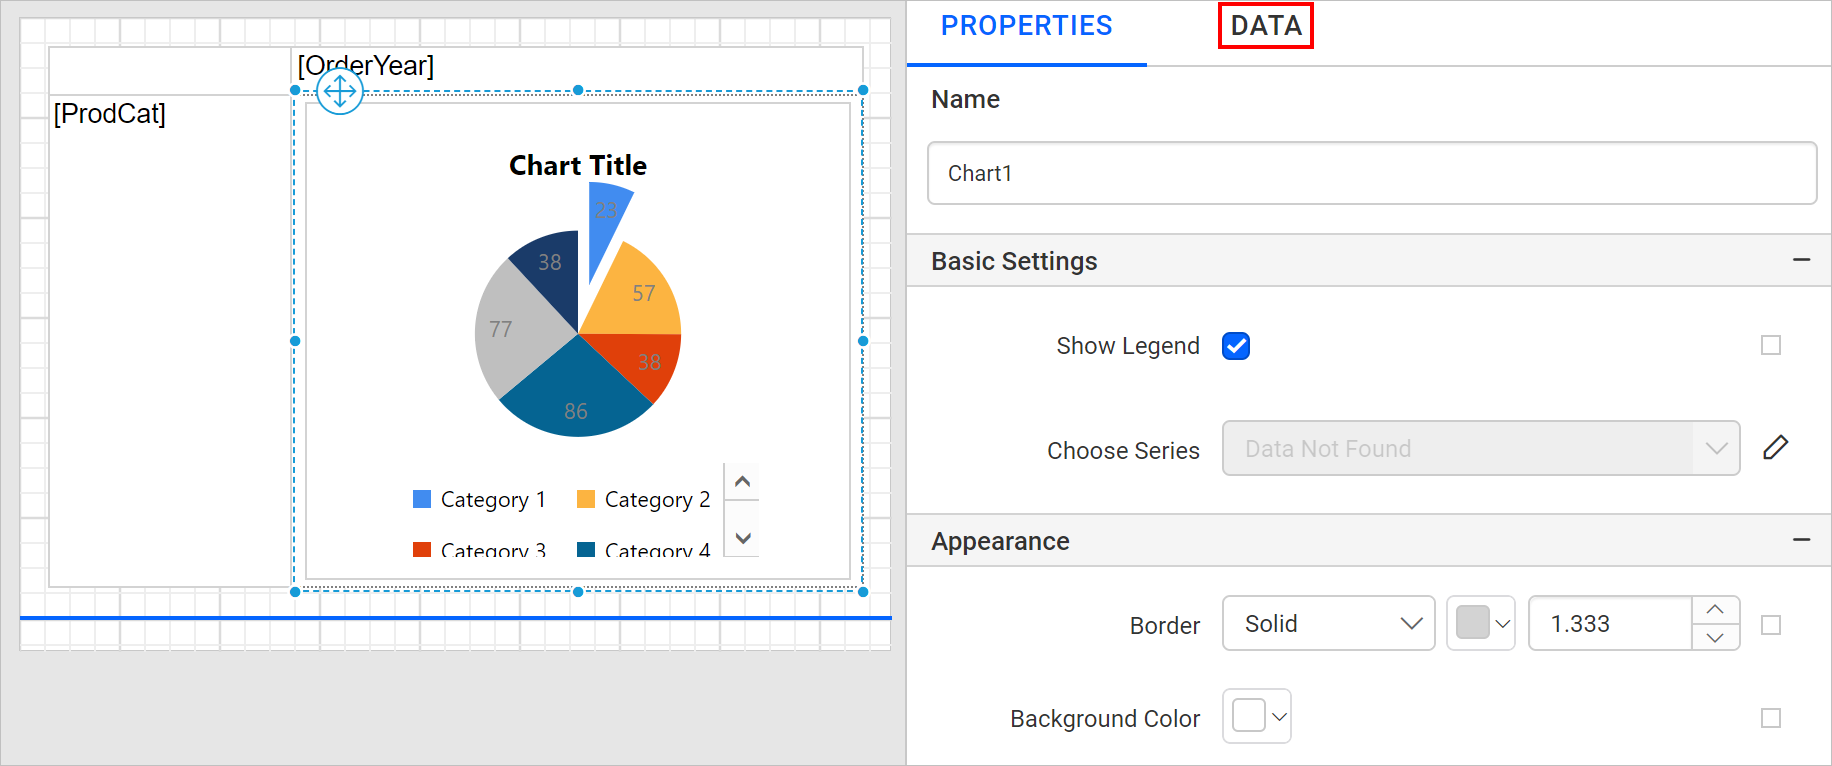
Select the chart report item in table cell. Now, the chart properties will be listed in the properties panel. Then, click on the DATA tab.
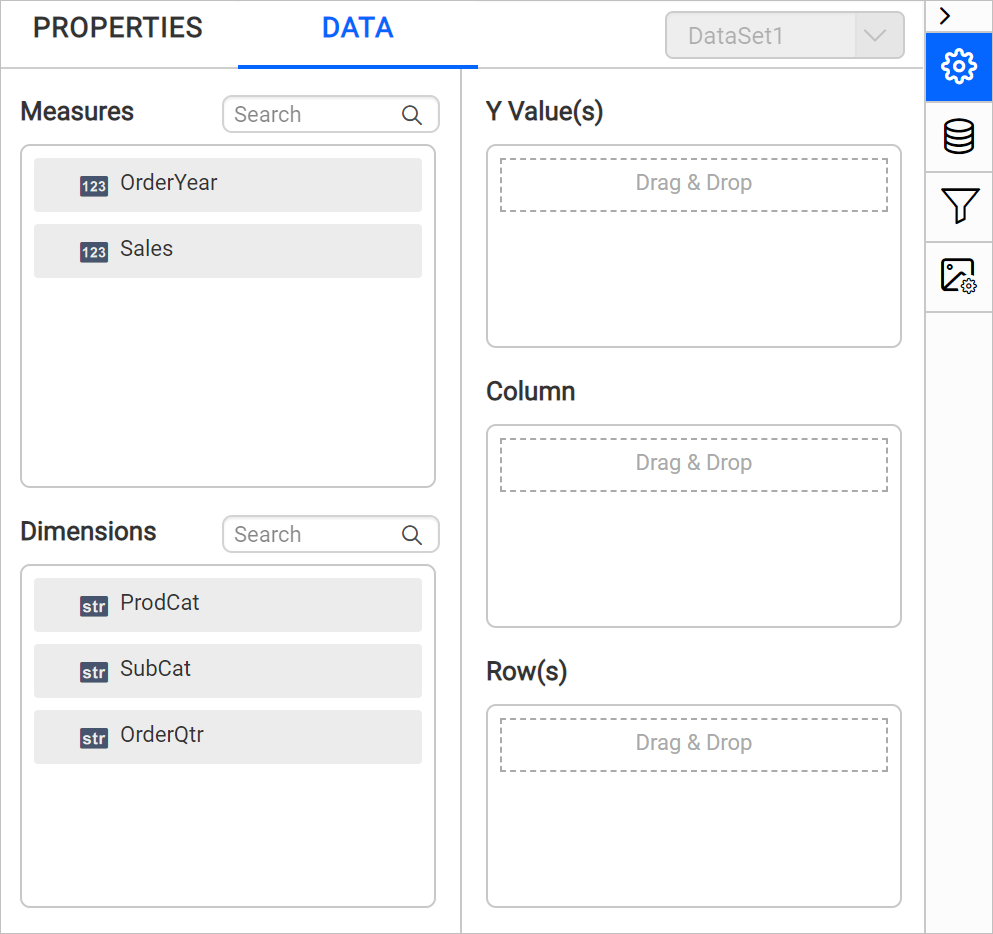
Based on the dataset assigned for parent matrix report item, the dataset field will be listed in the DATA assign panel. The numeric columns and numeric expressions are listed under the Measures section; other type of columns and dimension expressions are listed under the Dimensions section.
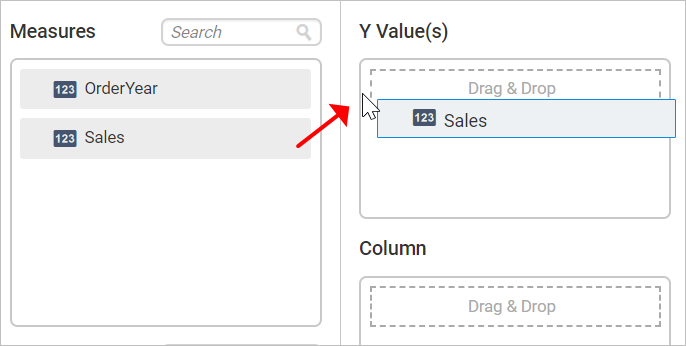
Now, drag and drop Sales field from Measures section and drop it in the Y Values section.
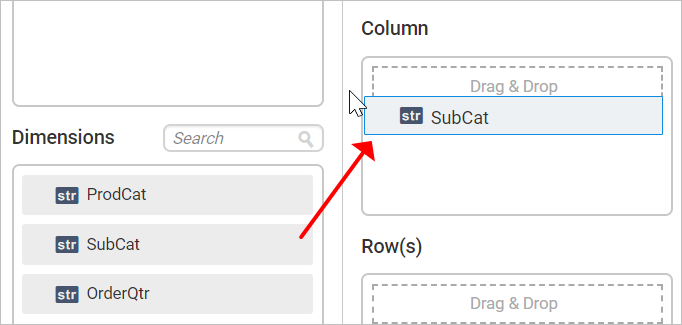
Then, drag and drop SubCat field from the Dimensions section to measure against any of the selected numeric column(s) in Y Value(s) section, and drop into the Column section.
Format matrix
In the below design background color and font styles are changed in matrix cells to improvise the report design.
Refer the Cell Properties to style the matrix cell.
Format chart
Select the chart in the table cell. Now, the chart properties will be listed in the properties panel.
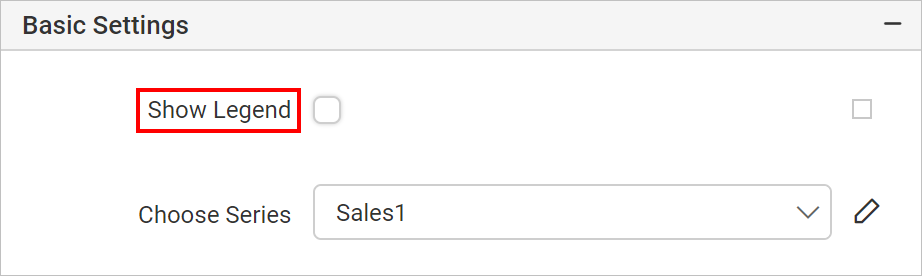
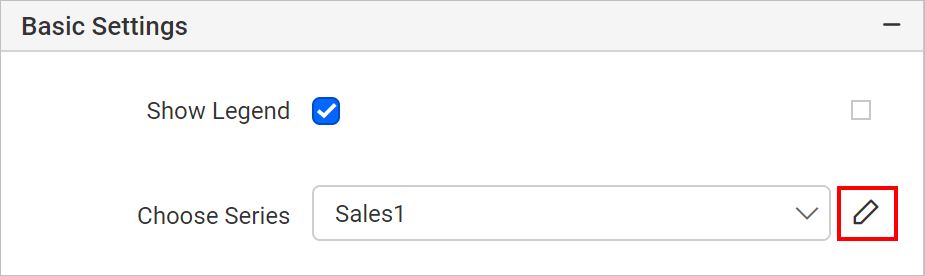
Disable the show legend checkbox,
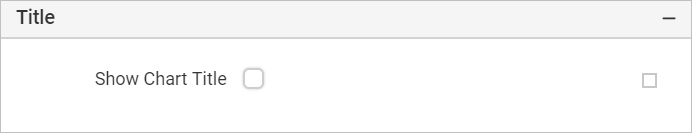
Disable the chart title property,
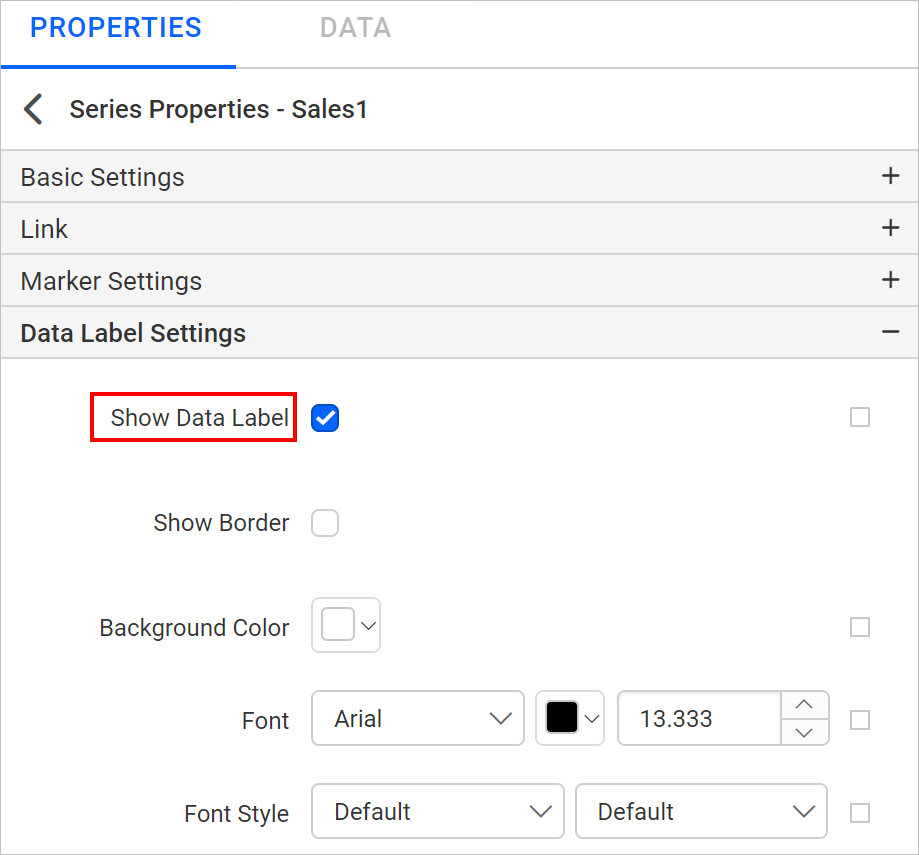
Edit the Sales series properties.
Under Data Label Settings, enable the chart data label checkbox.
Now, set the data label text value as #AXISLABEL in the Label property.
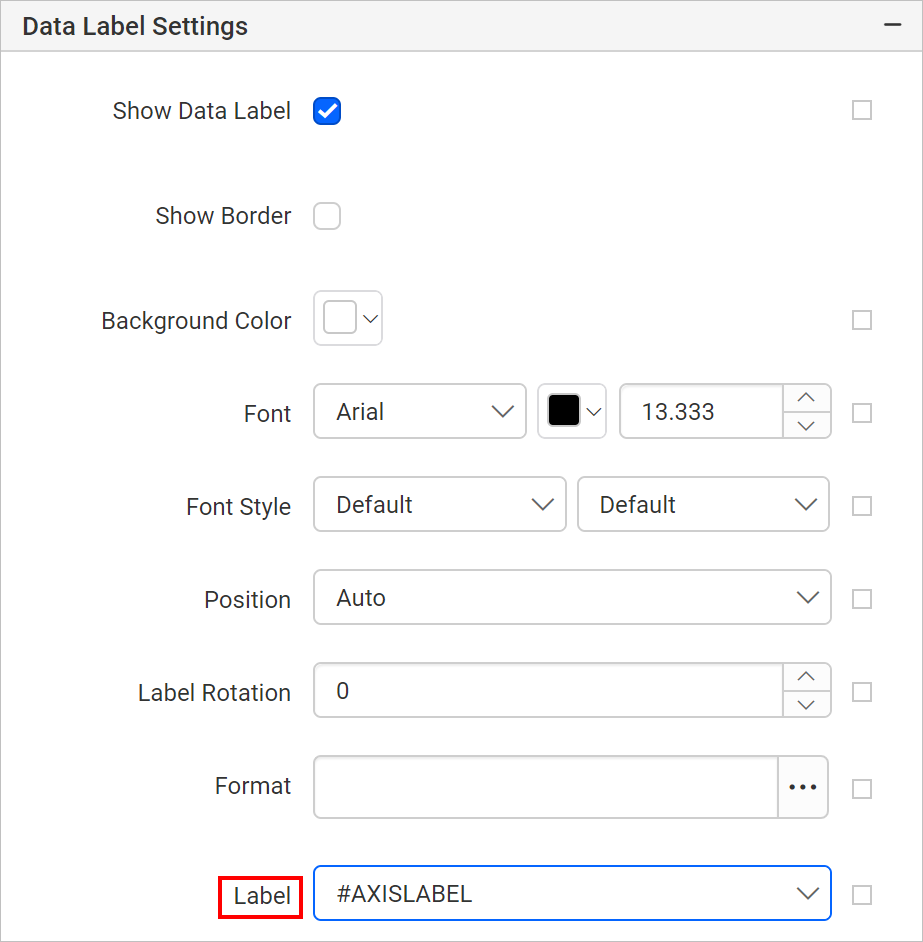
Refer Show Data Label section to customize data label in chart.
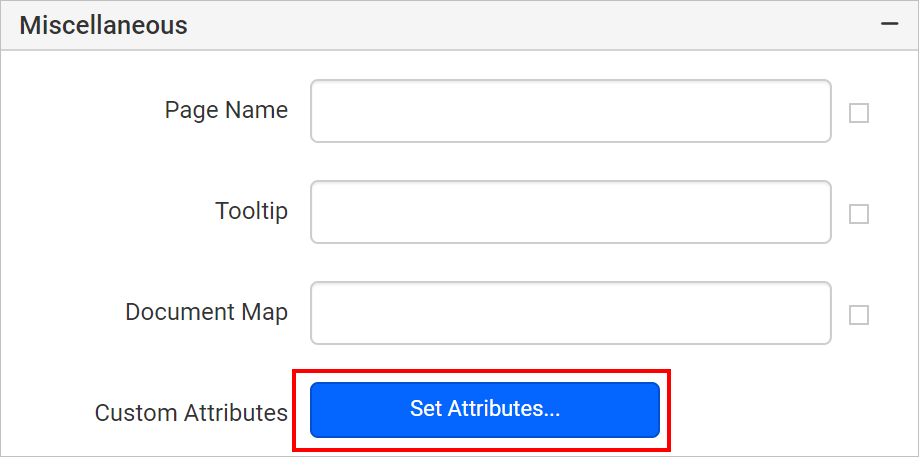
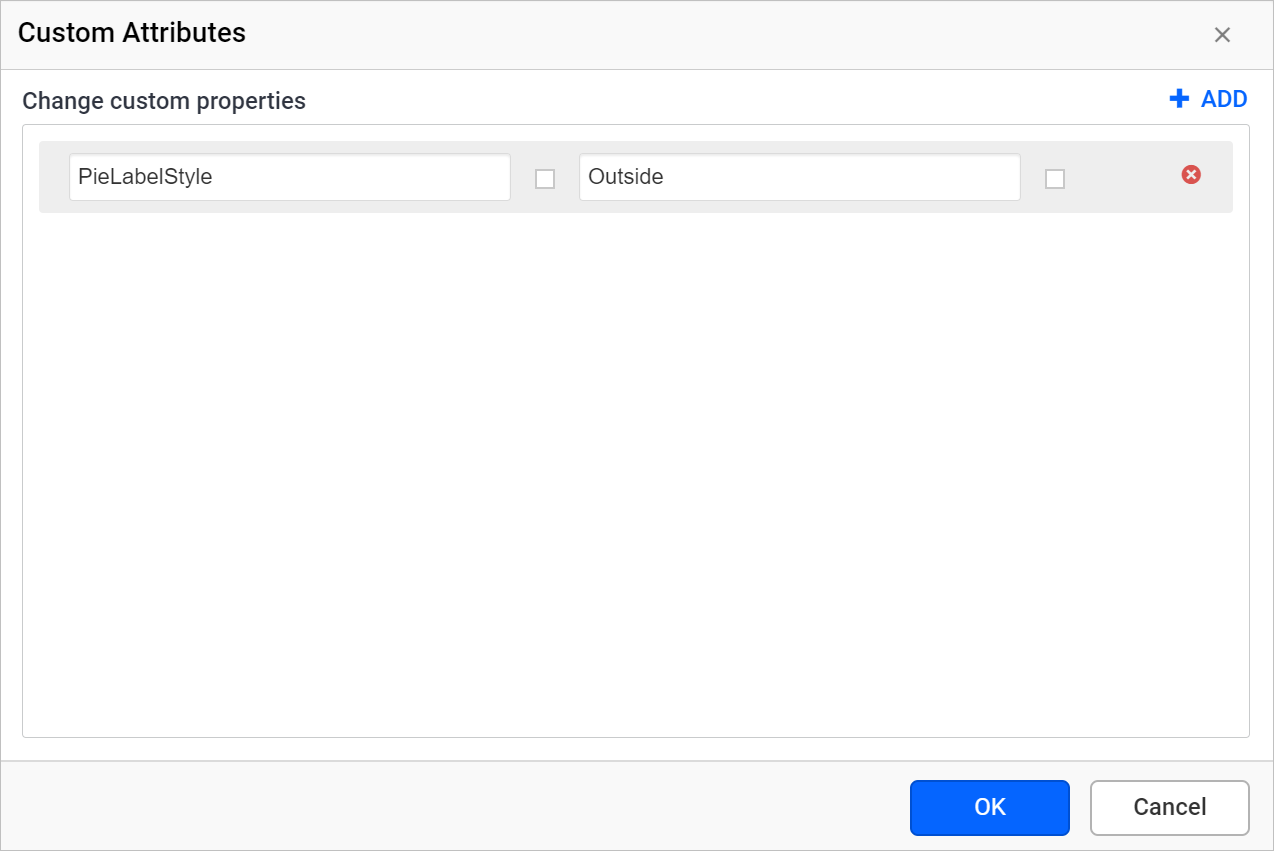
To set label position for pie chart, set PieLabelStyle=Outside custom attributes property.
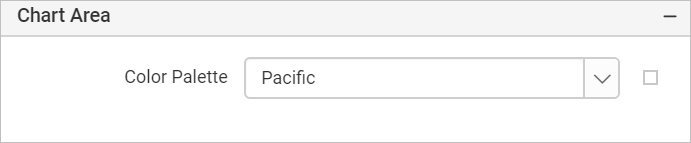
Set the series color using the Color Palette property.
You can further customize the appearance of the chart using the chart properties in properties panel.
Final design
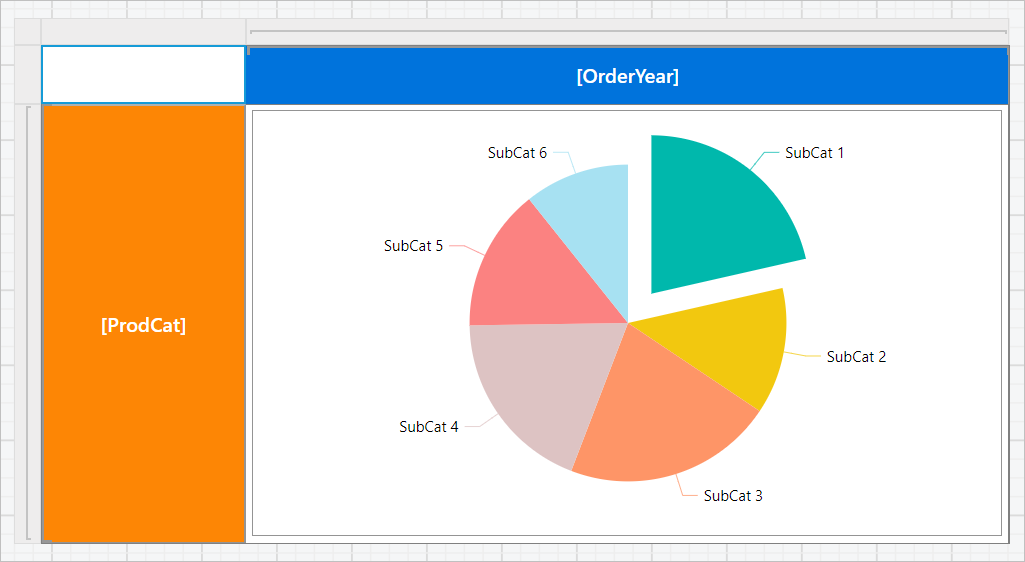
Resize the tablix data region to the required size in the design area. Now, the final design will look like below,
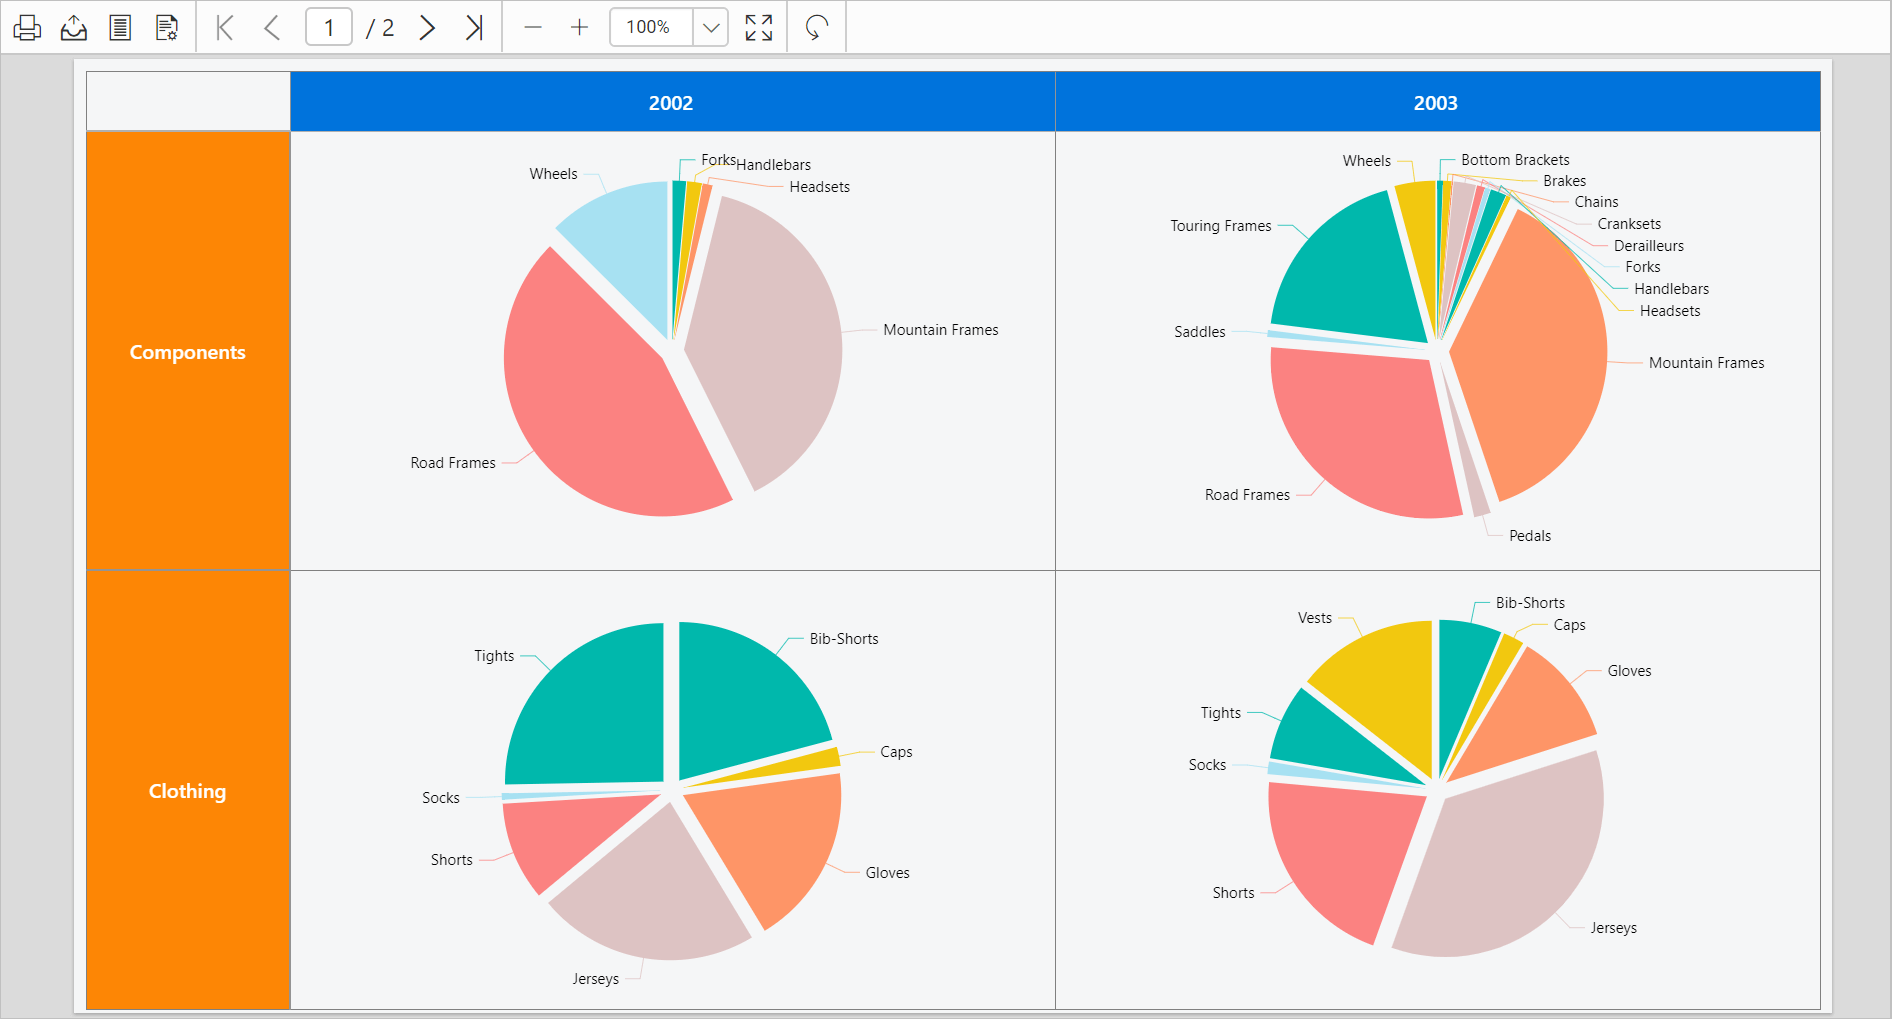
Report preview
To see the report preview, click on the Preview button in the top-right corner of the report header.
Download the above report design from link.