Chart Data Label
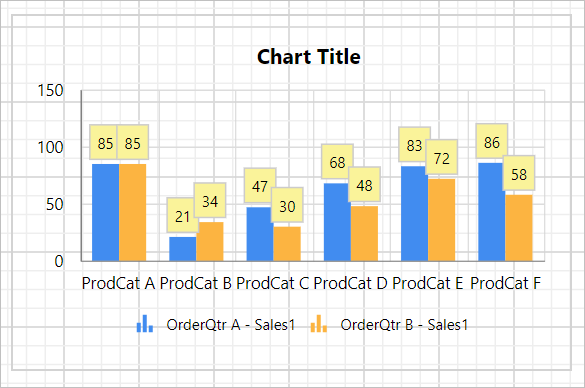
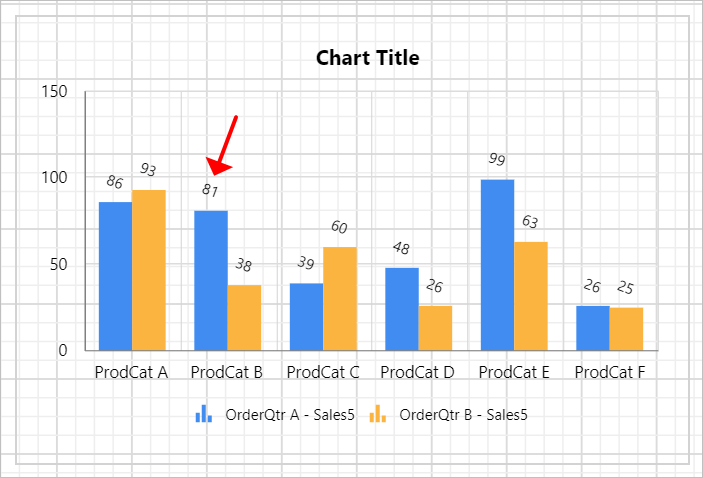
Data label can be added to a chart series by using the Show Data Label property. The labels appear at the top of the data point, by default.
Show or hide data label
To show/hide data label in the chart series, toggle the Show Data Label checkbox in the properties panel.
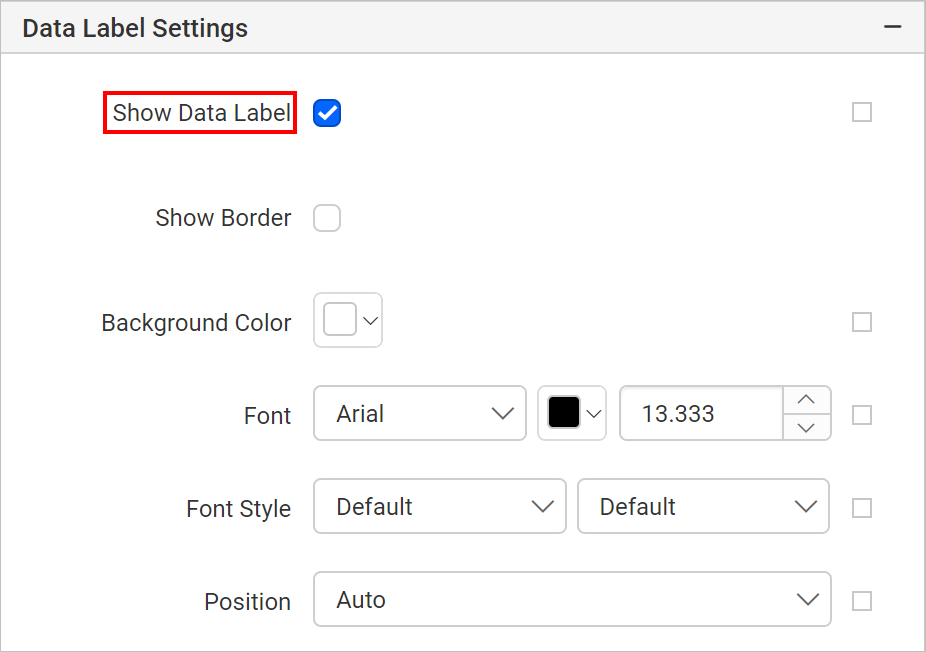
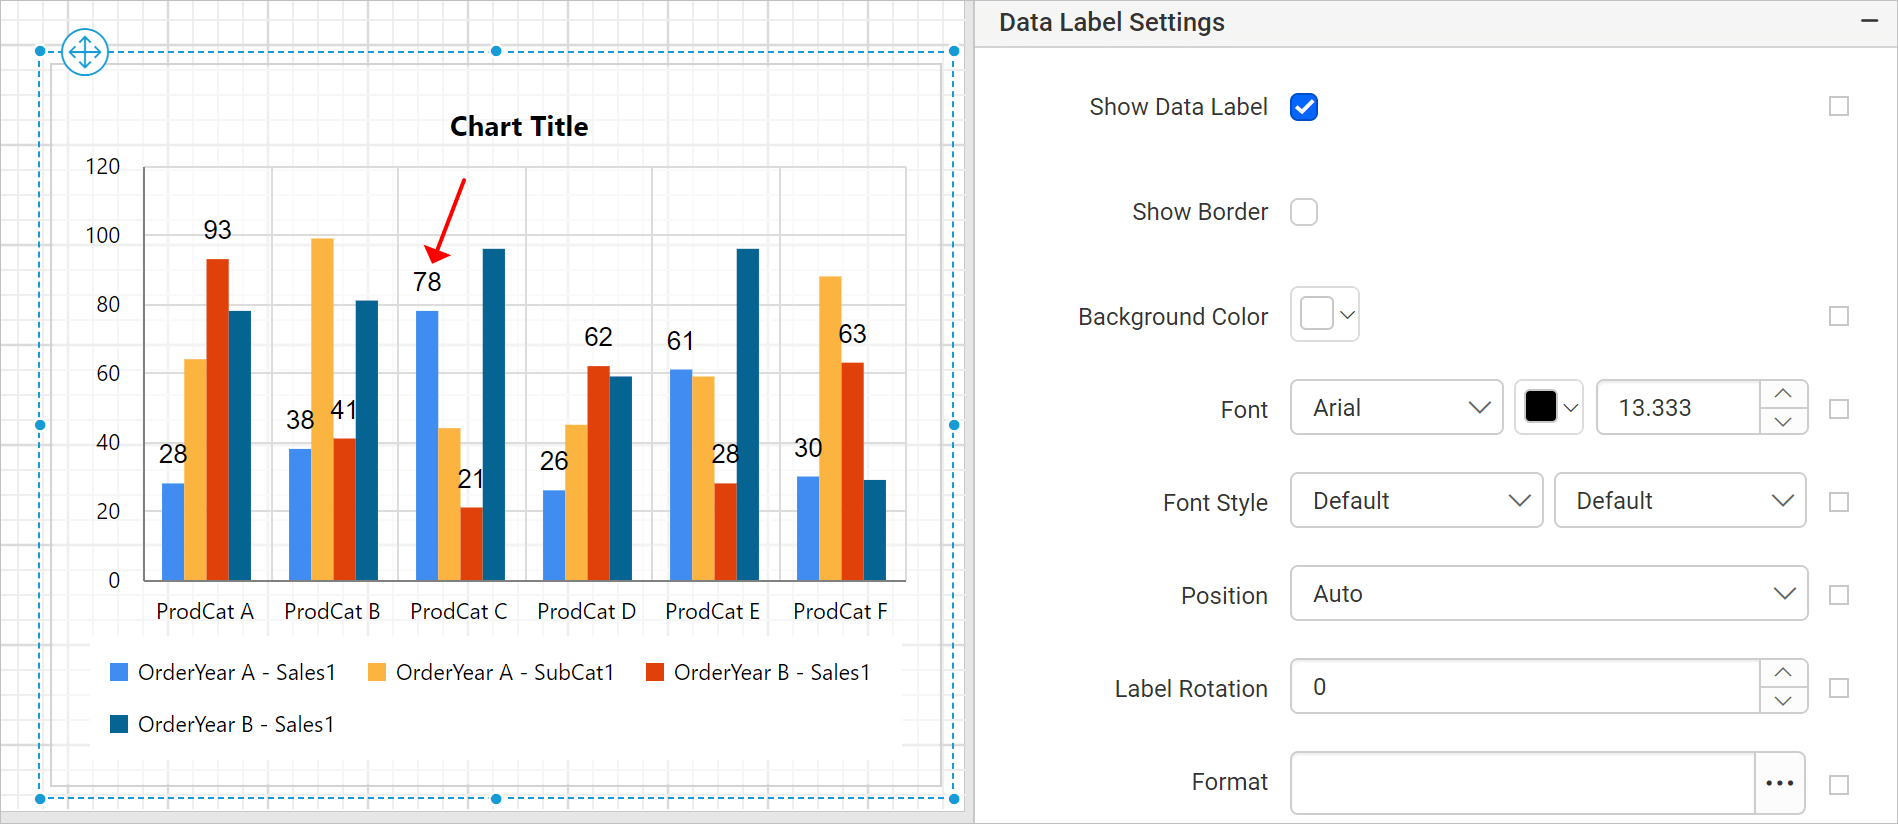
If you enable the Show Data Label checkbox, the label will displayed in the respective series of chart. In the Choose Series drop-down Sales1 series is selected, so the data label is enabled for that specific series in the chart design.
You can also enable or disable the data label based on dynamic values, by using the Expressions. Refer Set Expression and Reset Expression section to open set/reset expression menu in properties panel.
Show border
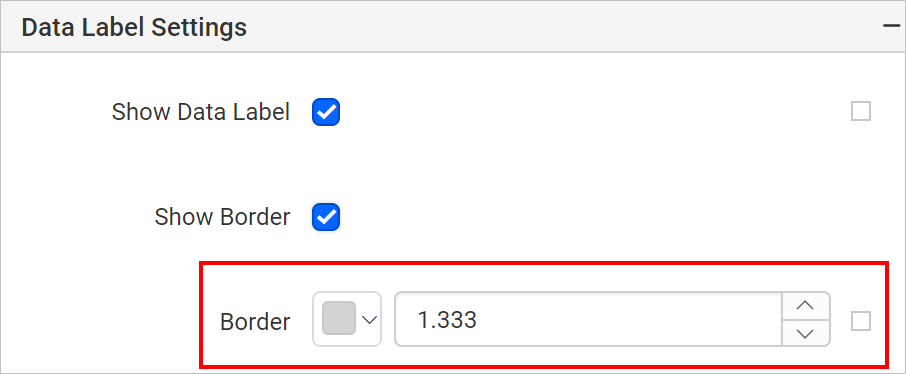
Show border property can be used to set border for data labels in the chart. To enable data label border, toggle the Show Border checkbox.
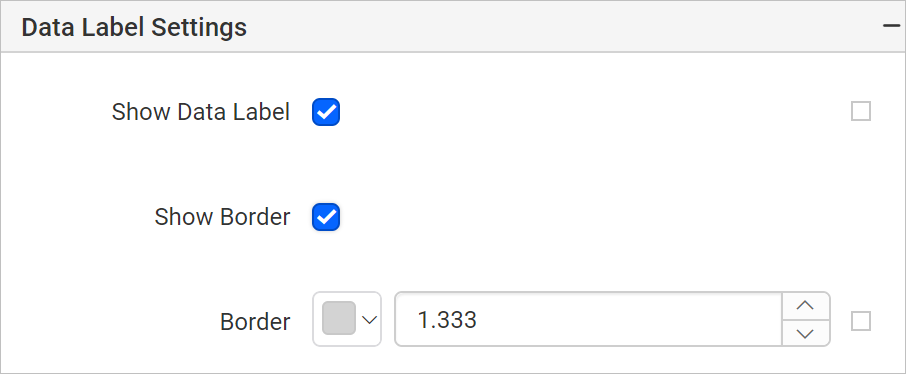
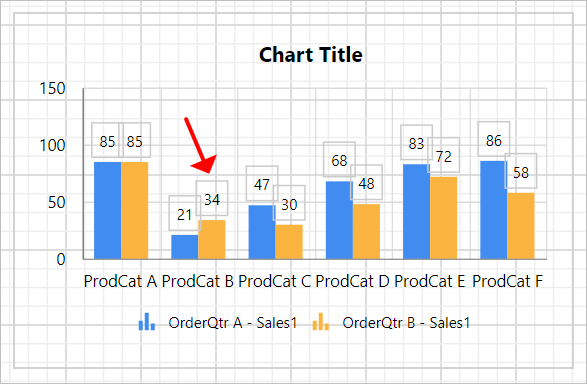
Now, default border will be enabled to the data label.
Also, set of border properties will get enabled in the properties list.
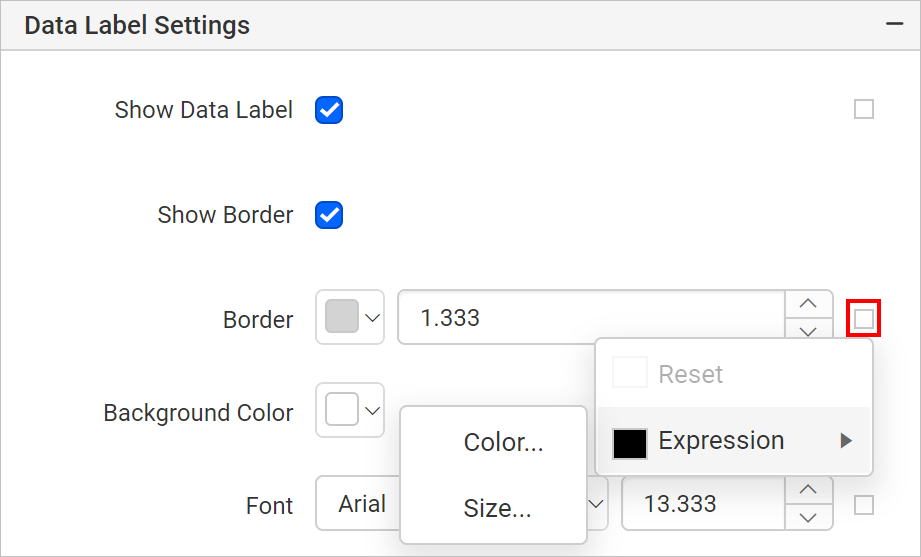
Using the border color and width property, you can customize the border for the data label. You can also set border properties based on dynamic values, by using the Expressions. Refer Set Expression and Reset Expression section to open set/reset expression menu in properties panel.
Background color
Background color property can be used to set the background color for the data label.
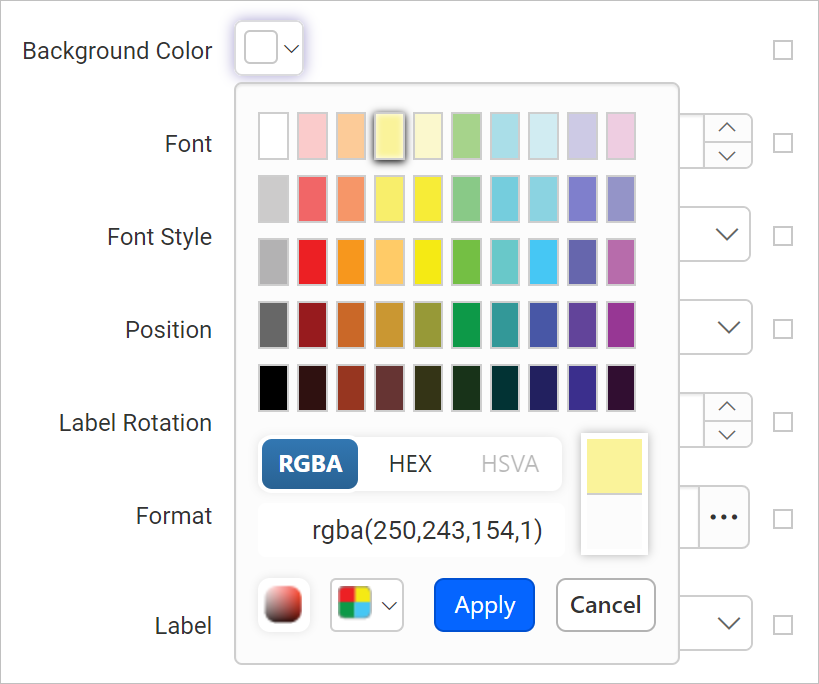
Now, the background color property will be applied to the data label.
You can also apply background color based on dynamic values, by using the Expressions. Refer Set Expressions and Reset Expressions section to open set/reset expression menu in properties panel.
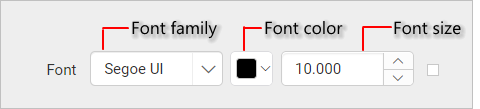
Font
The font family, font size, and font color properties can be used to customize the labels.
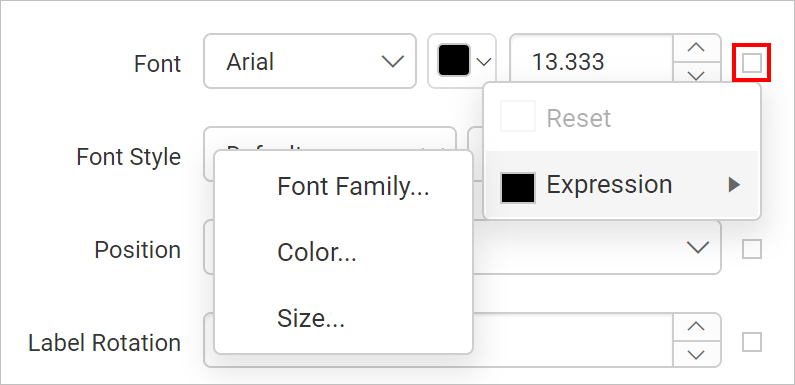
You can also apply font properties based on dynamic values, by using the Expressions. Refer Set Expressions and Reset Expressions section to open set/reset expression menu in properties panel.
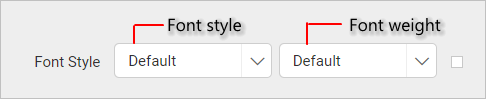
Font Style and Weight
The font style and weight properties can be used to set the style and weight for the legend text.
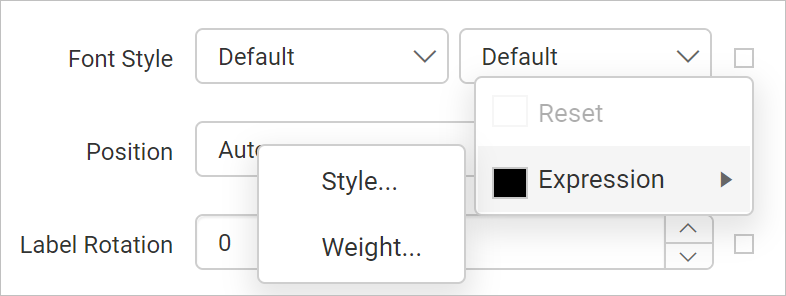
You can also apply font style and weight properties based on dynamic values, by using the Expressions. Refer Set Expressions and Reset Expressions section to open set/reset expression menu in properties panel.
Position
You can position the label to the top, center or bottom position of the segment by using the Position property for the chart types such as column, bar, stacked bar, stacked column, 100% stacked bar and 100% stacked column.
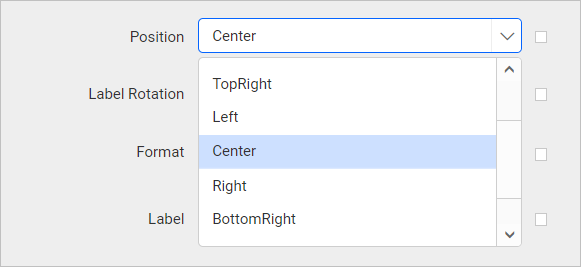
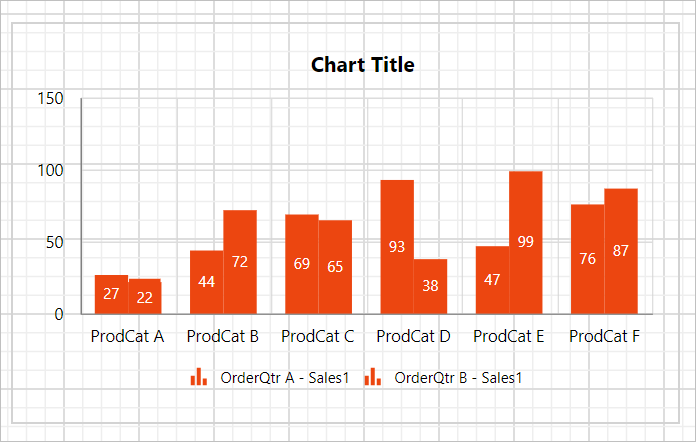
Now, the data labels will be center positioned in the chart series.
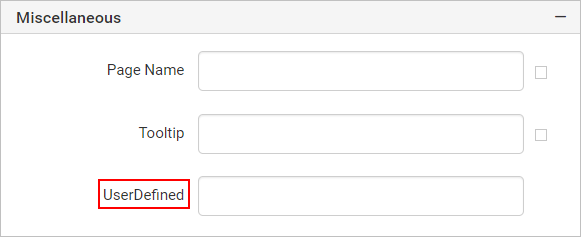
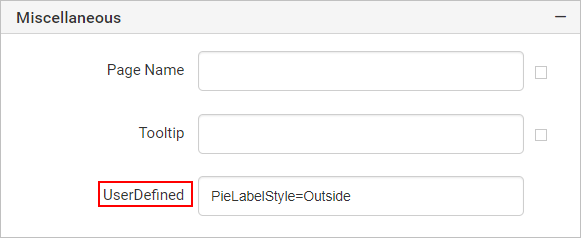
The label can be positioned inside or outside the perimeter of the series by using the label position option for the chart types such as Pie, Doughnut, Pyramid and Funnel. You can use the CustomAttributes property in the chart report item, to position the label for Pie, Doughnut, Pyramid and Funnel chart types,
For Pie and Doughnut chart,
| Position | Value |
|---|---|
| Outside | PieLabelStyle=Outside |
| Inside | PieLabelStyle=Inside |
For Pyramid and Funnel Chart,
| Position | Value |
|---|---|
| Outside | PyramidLabelStyle=Outside |
| Inside | PyramidLabelStyle=Inside |
You can also set position property based on dynamic values, by using the Expressions. Refer Set Expression and Reset Expression section to open set/reset expression menu in properties panel.
Label Rotation
Labels can be rotated by using the Lable Rotation property.
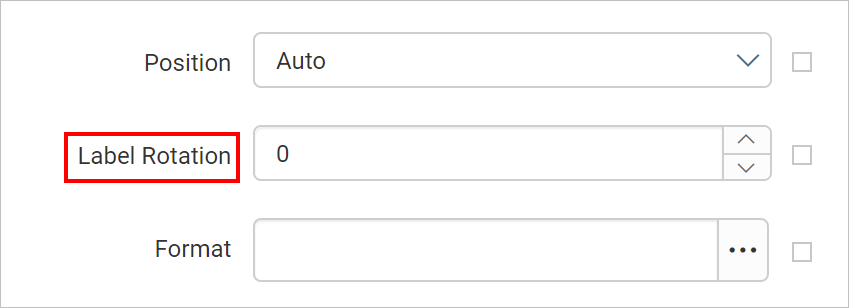
Increase or decrease the value in the Label Rotation property field to set the rotation angle for the data label.
You can also set label rotation property based on dynamic values, by using the Expressions. Refer Set Expression and Reset Expression section to open set/reset expression menu in properties panel.
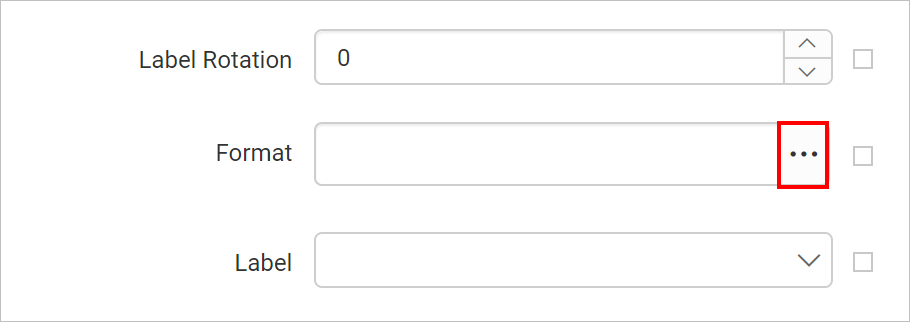
Format
Format property is used format data label values. To open the format dialog click on the icon highlighted in the below snap or you can type the format directly in the textbox.
To apply Number, Currency, Date, Time, Scientific, Percentage or Custom formats using format dialog follow the steps provided in Format section.
You can also set format property based on dynamic values, by using the Expressions. Refer Set Expression and Reset Expression section to open set/reset expression menu in properties panel.
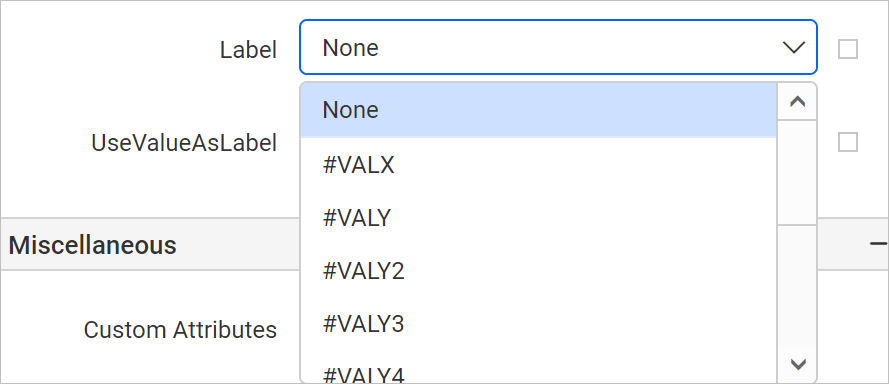
Label
You can use case-sensitive, chart-specific keywords to represent an item that exists in the chart. The following is a list of chart keywords.
These keywords are listed in the Label property drop-down,
| Chart Keyword | Description |
|---|---|
| #VALX | X value of the data point. |
| #VALY | Y value of the data point. |
| #VALY2 | Y value #2 of data point. |
| #VALY3 | Y value #3 of data point. |
| #VALY4 | Y value #4 of data point. |
| #VALY5 | Y value #5 of data point. |
| #VALY6 | Y value #6 of data point. |
| #AXISLABEL | Axis data point label. |
| #INDEX | Data point index. |
| #PERCENT | Percentage of the data point Y value. |
| #TOTAL | Total of all Y values in the series. |
For example, if you want to show the values in the data labels as percentages, you can use choose a keyword #PERCENT in the drop-down.
You can also set label property based on dynamic values, by using the Expressions. Refer Set Expression and Reset Expression section to open set/reset expression menu in properties panel.> If Use Value as Label checkbox is enabled, Label property will have no effect in the data label.
Use Value as Label
Toggle this checkbox to display actual values of series in the data label on report preview.
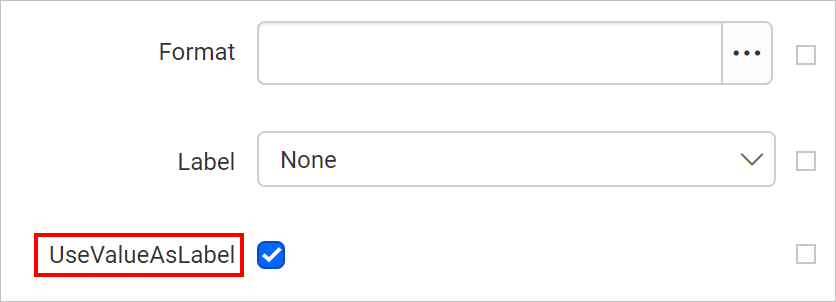
If this checkbox is enabled,
Labelproperty will have no effect in the data label.
You can enable or disable this property based on dynamic values, by using the Expressions. Refer Set Expression and Reset Expression section to open set/reset expression menu in properties panel.