Connect to AWS Open Search
The Bold Reports® allows you to connect with AWS Open Search in reports.
How to create AWS Open Search
To configure the AWS Open Search, follow these steps:
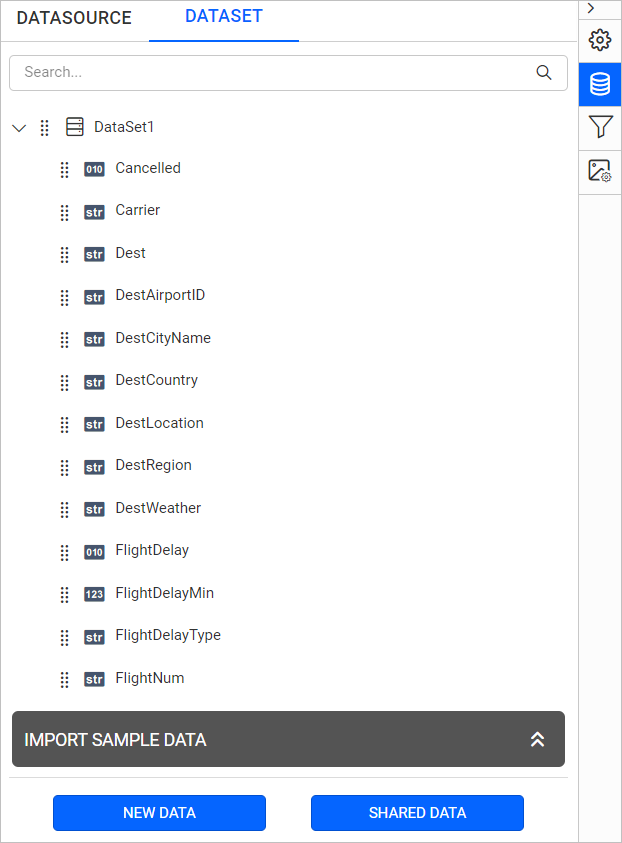
- Click on the Data icon in the configuration panel.
- In the
DATAconfiguration panel, click on theNEW DATAbutton.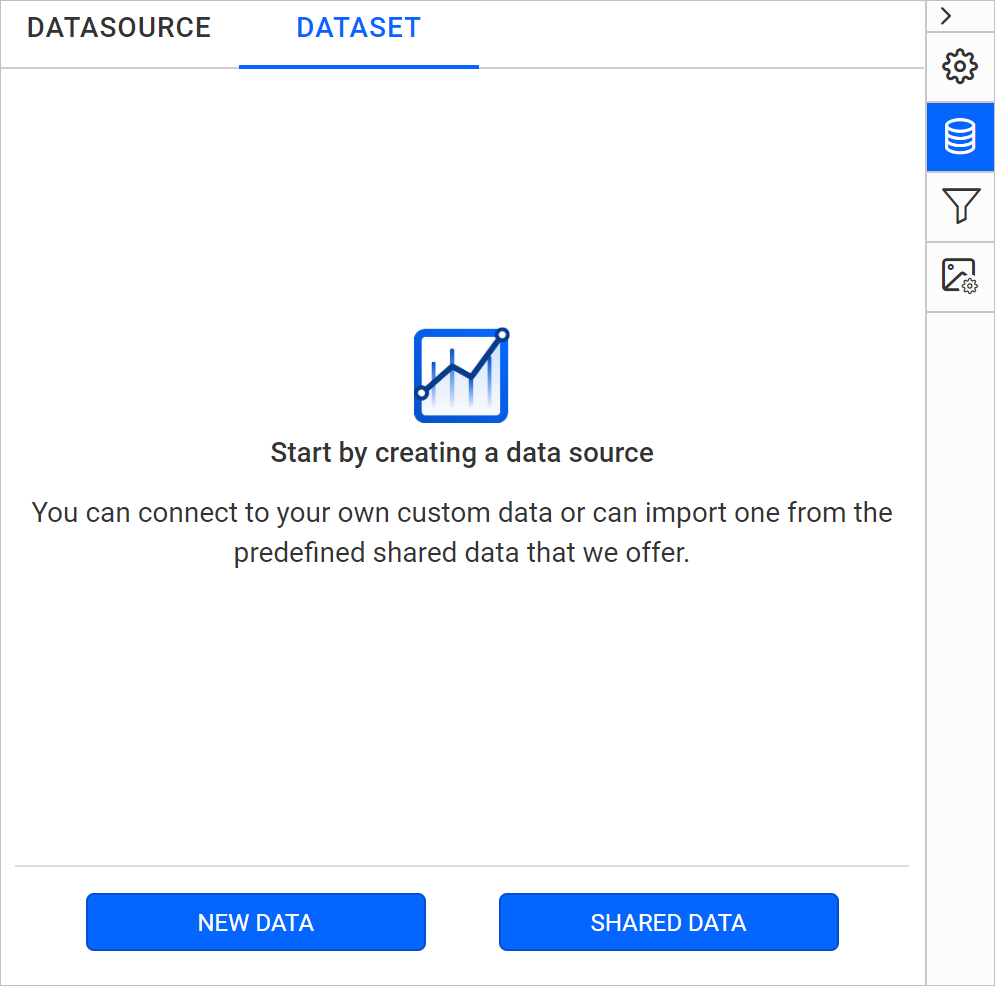
- In the connection type panel, choose the
Elastic Searchdata source type.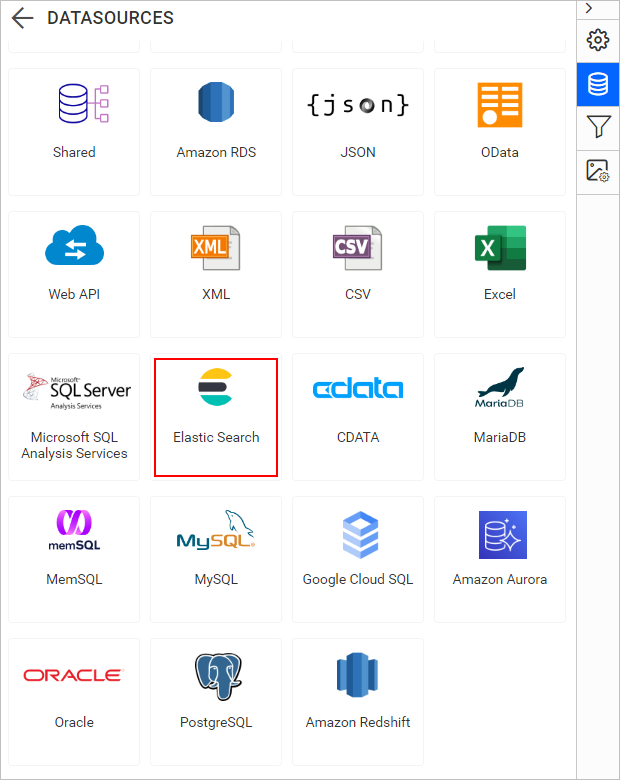
Create AWS Open Search with basic options
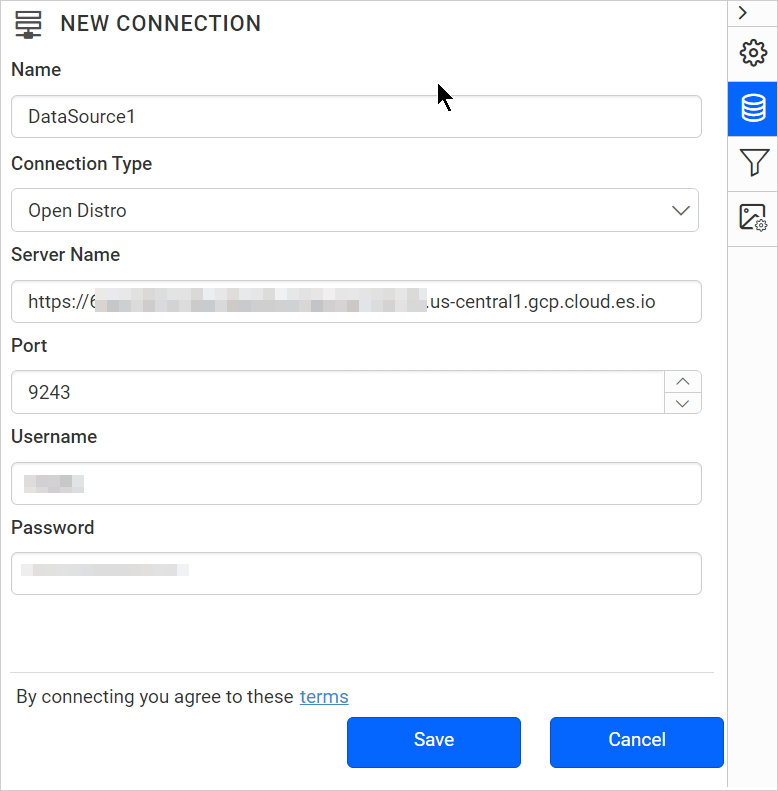
When you create a new data, the NEW DATASOURCE panel will show up with basic options.
- Specify the data source name without special characters in the Name field.
- There are two Connection types available in the Elastic Search connector:
- Elasticsearch SQL
- Open Distro
- To connect to an Amazon Web Service hosted Open Search instance, please use connection type as Open Distro.
- Enter a valid Open Search server or host name in the Server Name field.
- Enter the Port in which the server is running in the port text box.
- Enter a valid username in the Username text box.
- Enter a valid password in the Password text box.
After connecting the data source, the data design view page will be opened. On this page, the list of schemas and tables from the AWS Open Search server will be shown in a treeview section.
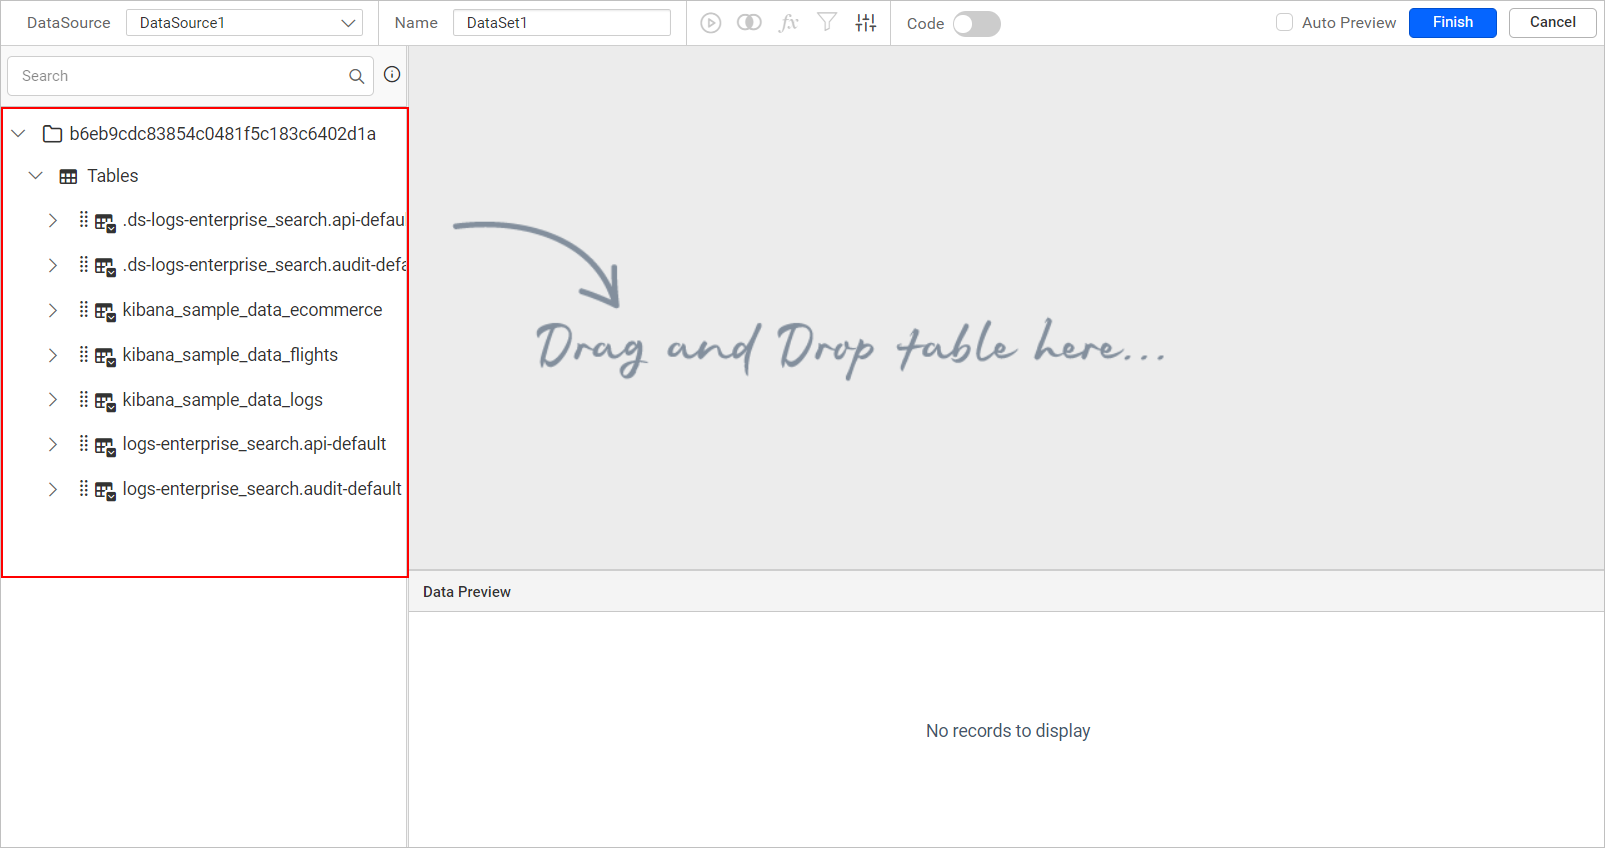
Now, you can drag and drop the required table from the tree view list.
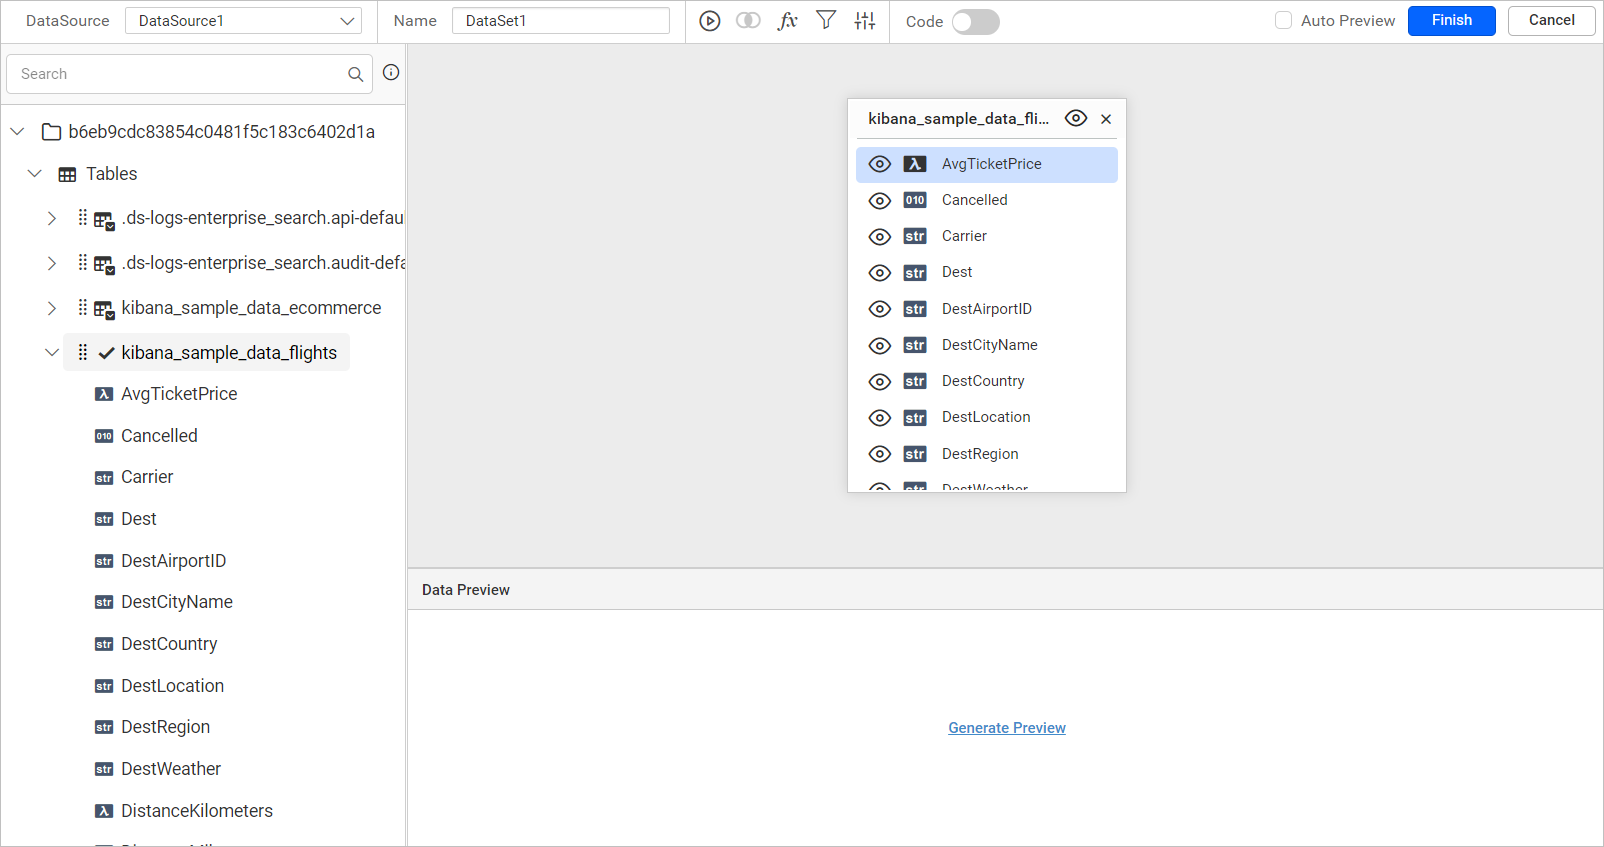
Multiple joins are not supported for the AWS Open Search data source in Bold Reports®.
Click Finish to save the data source with a relevant name to proceed with designing report.
Connecting through custom query
You can connect to data source of certain data connections through the custom query. This feature allows you to define the data source with manually written queries instead of manually dragged tables for data connection type such as Elasticsearch SQL and Open Distro connections.
After connect action, you will get into the query design view.
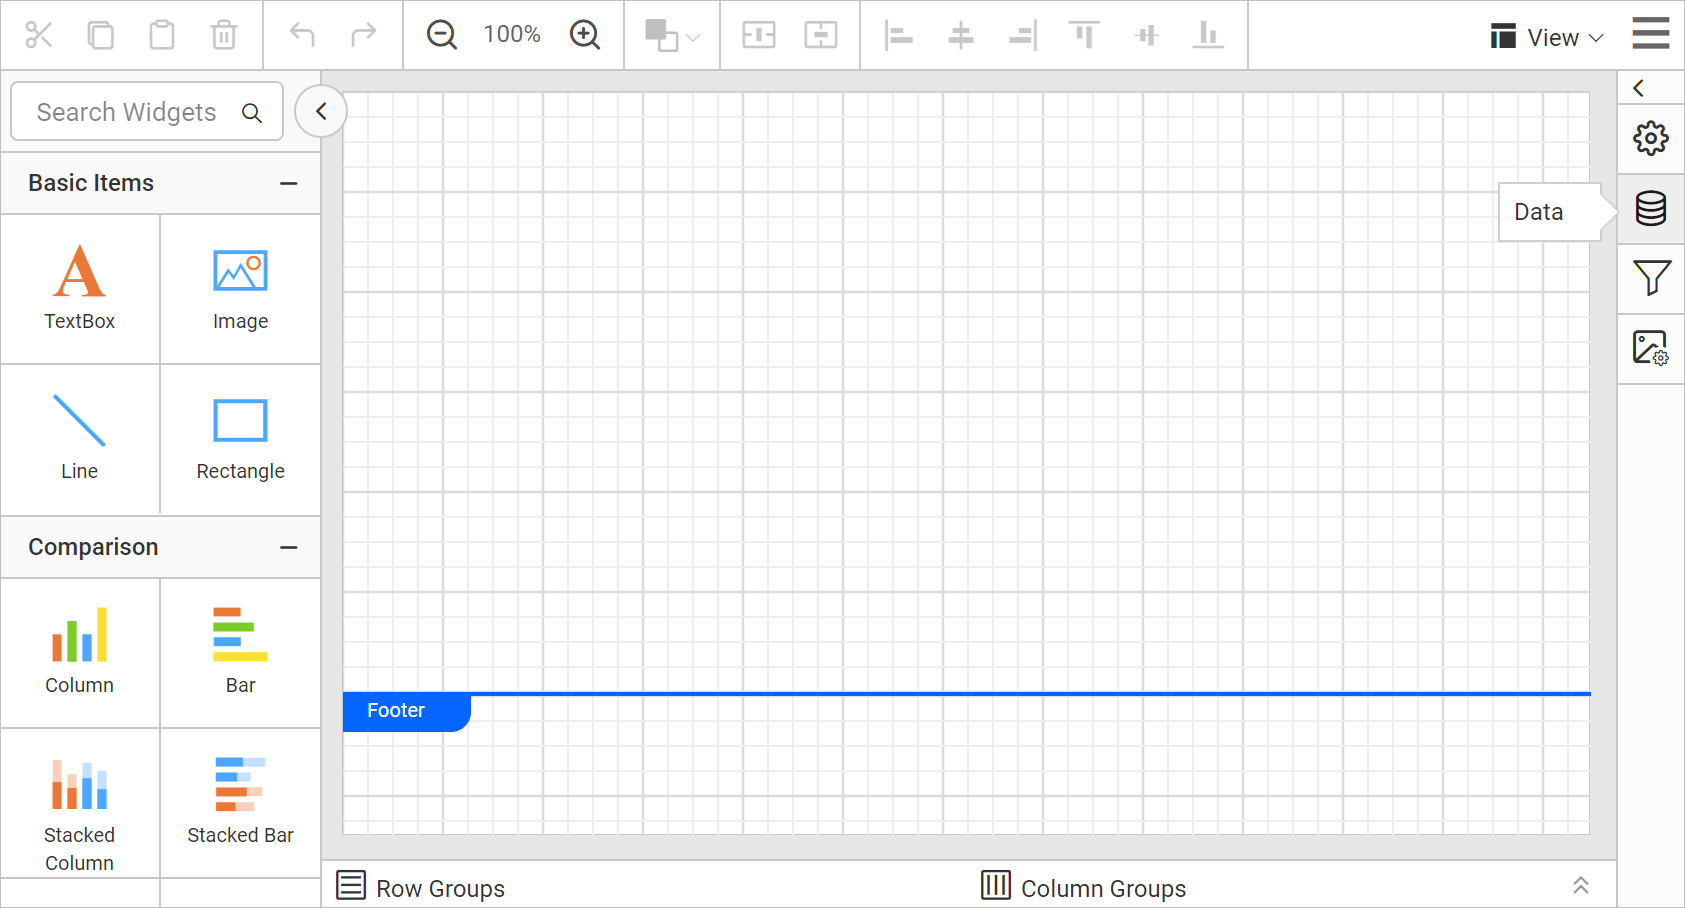
Switch to code view
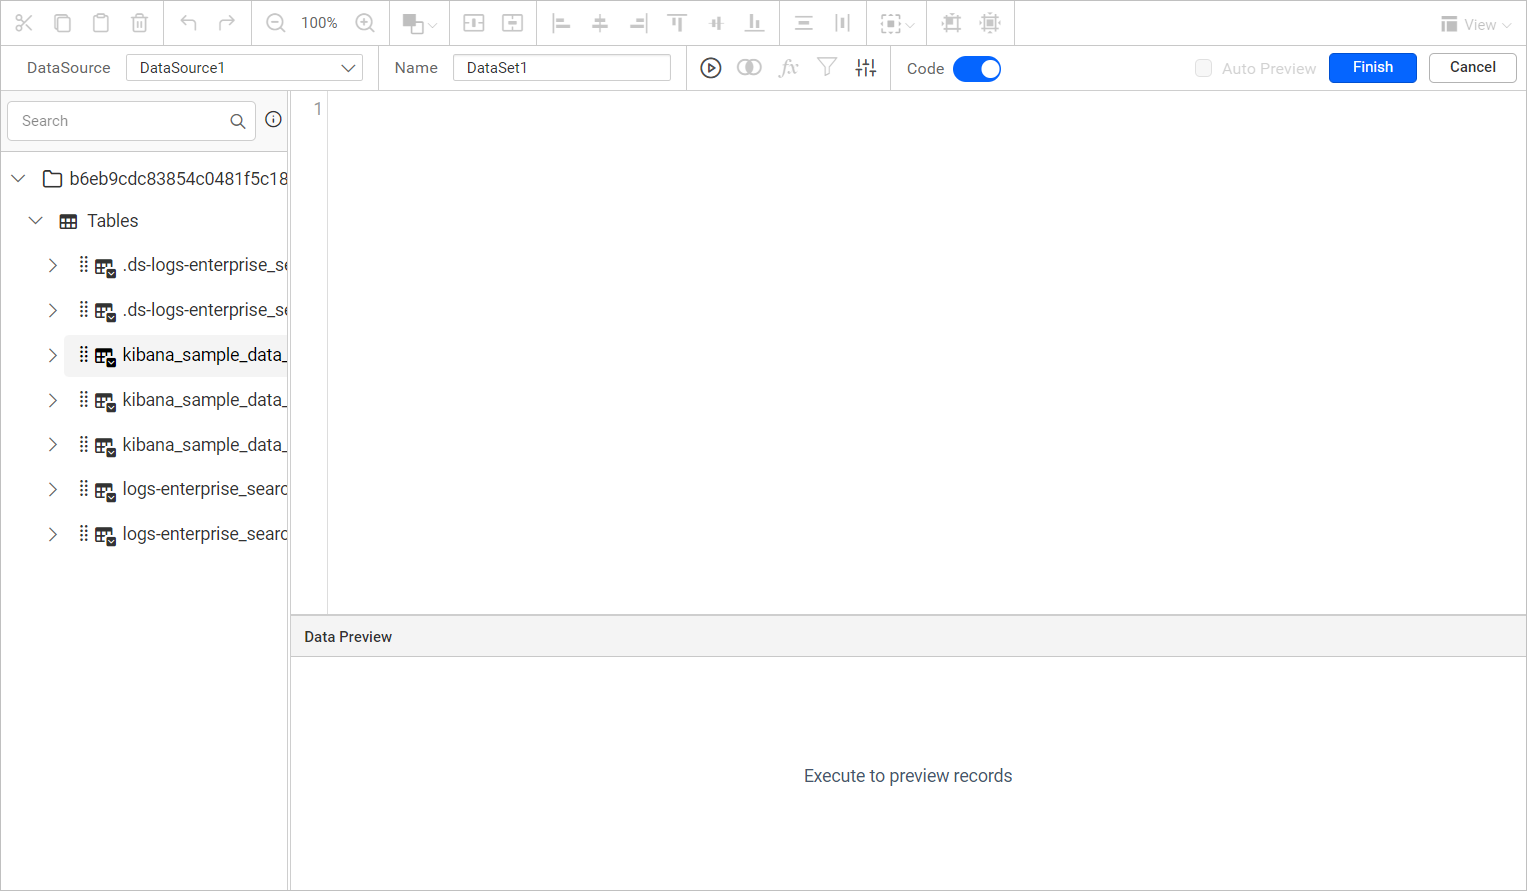
By default, the query design view opens with design view. Switch to the code view by enabling the slider option in the tools pane in query design view as shown (highlighted) in the following image.

This will switch the query editor pane as like below,
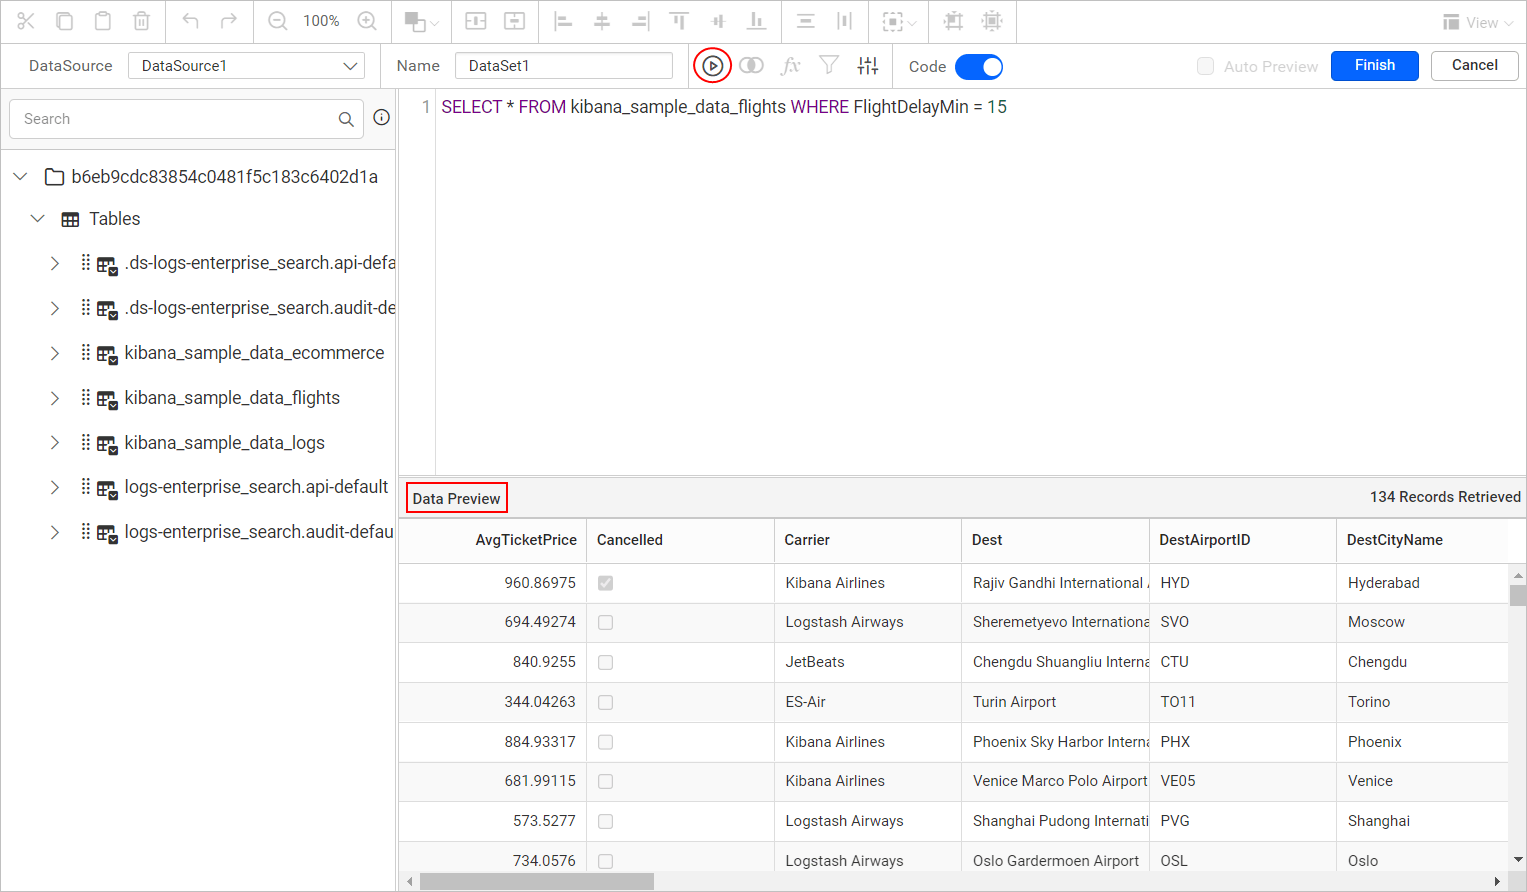
Write query and execute
In the Query Editor pane, you can write your own query which helps you to access table schema information and perform all the operations with respect to retrieving data from your database.
After writing your query, click the Execute option in the tools pane. You can also view the data for your query in bottom of the Query Editor.
If you tried to switch back design view by disabling the Code Slider in tools pane, you will be prompted with an alert message to remove your query for confirmation as proceeding with this action, will reset the code view query.
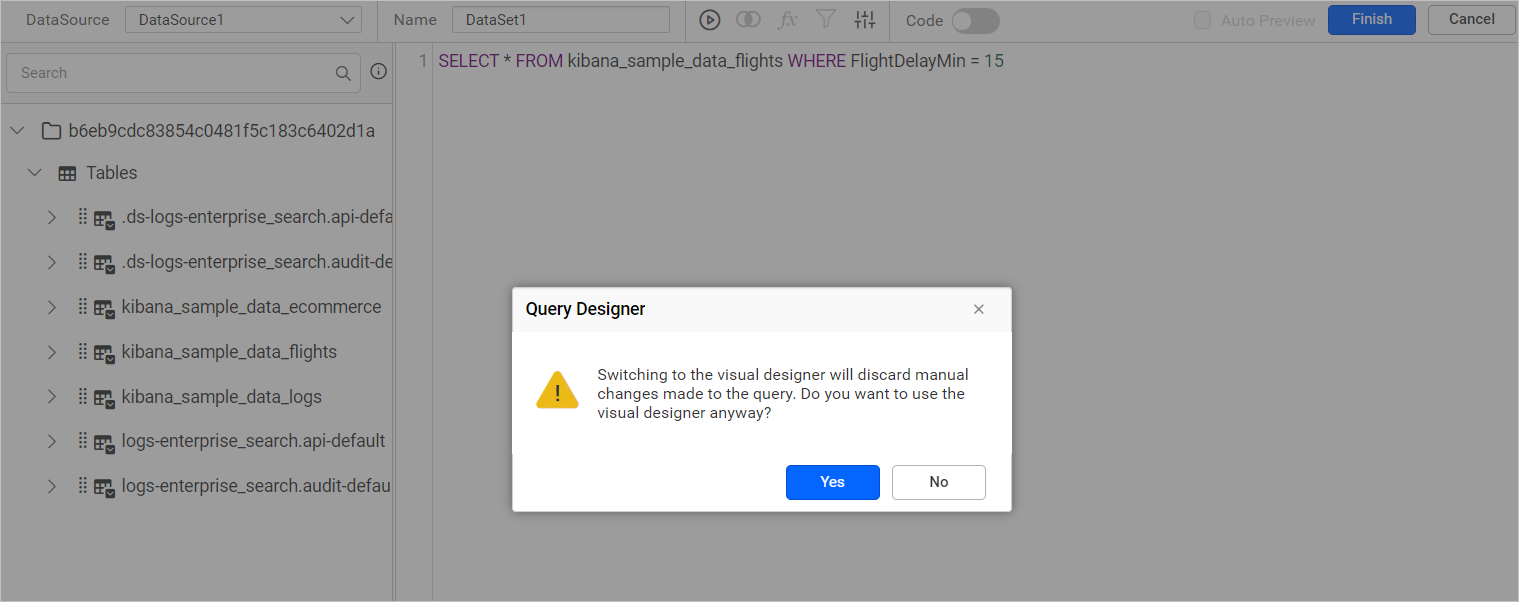
Clicking Yes will discard the query and take you to design view, otherwise click No. Save the data source by clicking the Finish button.
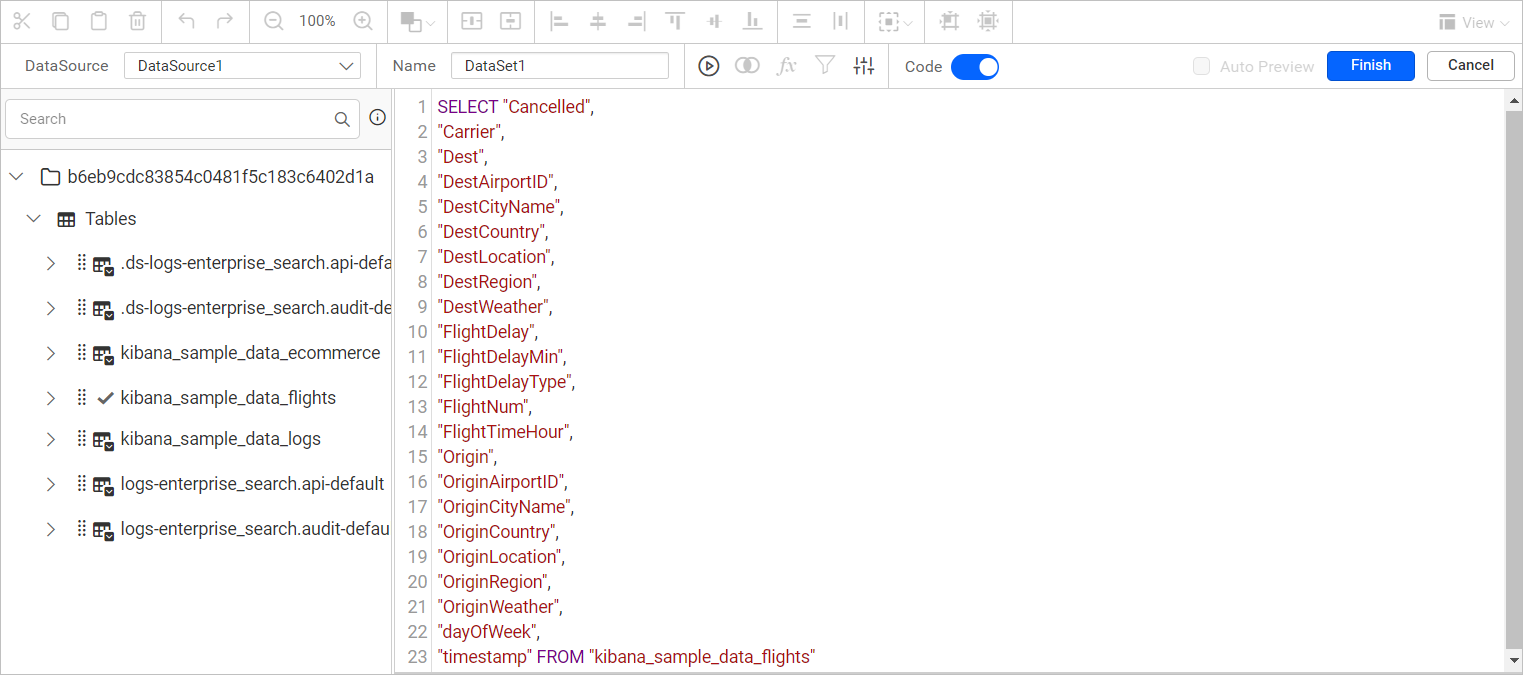
Code view for tables in design view
You can view the query in Query Editor pane for already created a data source in design view.
For example, I have dragged the kibana_sample_data_flights table in design view.
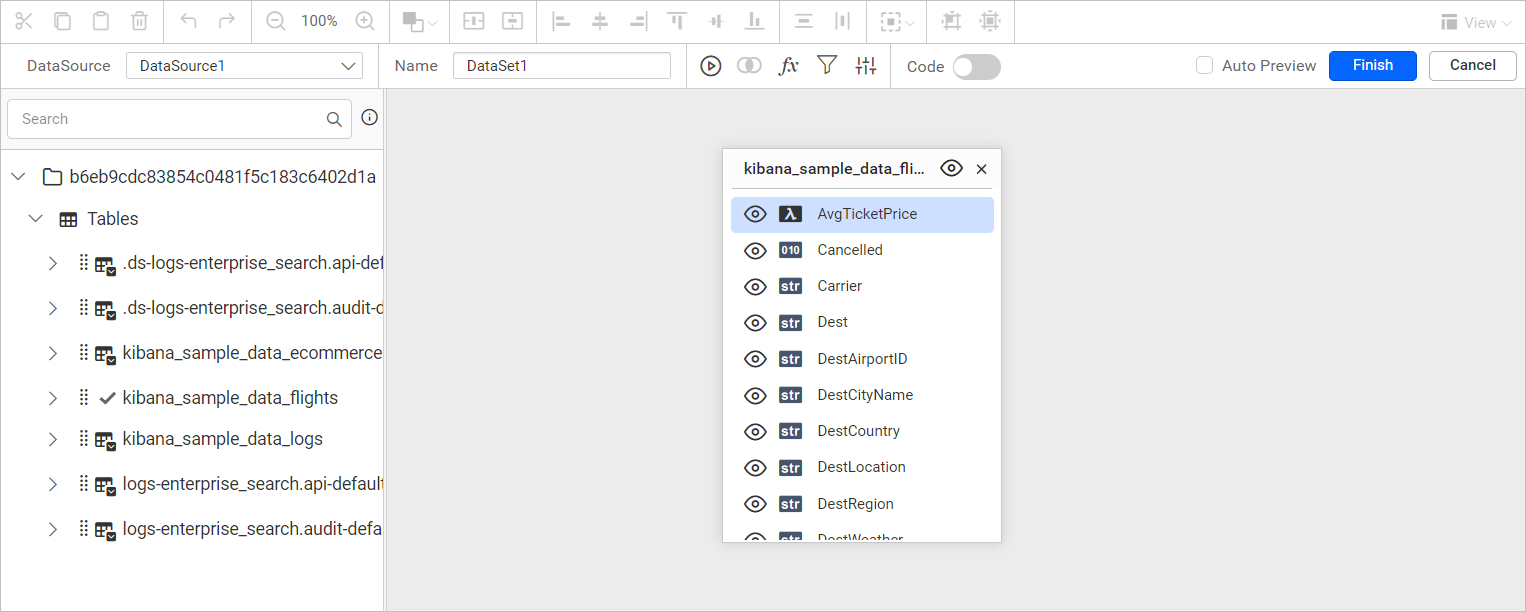
Then, I tried to enable the Code Switcher to view the query, this query shows whatever changes that made in the table.