Design an SSRS RDL report using shapes in Bold Reports®
You can design the Manufacturing Workflow for Tablet PC report as a flowchart by using shape report items in the Bold Reports® Web Report Designer. Follow the steps in each section below.
How do I add text to a shape?
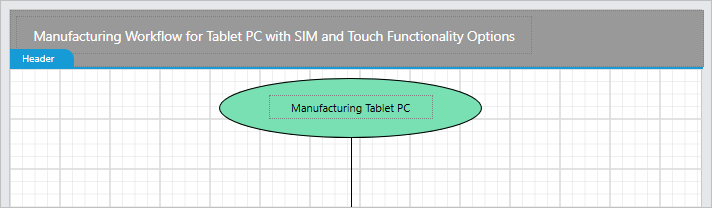
You add text to a shape in the Bold Reports® Web Report Designer by placing a textbox on top of the shape report item. Follow these steps:
-
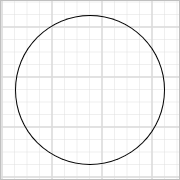
Drag and drop a shape report item from the item panel to the design area.
-
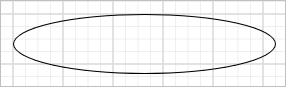
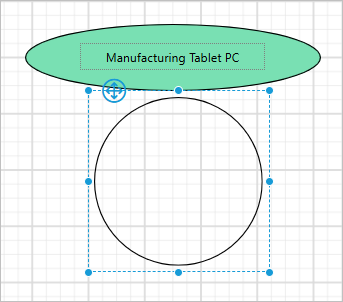
A circle shape appears initially. Adjust the size of the circle to form an ellipse.
 .
-
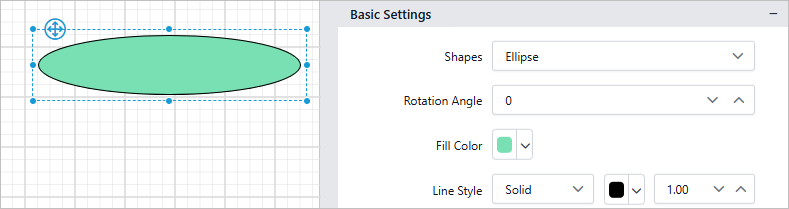
Configure the required properties for the shape report item.
 .
-
Drag and drop the textbox report item from the design panel onto the top of the shape report item.
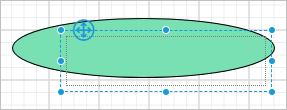
Note: Shape report items are not container elements, meaning they do not contain or nest any other items. Each shape and textbox are considered a separate element in the report design.
-
Resize the textbox as needed, configure the necessary properties, and insert text into the textbox.
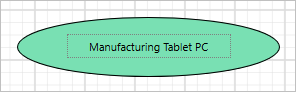
How do I add an arrow shape to connect shapes?
You connect shapes in the Bold Reports® Web Report Designer with a shape report item set to an arrow type. Follow these steps:
- From the item panel, drag and drop a shape report item below the previous shape.
- Change the shape type to
Down Arrow.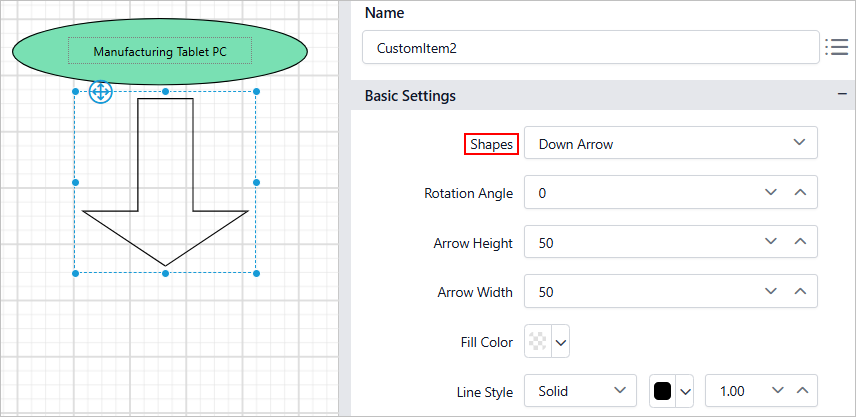 .
- Adjust the shape report item size as needed, and configure the required properties to modify the arrow shape.
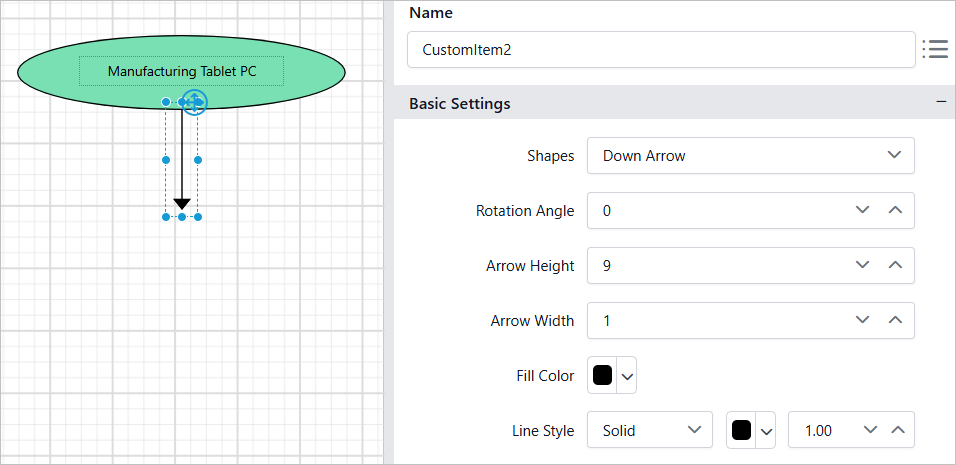 .
How do I add a rectangle shape for decision points?
You add a decision point in the Bold Reports® Web Report Designer with a shape report item set to the Rectangle type. Follow these steps:
- From the item panel, drag and drop a shape report item below the arrow shape.
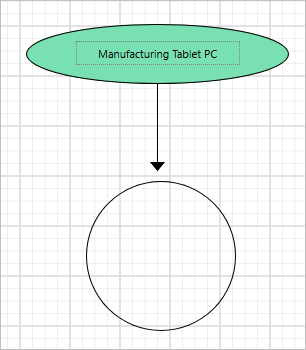
- Change the shape type to
Rectangle.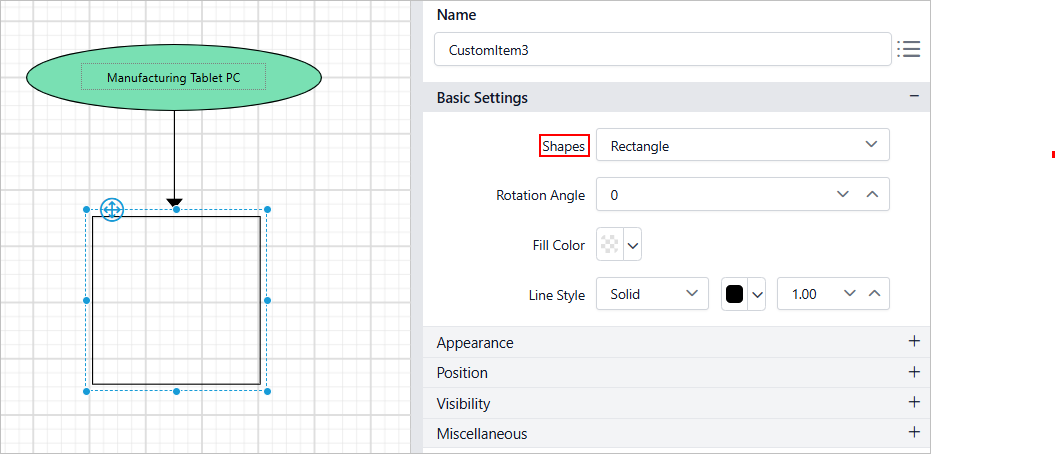 .
- Adjust the size of the shape report item as needed and configure the necessary properties.
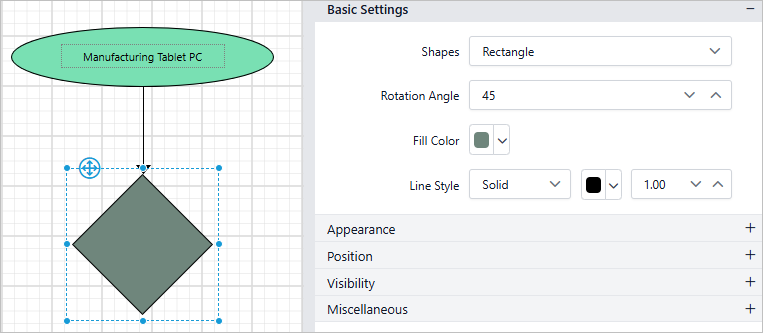 .
- Drag and drop the textbox report item from the design panel into the shape report item. Resize the textbox as needed.
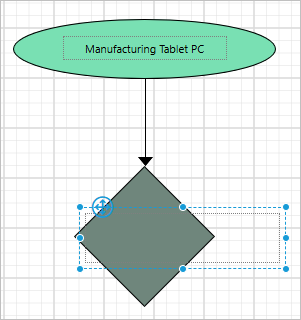
- Configure the necessary properties in the textbox, and add the text in the textbox.
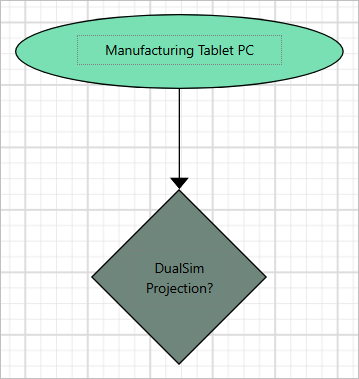
How do I add a curved arrow shape between shapes?
You build a curved connection in the Bold Reports® Web Report Designer by combining a line report item with an arrow shape. Follow these steps:
- From the item panel, drag and drop a line report item below the previous shape.
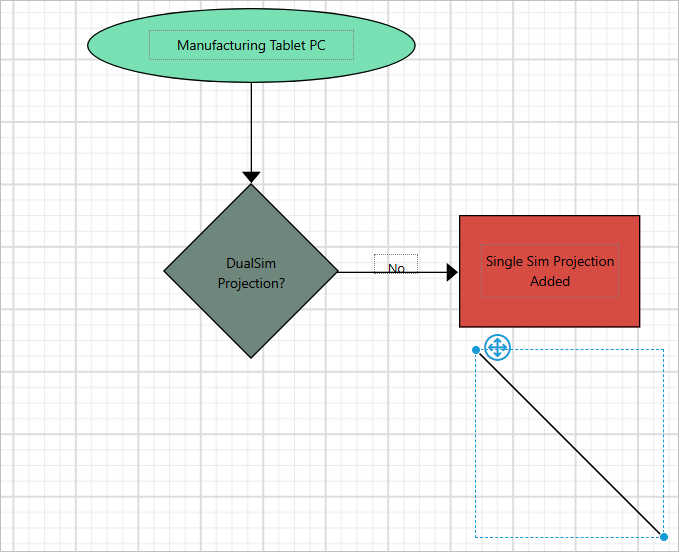
- To display a straight line, set the line report item’s width to 0.
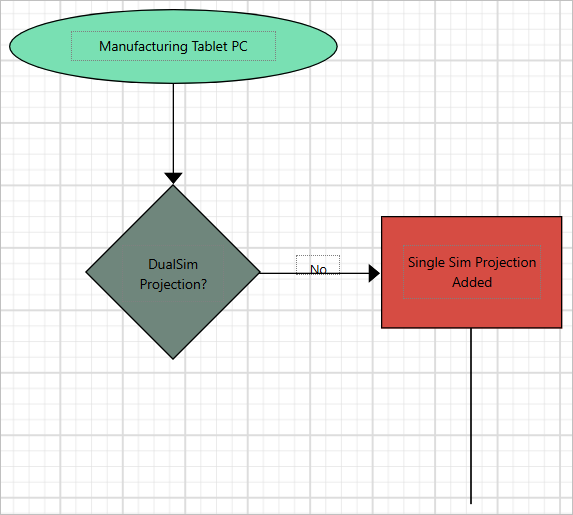
- Drag and drop the shape report item near the line report item.
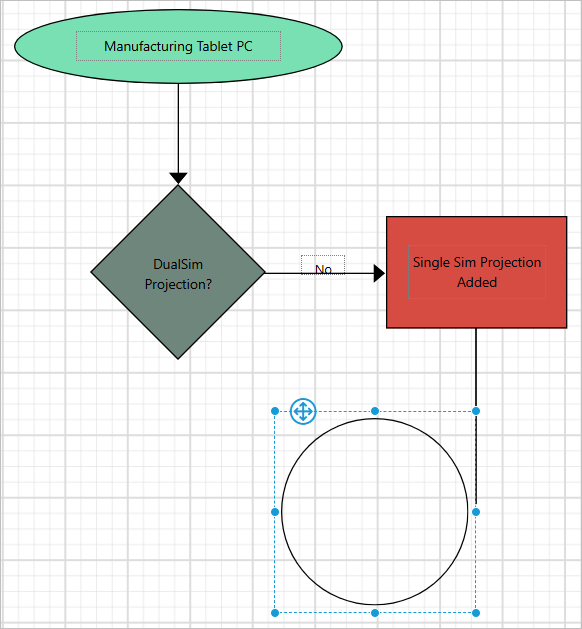
- Change the shape type to
Left Arrow.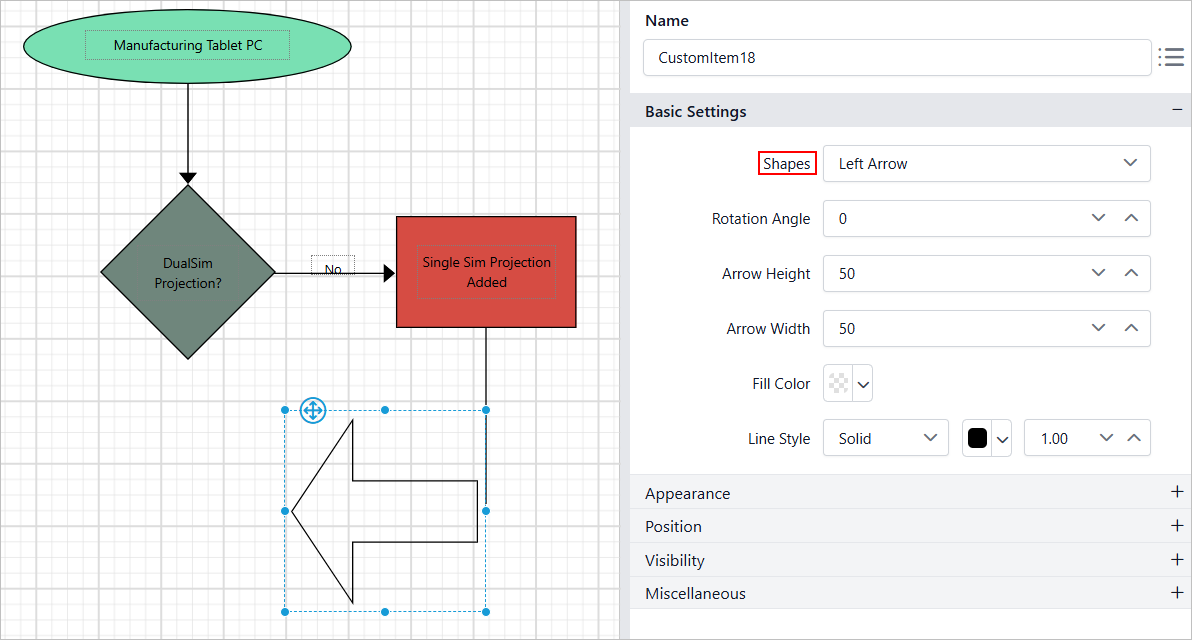
- Adjust the shape report item size as needed, and configure the required properties to modify the arrow shape.
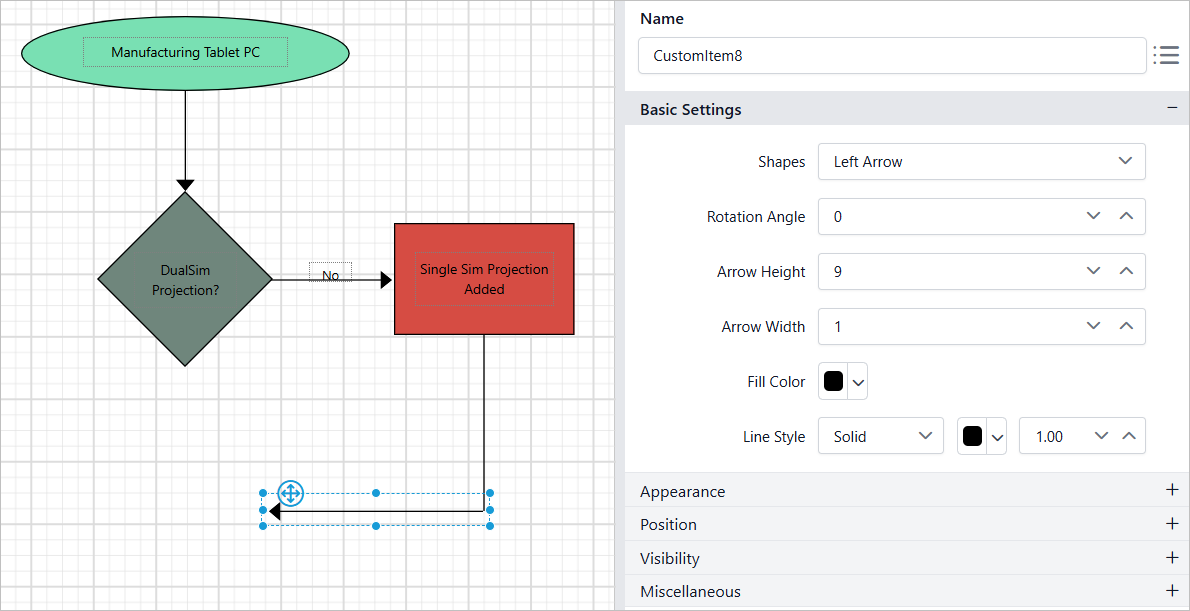 .
How do I add a report header?
You add a report title in the Bold Reports® Web Report Designer by enabling the report header. Follow these steps:
- Enable the report
Headerto add a title to the report.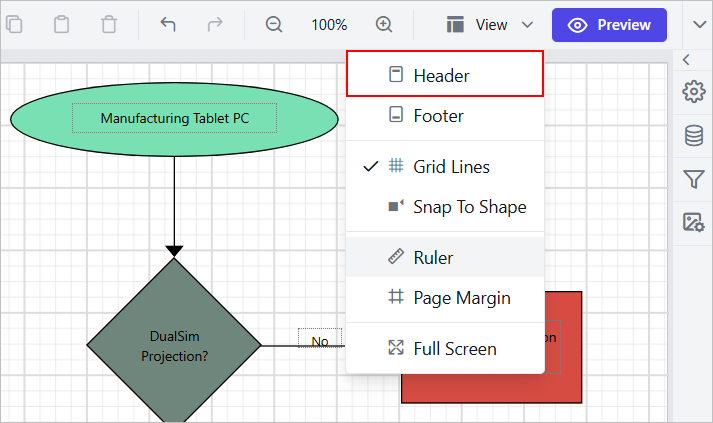
See Show or hide header and footer to add or remove the header or footer in the report.
- Add a rectangle report item in the report header area and a textbox within the rectangle.
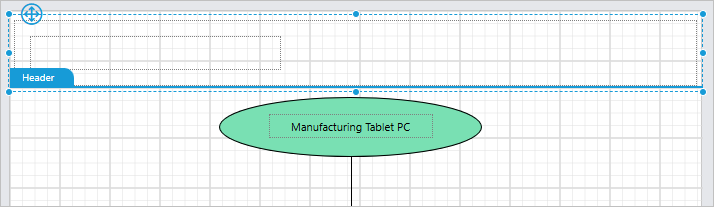
- Set the report title text in the textbox. Customize the appearance of the title using the textbox and rectangle properties in the properties panel as required.
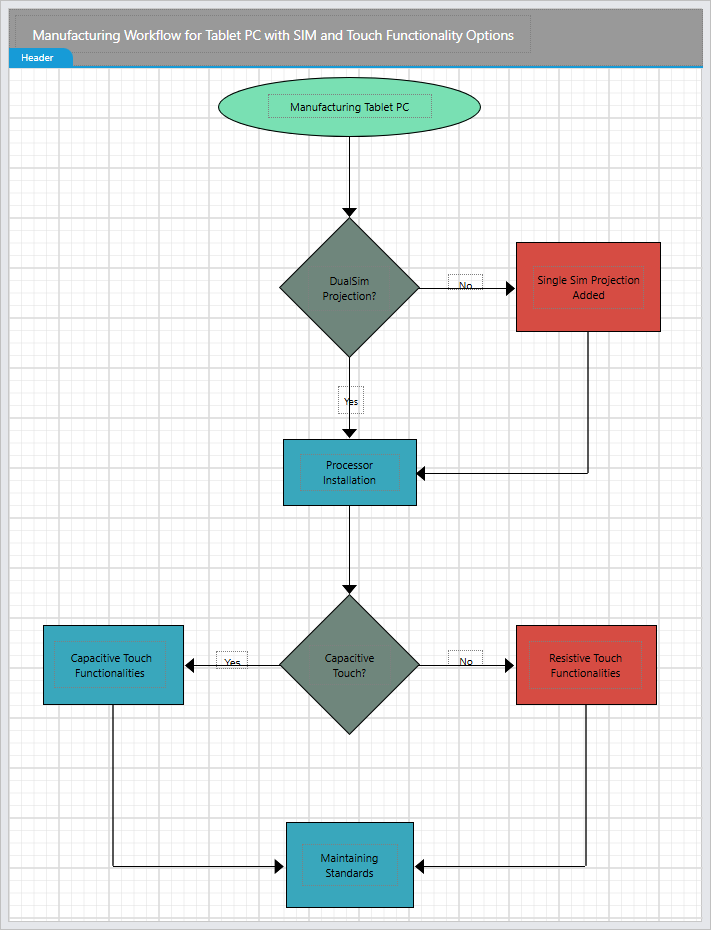
Final design
The final design of the Manufacturing Workflow for Tablet PC with SIM and Touch Functionality Options report in the Bold Reports® Web Report Designer looks like the following image.
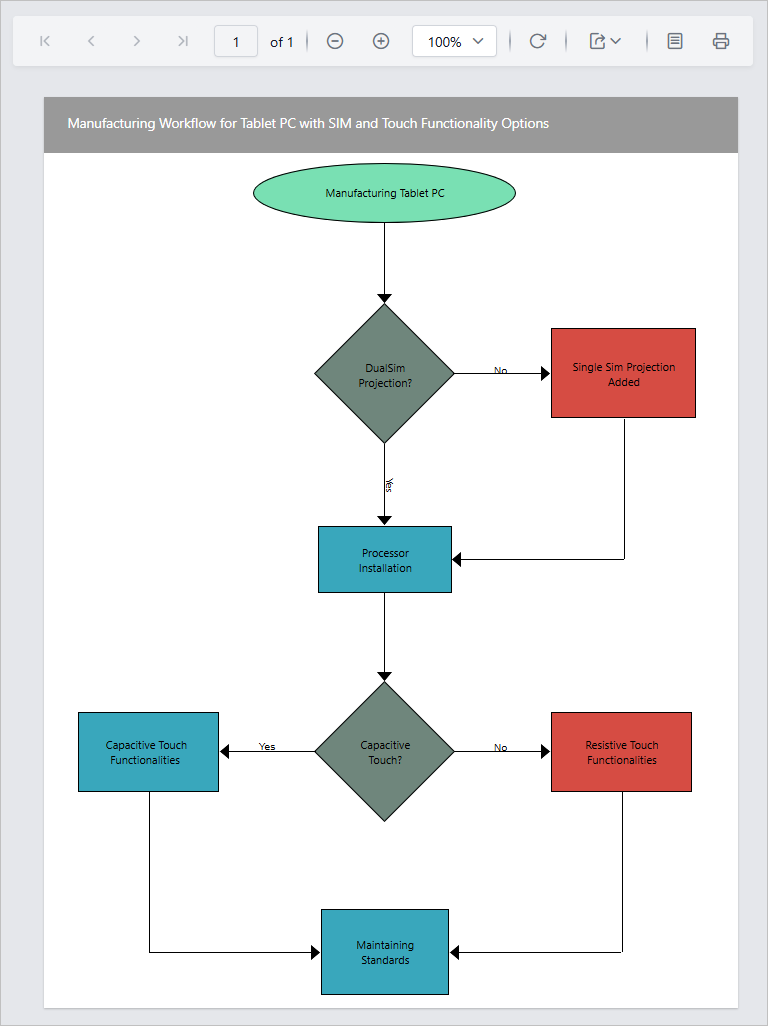
Report preview
During the report preview in Bold Reports®, the Manufacturing Workflow for Tablet PC with SIM and Touch Functionality Options report is displayed as shown in the following image.
Download the Manufacturing Workflow for Tablet PC report design (RDL)
Frequently asked questions
Can a shape report item contain a textbox?
No. Shape report items are not container elements. Each shape and textbox is a separate element in the report design.
How do I display a straight line next to an arrow shape?
Set the line report item’s width to 0 to display a straight line.