Custom distribution for map shapes in Bold Reports®
In the Bold Reports® Web Report Designer, the custom distribution type lets you set your own number of data ranges to decide the distribution of values for map shapes.
How do I set a custom distribution for map shapes?
You set a custom distribution for map shapes in the Bold Reports® Web Report Designer from the shape color rule category.
-
Select the data value. The properties required to configure the distribution type appear under the shape color rule category.

-
Choose
Customin theDistribution Typedropdown. -
Click the edit icon of the Buckets option that appears.

-
Use the Map Bucket panel that opens to define your ranges.
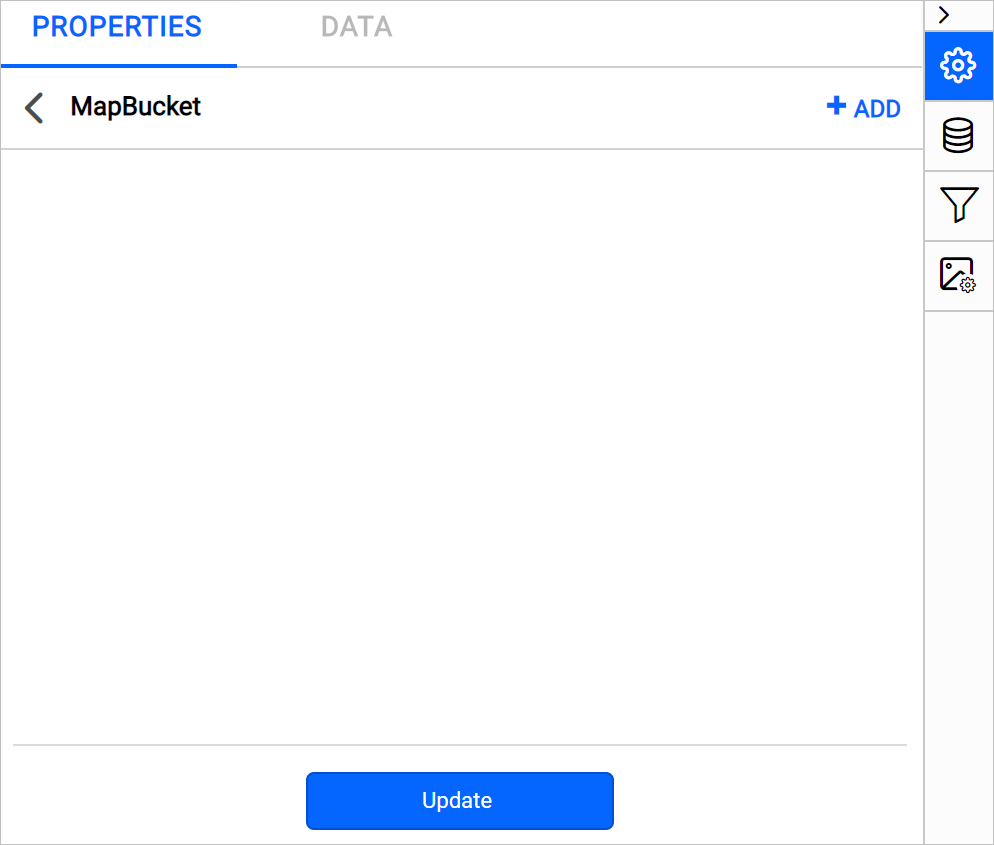
Buckets
To define the data ranges explicitly in the Bold Reports® Buckets property, see the Custom Buckets section.
Legend text
The Legend text property sets the format of the content in a Bold Reports® map legend. To format the legend content, use map legend keywords and custom formats.

| Format | Description |
|---|---|
| #FROMVALUE{N0}-#TOVALUE{N0} | Showcases the real numeric values of the start of the range and end of the range. |
| #FROMVALUE {C2} | Showcases the values in currency format with two decimal places. |
| #TOVALUE | Showcases the actual value of the data field. |
| #FROMVALUE {C0} | Showcases the values in currency format without decimal places. |
You can also apply legend text based on dynamic values by using Expressions. To open the set or reset expression menu in the properties panel, see the Set Expressions and Reset Expressions sections.
Legends automatically extend to show the legend title or legend text.