Map legend in Bold Reports® Web Report Designer
In the Bold Reports® Web Report Designer, a map legend explains the meaning of the colors on map shapes. Use the Legend property of the map to toggle the legend visibility and customize the legend appearance in the map design. The property is listed under the Legend category in the map properties.

The legend split the data range based on the shape color rules specified for respective map report item.
How do I show or hide the legend?
To show or hide the legend on the Bold Reports® map surface, toggle the Enable Legend checkbox.
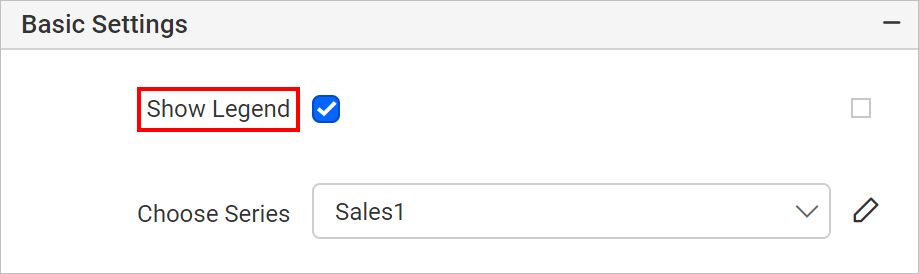
When you select the Enable Legend checkbox, the map legend displays in the right center position of the map surface.

You can also enable or disable the legend based on dynamic values by using Expressions. To open the set or reset expression menu in the properties panel, see the Set Expression and Reset Expression sections.
How do I customize the legend?
After you enable the Bold Reports® map legend, the other properties required for legend customization appear under the Legend category.

You customize the legend appearance through these properties.
Background color
The Background color property sets the background color of the map legend area.
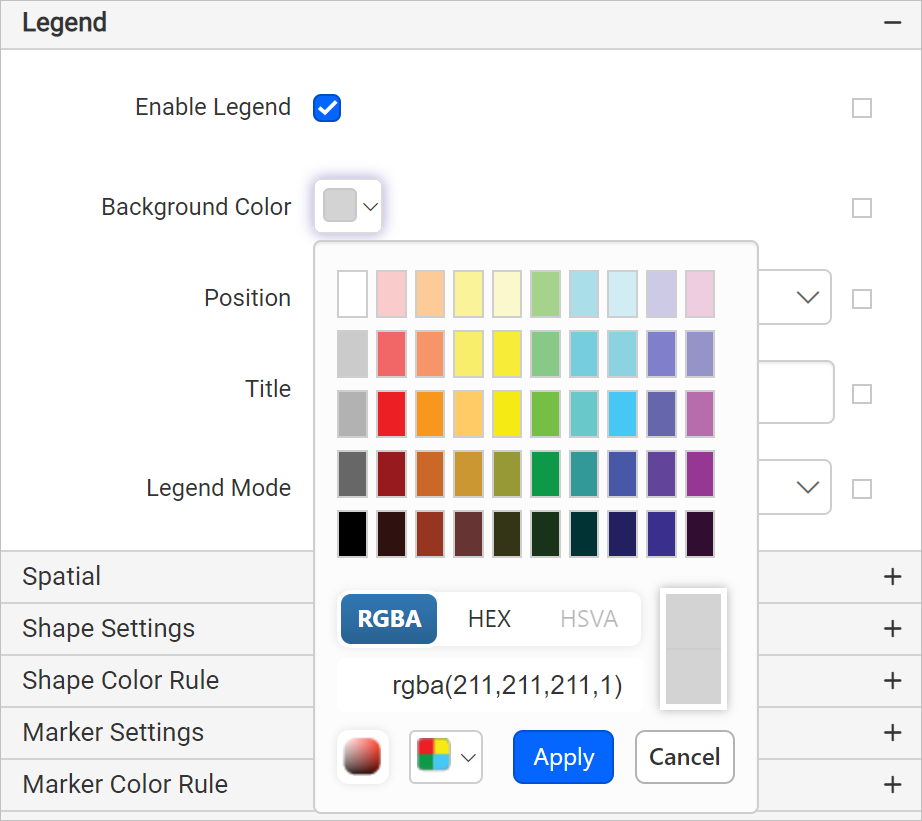
The background color is then applied to the legend area.

You can also apply the background color based on dynamic values by using Expressions. To open the set or reset expression menu in the properties panel, see the Set Expressions and Reset Expressions sections.
Position
The Position property places the map legend in different positions inside the map surface. The Position dropdown lists the supported positioning patterns.

By default, the legend is placed in the RightCenter position. In the following image, the legend is positioned at LeftTop inside the map surface.

Title
The Title property customizes the title text of the map legend. By default, the text displays as Title. Enter the title text you want in the title property textbox, and it displays as the map legend title in the map design.

You can also apply title text based on dynamic values by using Expressions. To open the set or reset expression menu in the properties panel, see the Set Expressions and Reset Expressions sections.
Title font
You customize the legend title text appearance through the properties in the Advanced menu of the title property. Follow these steps:
- Click the square icon on the right side of the
Titletext field. - Click the
Advancedoption in the menu.

The title font properties then display in the advanced options.

You can also apply font properties based on dynamic values by using Expressions. To open the set or reset expression menu in the properties panel, see the Set Expressions and Reset Expressions sections.

Legends automatically extend to show the legend title or legend text.
Legend mode
The Legend mode property sets the mode of the legend on the map surface.

Default mode groups the ranges and displays the legend as shown in the following image.

Interactive mode displays the ranges in a color scale.

Frequently asked questions
Where does the map legend appear by default?
When you enable the legend, it displays in the RightCenter position of the map surface.
What is the difference between the legend modes?
Default mode groups the ranges in the legend. Interactive mode displays the ranges in a color scale.