List report item in Bold Reports® Web Report Designer
The list report item in the Bold Reports® Web Report Designer creates free-form layouts. You can arrange text boxes, images, and other data regions anywhere within the list to create a form. The list acts as a container that places multiple report items side by side. A simple list design has a single cell in a row associated with the detail group, and the cell contains a Rectangle report item.

By default, no group expression is defined on a List. When no group expression is defined, the List repeats for each row in the datasource. When a group expression is defined on a List, the List repeats for each group in the datasource.
Like tables and matrices, list report items are implemented as a Tablix data region.
How do I add report items to a list?
To add report items to a Bold Reports® list cell, drag report items from the item panel or data fields from the Data panel to the cell. By default, the cell contains a rectangle that acts as a container.

The report item now drops into the list container, as shown in the following image.

When you right-click in the list cell, the menu that appears applies to the cell. If you insert a report item into the cell by using the
Insertoption from the cell context menu, the new report item replaces the rectangle in the cell. To insert items inside the list cell, drag and drop the report item into the cell that contains the rectangle.
The following image shows a simple design that uses the list to display product details.

On report preview, the List repeats for each row in the datasource.

Which properties can I set for a list?
The Bold Reports® properties panel lists every list property described below. Read the Properties panel section before you set the following properties.
Data
The Data category of the list holds the dataset, filter, and sort properties.

Dataset
The Dataset property assigns a dataset to the list. The Dataset property dropdown lists the available datasets in the report. Choose the dataset you want from the dropdown.
Each list report item can only show data from one dataset.

To add a dataset to your report, see the Create Data section.
Filter
Filters limit the data shown in the list. To open the Filter dialog, click the Set Filters... button. The filter dialog opens as shown in the following image.

To add or remove filters in the filter dialog, see the Filter Data section.
Sort
Sorting orders a numeric or string field in the list. You can apply sorting to the whole data region or to each group, including the details group. To open the sort dialog, click the Set Sorts... button. The sort dialog opens as shown in the following image.

To add or remove sort expressions in the sort dialog, see the Sort Data section.
Appearance
The border style, color, width, and background color properties style the list and customize its appearance in the report design. The properties panel lists these properties under the Appearance category.
Border
Border properties add or customize the border around a list item to visually separate it in the report design. To set border properties for the list item in the properties panel, see the Border Properties section.
Background color
The background color property colors the list background. To set the background color in the properties panel, see the Background color section.
Position
The Position property sets the width, height, left, and top position of the list in the report design. To set these properties in the properties panel, see the Position section.
No Rows
The No Rows property displays static text when the dataset returns empty or zero rows at run time.
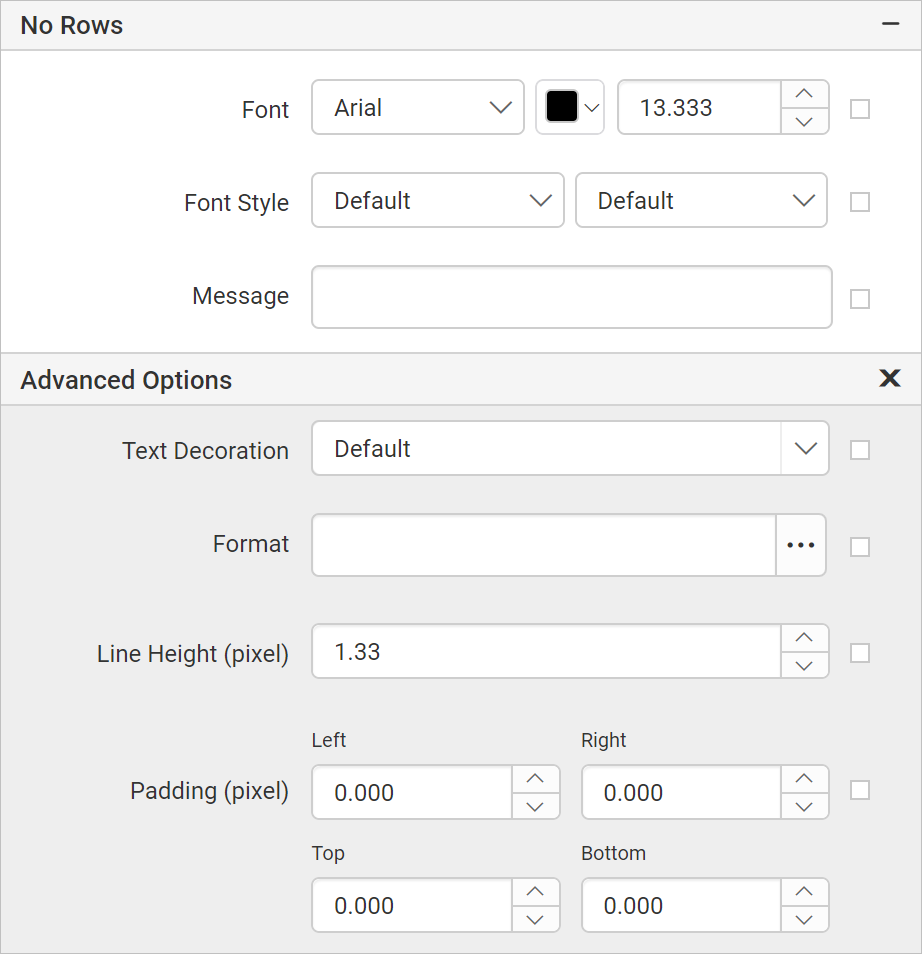
To set or reset the no data message properties, see the No Rows property section.
Data Element
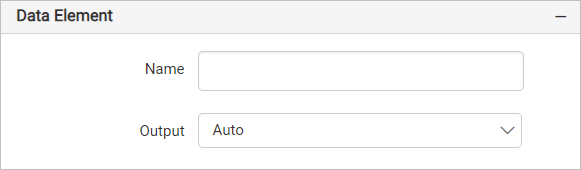
The Data element properties control the visibility of a list when you export the report in XML format. The properties panel lists these properties under the Data Element category.
Name
Use the Name field to assign a custom name to the list element. The list report item is exported with the name you provide.
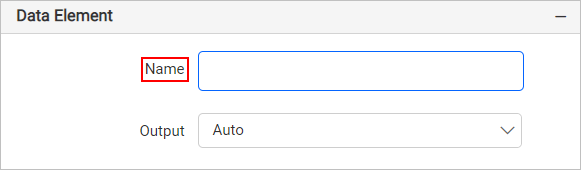
Note: The name cannot contain spaces, and it must begin with a letter followed by letters, numbers, or the underscore character (_).
Output
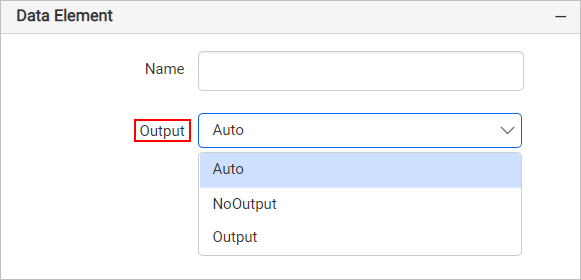
The Output property controls the visibility of the list when you export the report. Each option performs the following operation:
- Auto or Output: Exports the list report item.
- NoOutput: Does not export the list report item.
Visibility
The Visibility property conditionally shows or hides the list report item on report preview or export. To set the visibility of the item in the properties panel, see the Visibility section.
Miscellaneous
The Miscellaneous category holds the page name, document map, bookmark, custom attributes, tooltip, and custom style properties of the list.
Page name
The page name property names the first worksheet of the Excel workbook when you export the report to Excel format.

You can set static or dynamic text as the page name. To set and reset dynamic text, see the Set Expression and Reset Expression sections.
Document Map
A document map is a navigational feature that displays a separate side pane with a set of navigational links in a hierarchical structure when you view a report. Users click an entry in the list to navigate to the report page that displays that item. To configure a document map in the report design, see the Document Map section.
You can set static or dynamic text as the value of the document map property. To set and reset dynamic text, see the Set Expression and Reset Expression sections.
Bookmark
Bookmark links let users navigate to different parts of an SSRS report. You can add bookmarks to each textbox, image, table, or chart, or to the unique group values displayed in a tablix, to direct users to specified locations in the report. The bookmark value can be your own string or an expression. To configure a bookmark in the report design, see the Bookmark section.
You can set static or dynamic text as the value of the bookmark property. To set and reset dynamic text, see the Set Expression and Reset Expression sections.
Custom attributes
The custom attributes property sets the values of list report item custom properties. To create and assign values to custom properties in the properties panel, see the Custom Properties section.
Tooltip
The Tooltip property displays informative text or a value when the user hovers over the report item in report preview. To set a tooltip for the list report item in the properties panel, see the Tooltip section.
Custom Style
The Custom Style property lets you use external CSS to style report items, giving more flexibility than the built-in styling options. Use this property to meet specific design requirements and keep styling consistent across multiple reports. For a step-by-step guide on setting up custom styles in your report, see the How To section of this guide.

How do I set an expression on a list property?
You can set an expression on a few properties of the Bold Reports® list report item to process the property values. To set expressions on the list report item properties, see the Set Expression section.
How do I reset an expression?
To Reset the expression applied to a list property, see the Reset Expression section.
How do I open nested (advanced) properties?
A few properties of the Bold Reports® list report item contain nested properties. To open and handle nested properties, see the Advanced Properties section.
How do I design an RDL report using a list?
To learn how to design a simple list in your Bold Reports® report, see the Design ssrs RDL report using list section.
Frequently asked questions
How often does a list repeat?
With no group expression, the List repeats for each row in the datasource. With a group expression, the List repeats for each group in the datasource.
Can one list show data from several datasets?
No. Each list report item can only show data from one dataset.