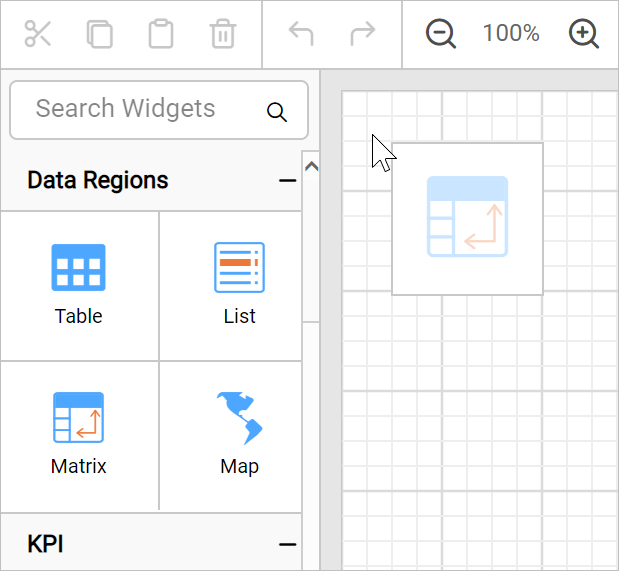
Matrix report item in Bold Reports®
The matrix report item in the Bold Reports® Web Report Designer displays summarized data. It lets you group and summarize data by both rows and columns. A simple matrix design contains a row group, a column group, a corner cell, and a data cell.

Properties
The matrix report item in the Bold Reports® Web Report Designer uses the tablix properties. See the Tablix Properties section to set and edit property values for the matrix report item.
How do I add a matrix to the report?
You add a matrix in the Bold Reports® Web Report Designer by dragging it from the item panel. Follow these steps:
- Find the matrix report item in the item panel under the
Data Regionscategory.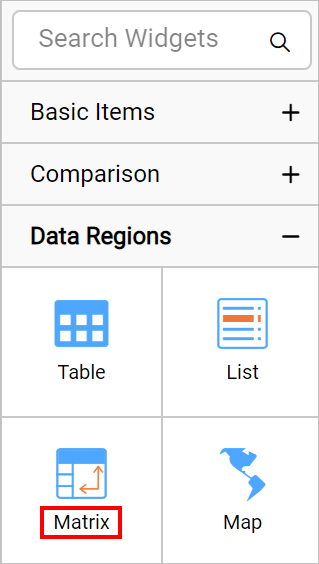
- Drag and drop the matrix report item from the item panel into the design area. The properties of the matrix report item are listed in the properties panel. By default, it is named
Tablix1.