Nested Data Regions
The data region such as a chart can be placed inside the another data region such as a tablix, to link more than one data region to the same dataset. This will provide different views of the same data. For example, if you want to create a sales report for each sales person, you can create a list with text boxes and an image to display information about the employee, and then add table and chart data regions to the list to show the employee’s sales record.
Assign data to the nested data region
When you create a report design with nested data regions, the dataset assigned to the parent data region will be inherited by the nested data regions. Nested data regions are based on the single dataset, the data regions based on different datasets cannot be nested inside one another.
Assign data to the nested chart region
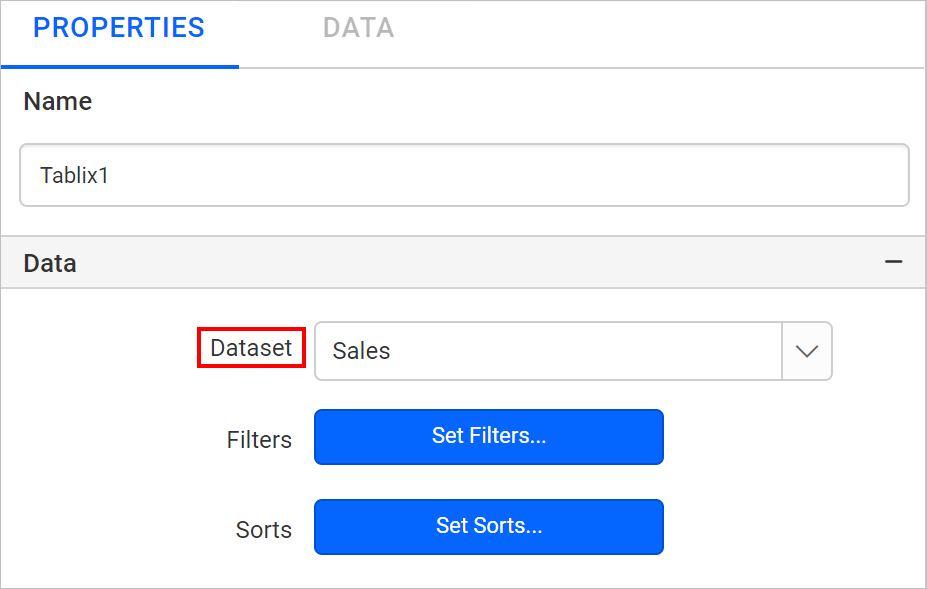
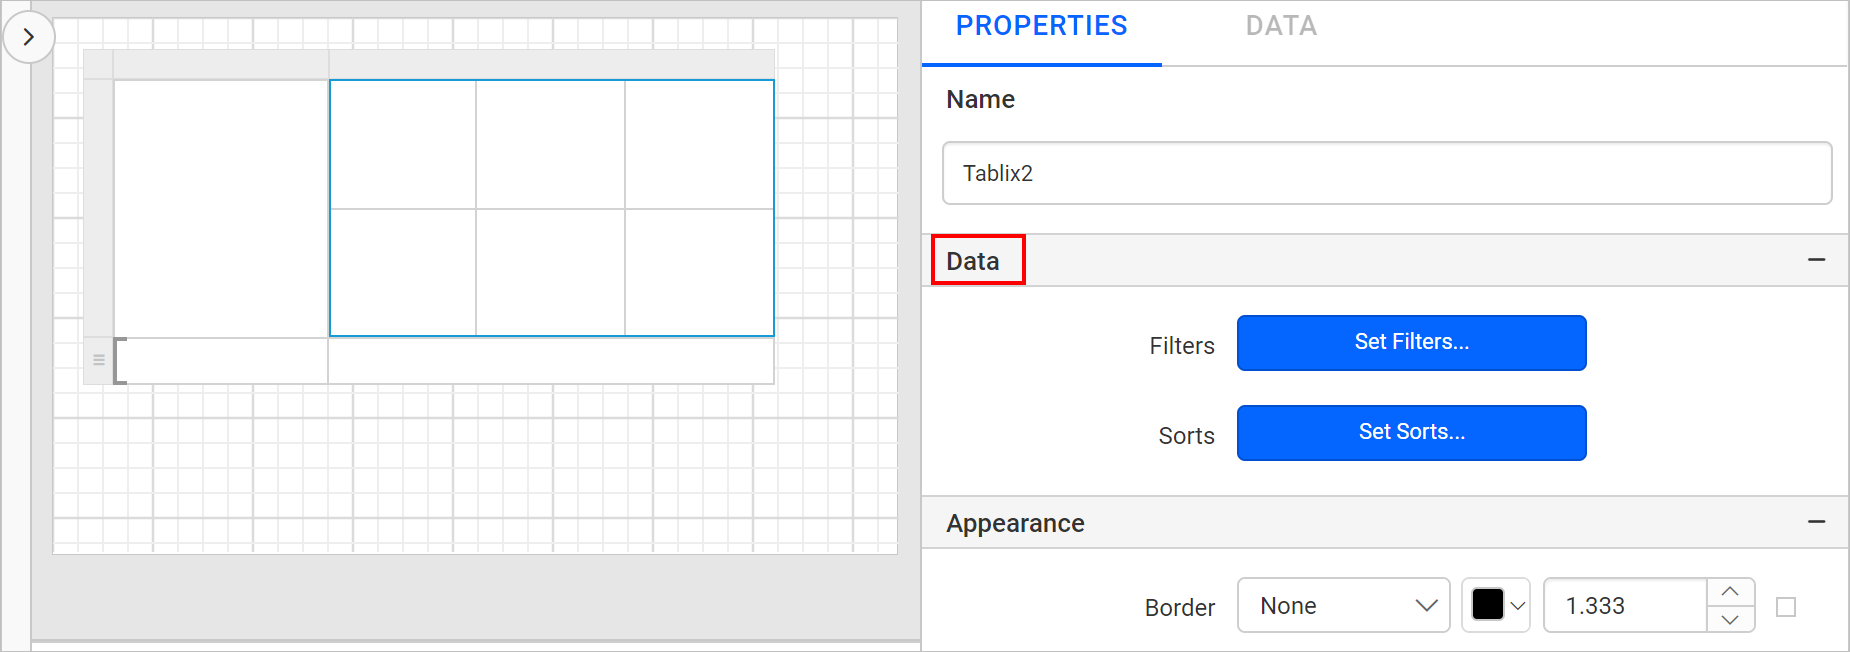
If the chart data region is nested within a table, the Data tab of the chart report item will be in the disabled state until you assign data to the table report item.
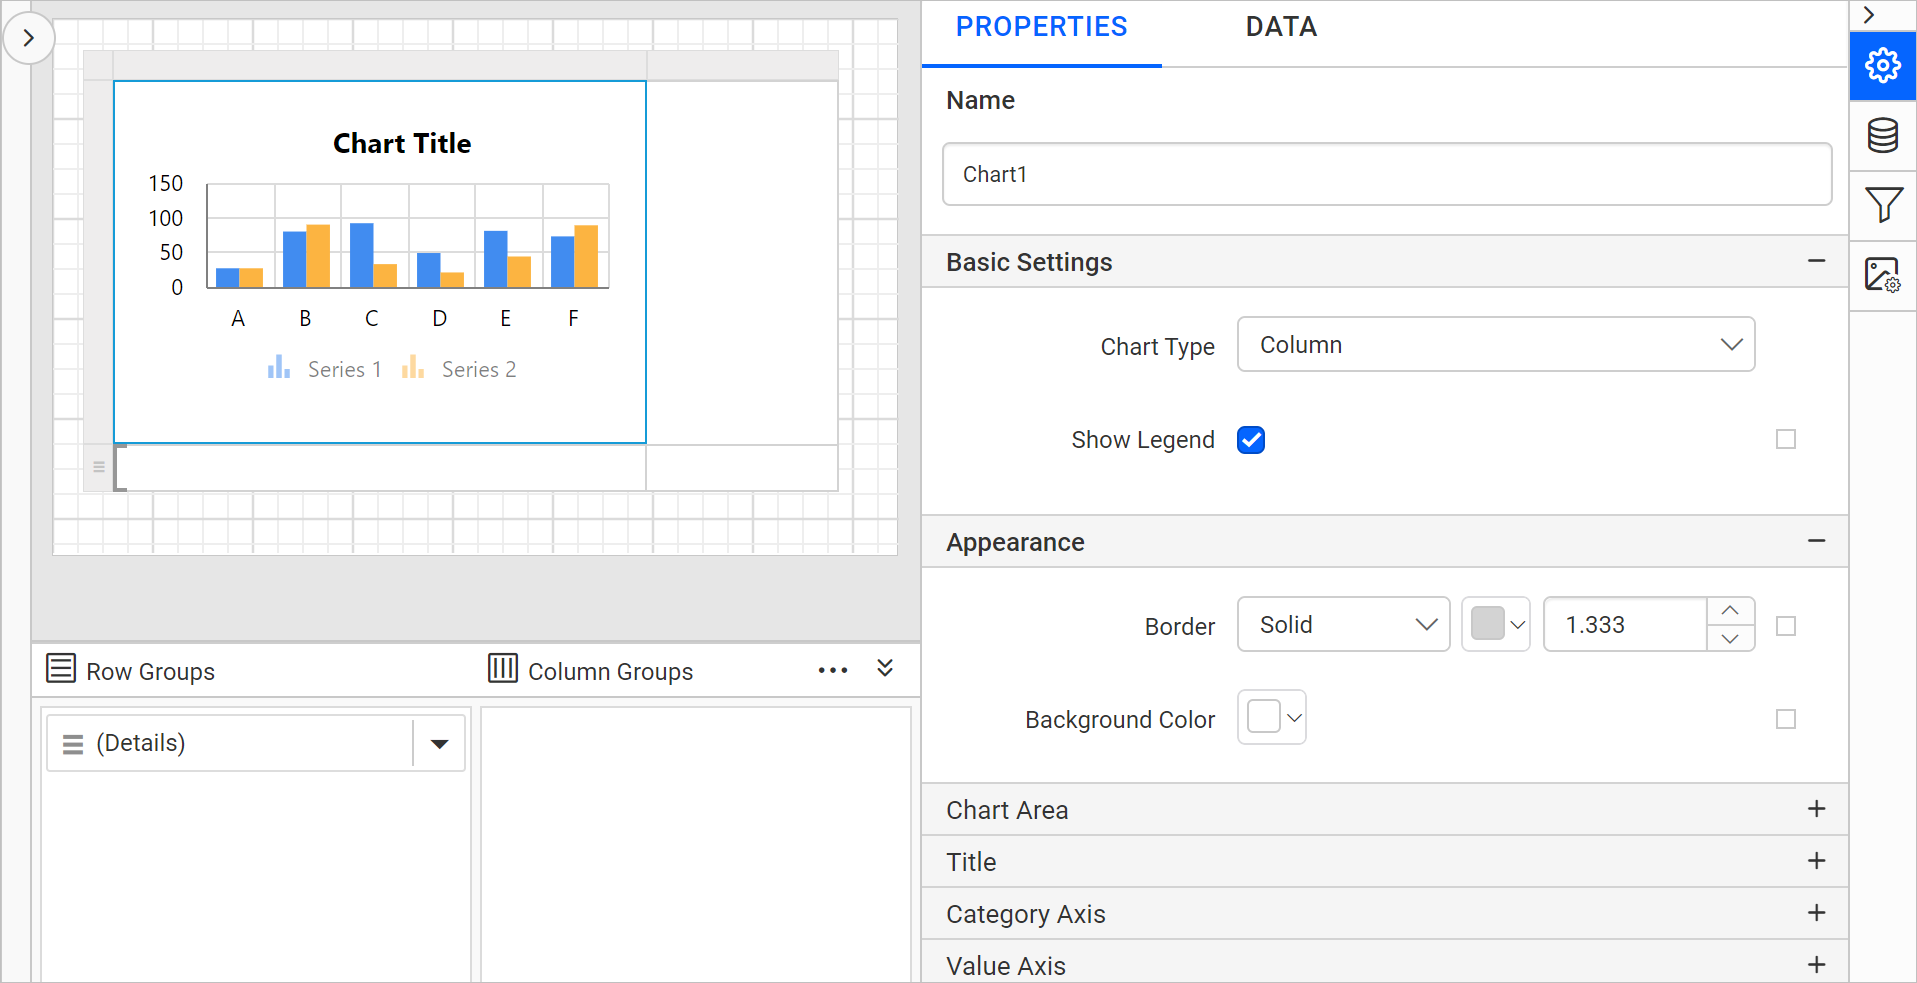
To enable the Data panel for chart report item, select the table report item and assign the dataset in the Dataset property using properties panel.
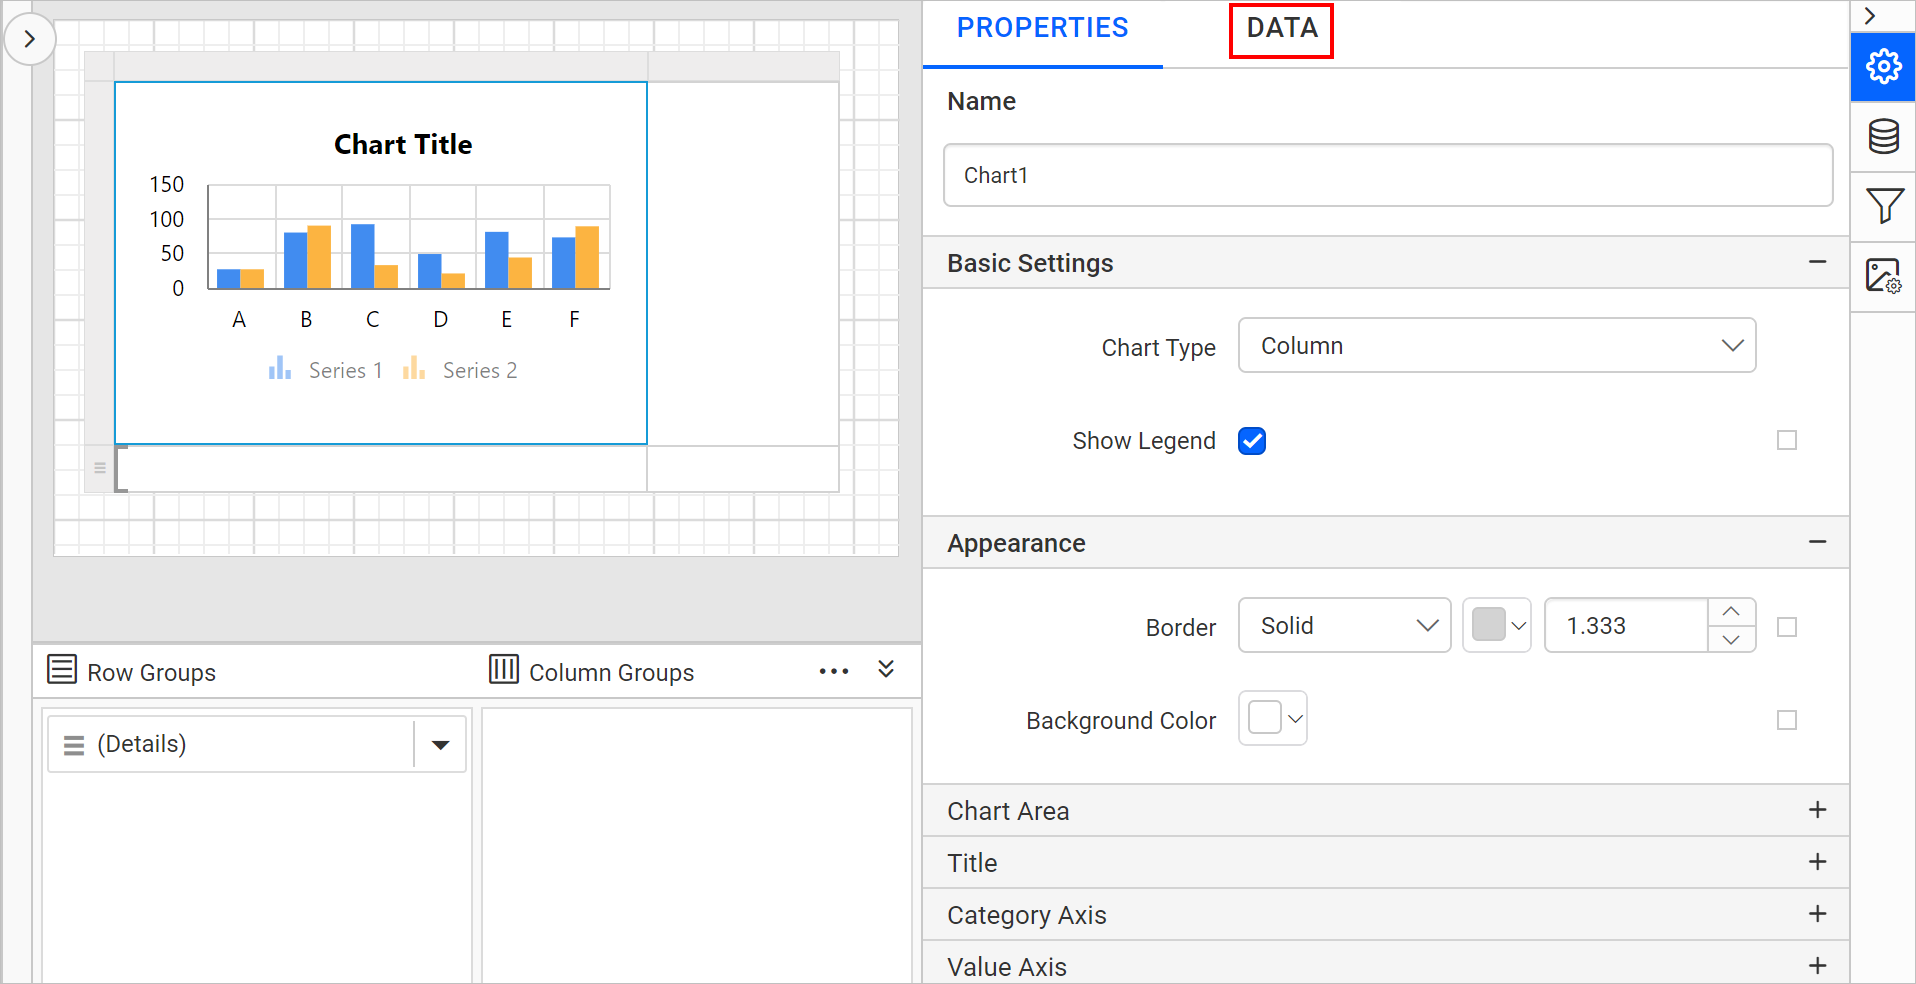
Now, select the nested chart report item in the table cell and notice the Data panel is in enabled state.
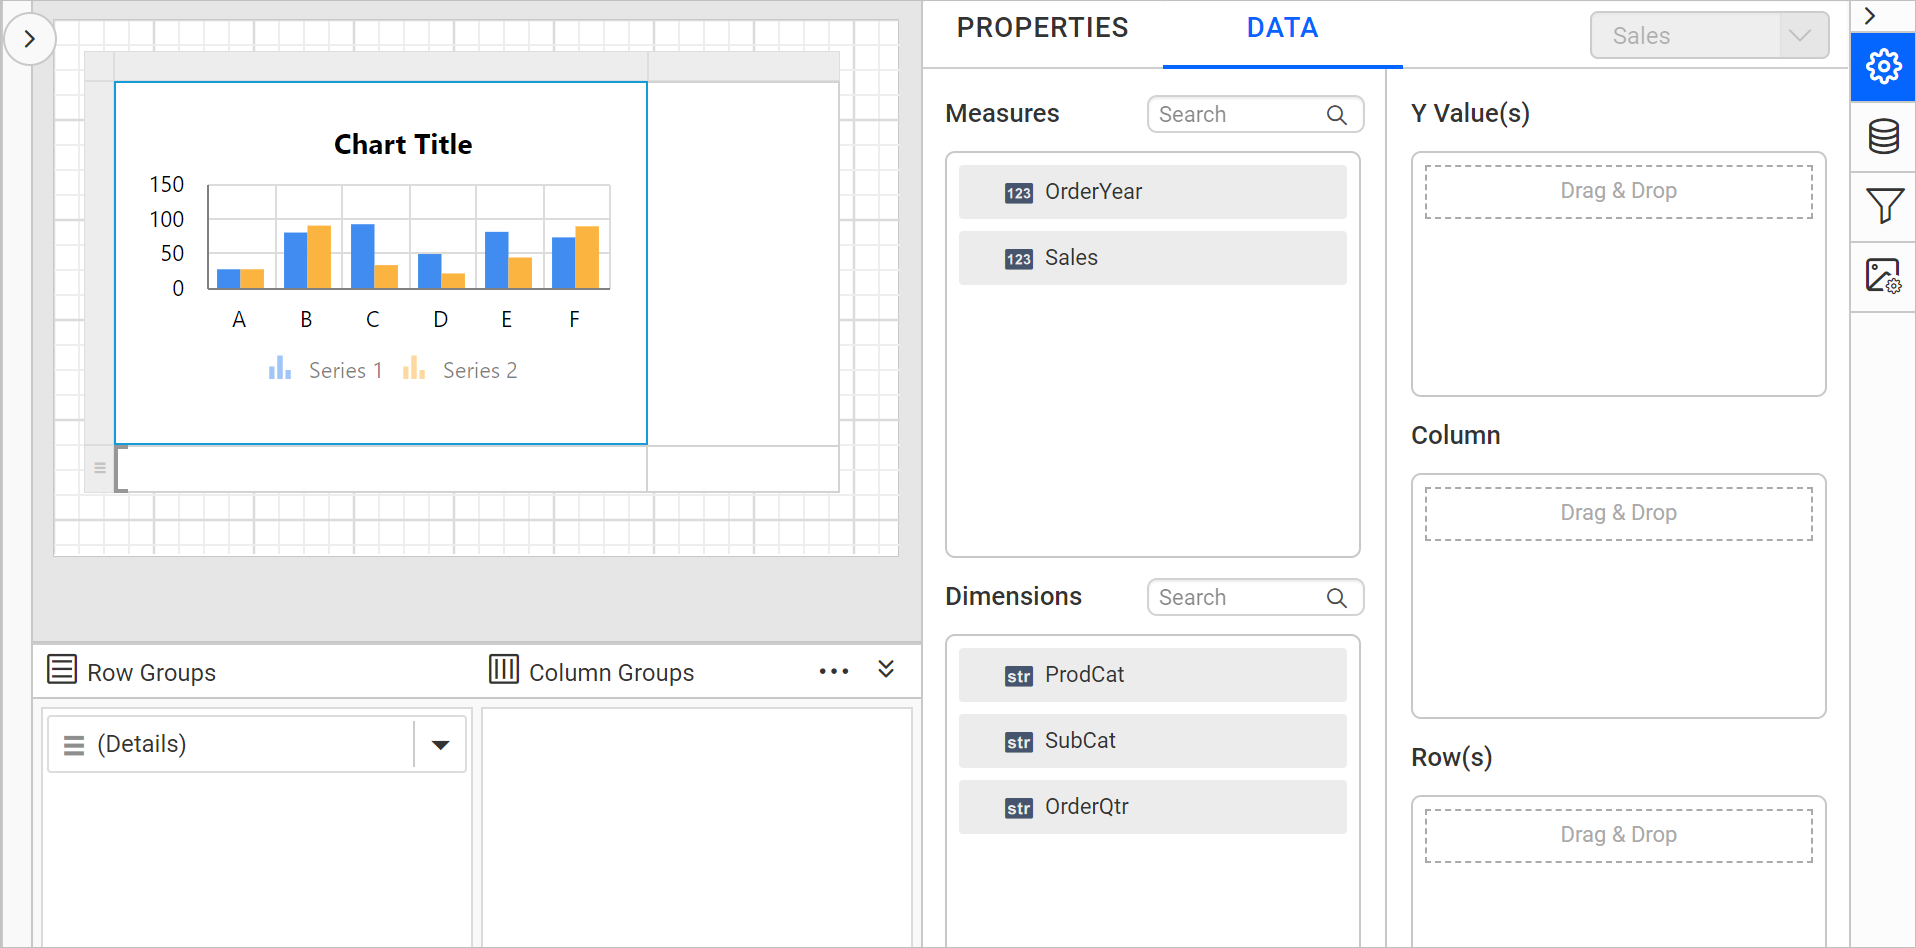
Switch to the Data tab and assign data fields to the chart.
Assign data to the nested tablix region
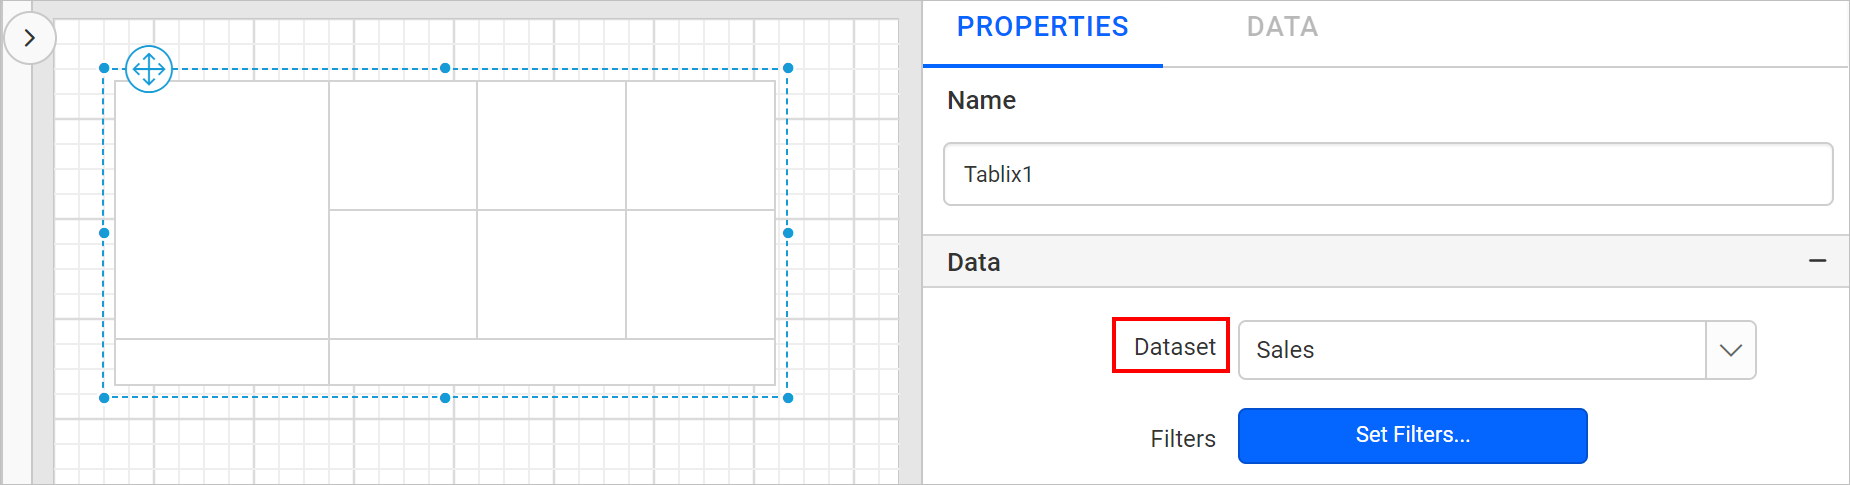
If any of the tablix data region is nested within another tablix region, the Dataset property for the nested tablix region will not available in the tablix properties.
So to assign data to the nested tablix region, select the parent data region and assign the dataset in the Dataset property using properties panel.
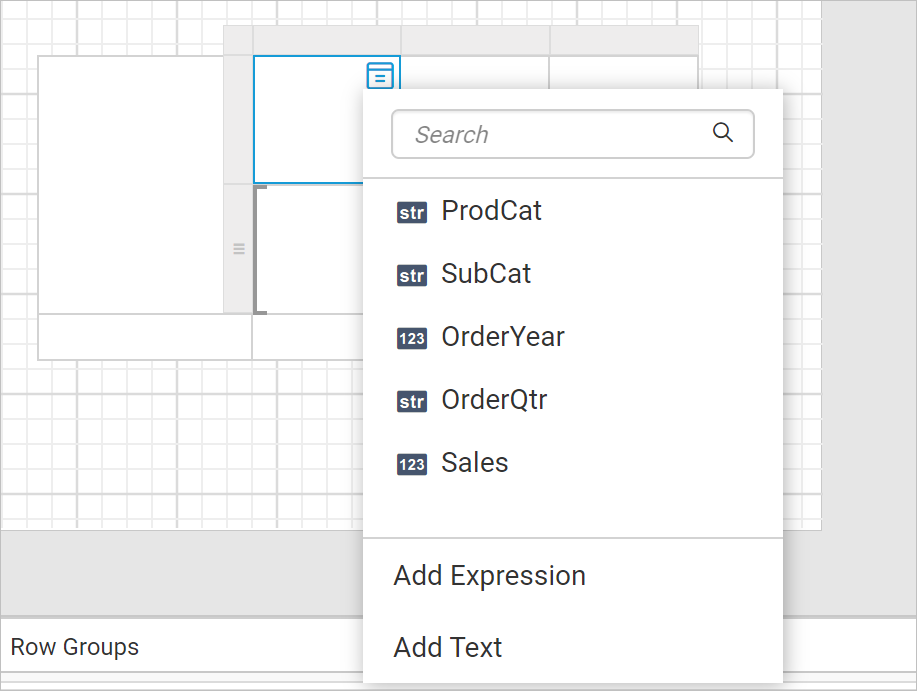
Now, select a cell in nested tablix region and open the data assign menu. The available fields in the respective dataset will be listed in the data assign menu, from then you can assign data to the nested tablix region.
Scope of data for nested data regions
The data bind to the nested data regions, based on the position of the nested data regions in the parent data region. The following points describes the scope for cells in the following Tablix areas:
-
Tablix corner - The data bind to the nested data regions, after the filter and sort expressions for the dataset and the outer Tablix are applied.
-
Tablix column group - The data bind to the nested data regions in the innermost column group, after the filter and sort expressions for the dataset, the outer Tablix, and the column groups are applied.
-
Tablix row group - The data bind to the nested data regions in the innermost row group, after the filter and sort expressions for the dataset, the outer Tablix, and the row groups are applied.
-
Tablix body - The data bind to the nested data regions in the tablix body area, after the filter and sort expressions for the dataset, the outer Tablix, and the row and column groups are applied.
Cannot insert a multi-value item into a detail cell. Detail members can only contain the static inner members.
Design a simple report with nested data region
-
To present data in the data regions, create a dataset and bind data to the data region. In this designing section, the following dataset query is used for dataset creation.
SELECT SOD.SalesOrderDetailID, SOD.OrderQty, SOD.UnitPrice,
        CASE WHEN SOD.UnitPriceDiscount IS NULL THEN 0 ELSE SOD.UnitPriceDiscount END AS UnitPriceDiscount,
        SOD.LineTotal, SOD.CarrierTrackingNumber, SOD.SalesOrderID, P.Name, P.ProductNumber
FROM    Sales.SalesOrderDetail SOD INNER JOIN
        Production.Product P ON SOD.ProductID = P.ProductID INNER JOIN
        Sales.SalesOrderHeader SOH ON SOD.SalesOrderID = SOH.SalesOrderID
Refer Create Data section and create dataset using the above query.
AdventuresWorksdatabase is used here. -
Drag and drop a
Listreport item to the design surface.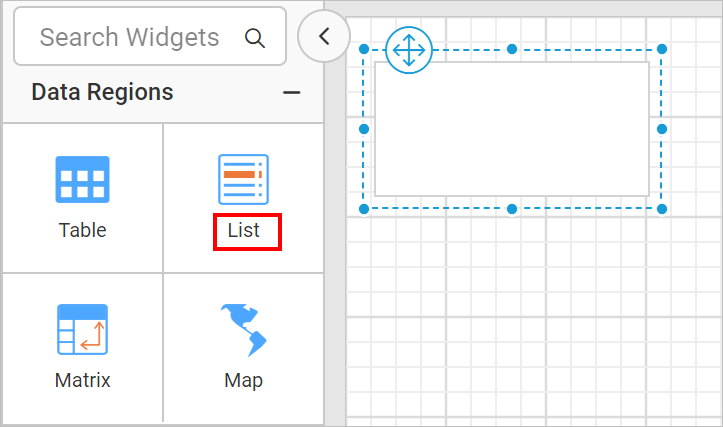
-
Select the
Listreport item and choose the dataset in theDatasetproperty using property panel.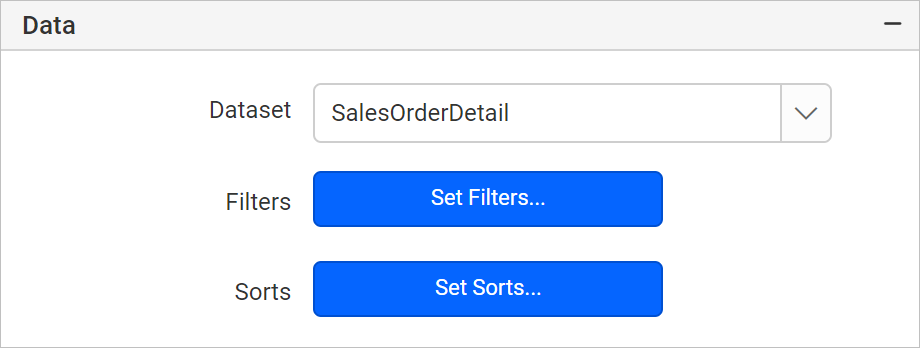
-
In the Row Grouping pane, click on the
(Details)field, now the tablix member properties will be listed in the properties panel.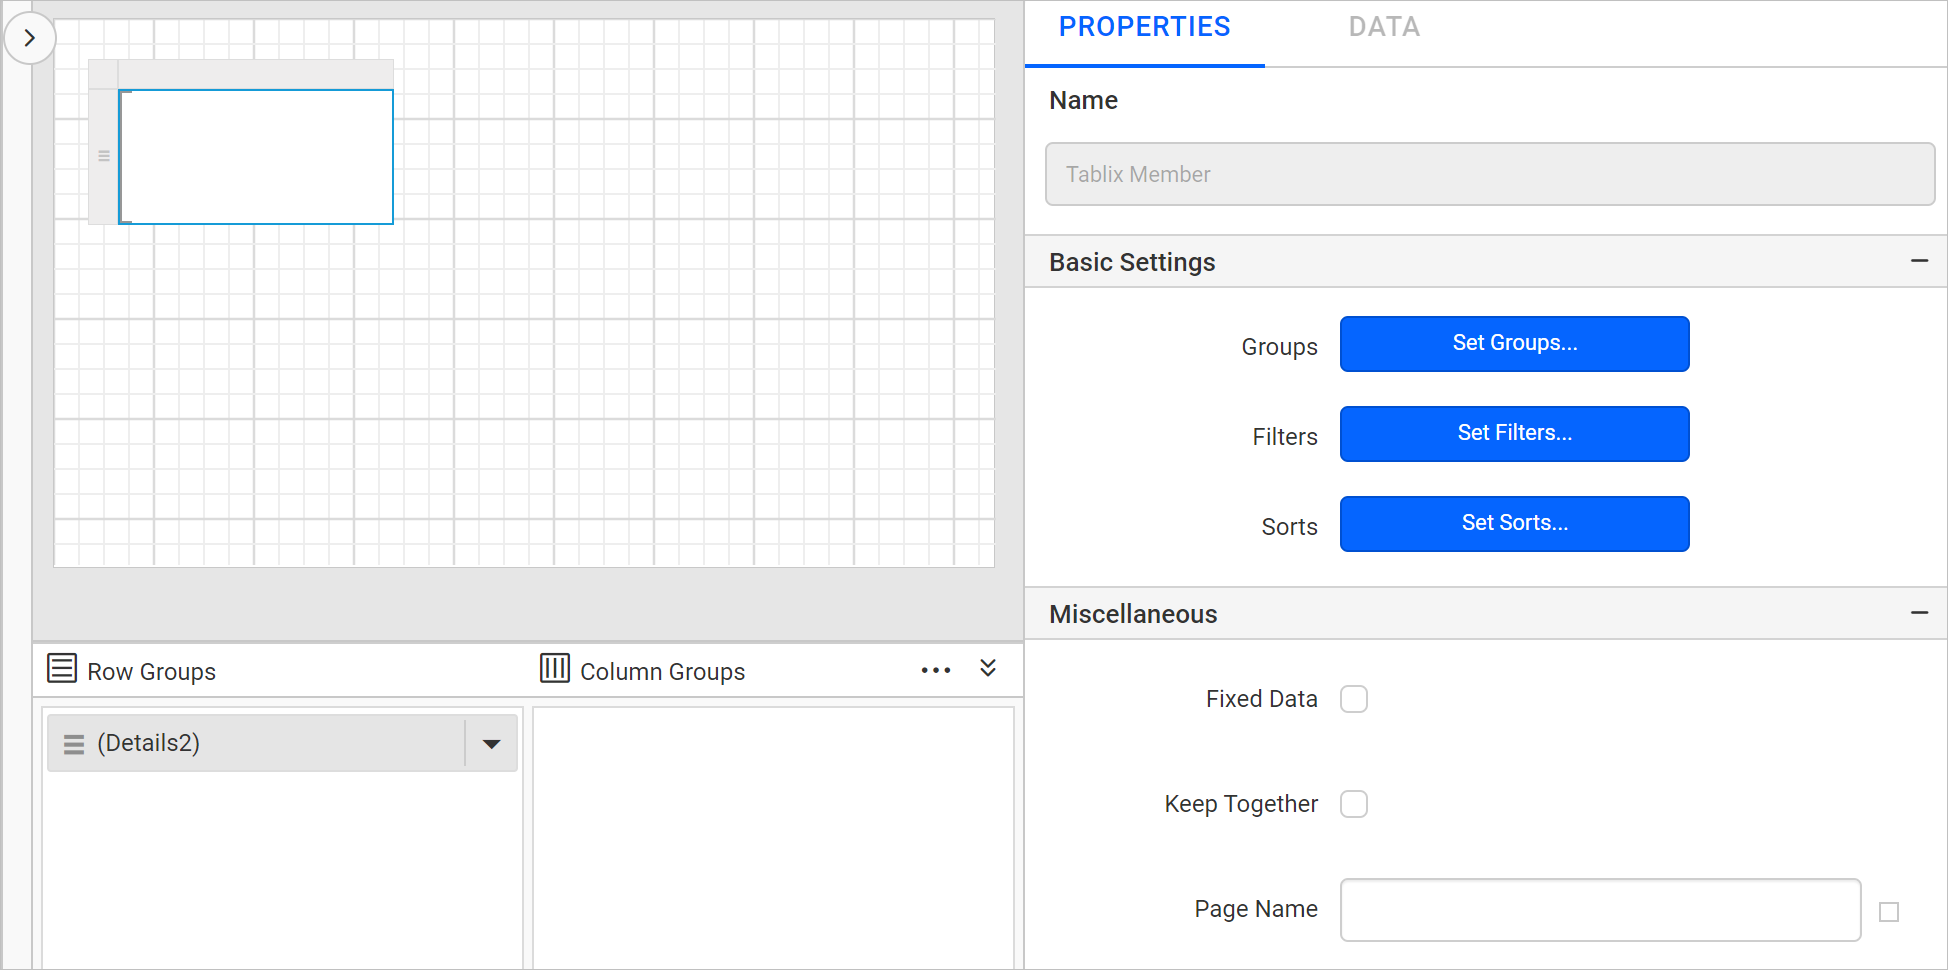
-
Click on the
Groupsbutton to open theGroupingdialog.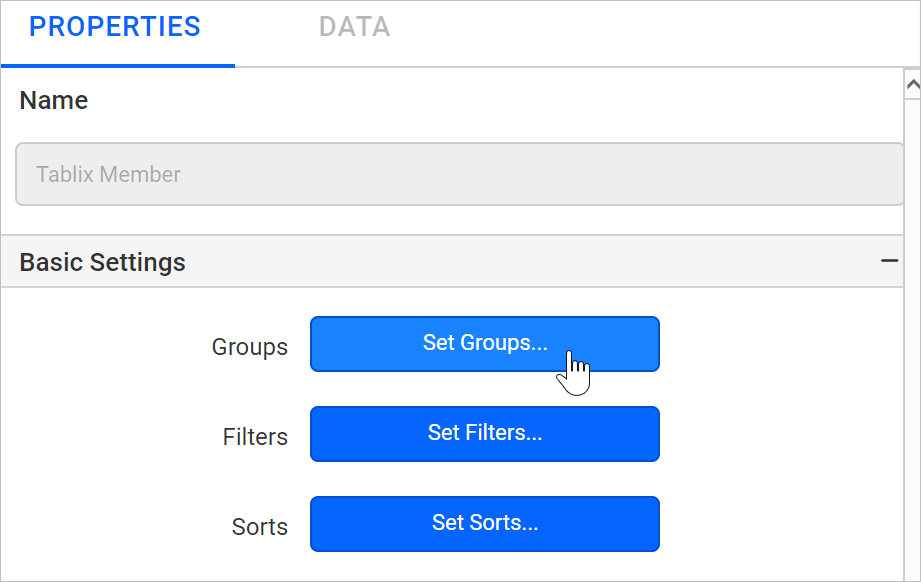
-
Change the Name to
SalesOrderID. ClickAddin theGroupingdialog and chooseSalesOrderIDin drop-down list and clickOK.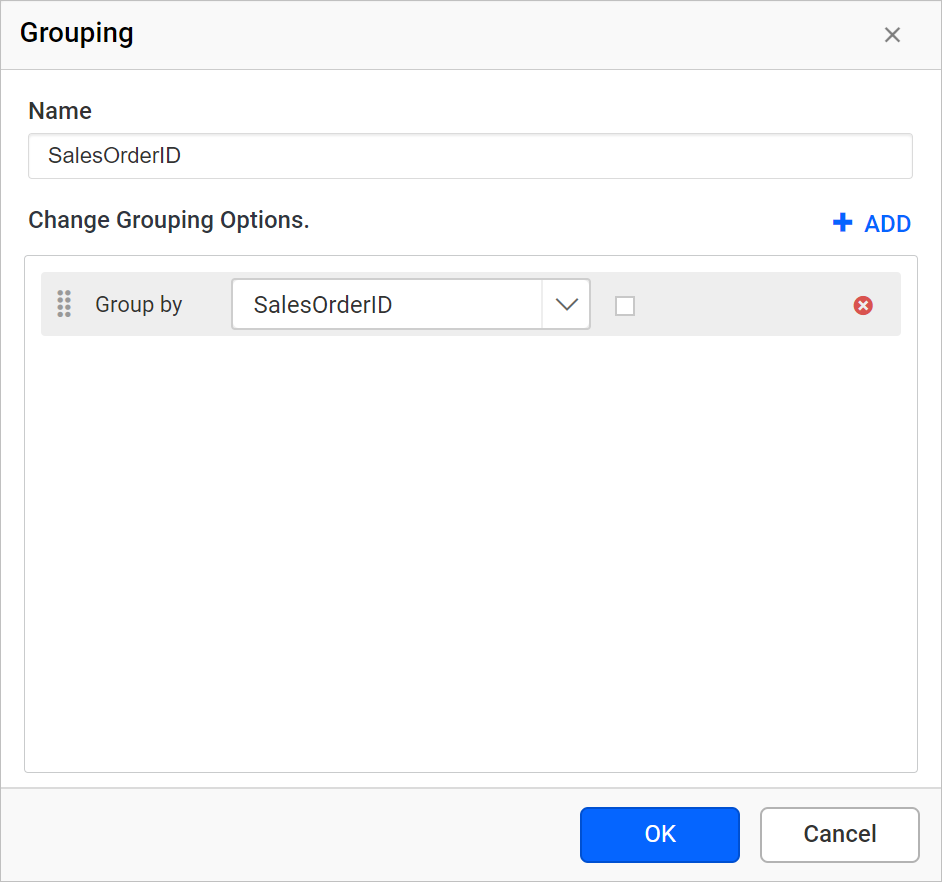
By adding a group expression, details group is changed as a parent group organized by sales order Id’s.
-
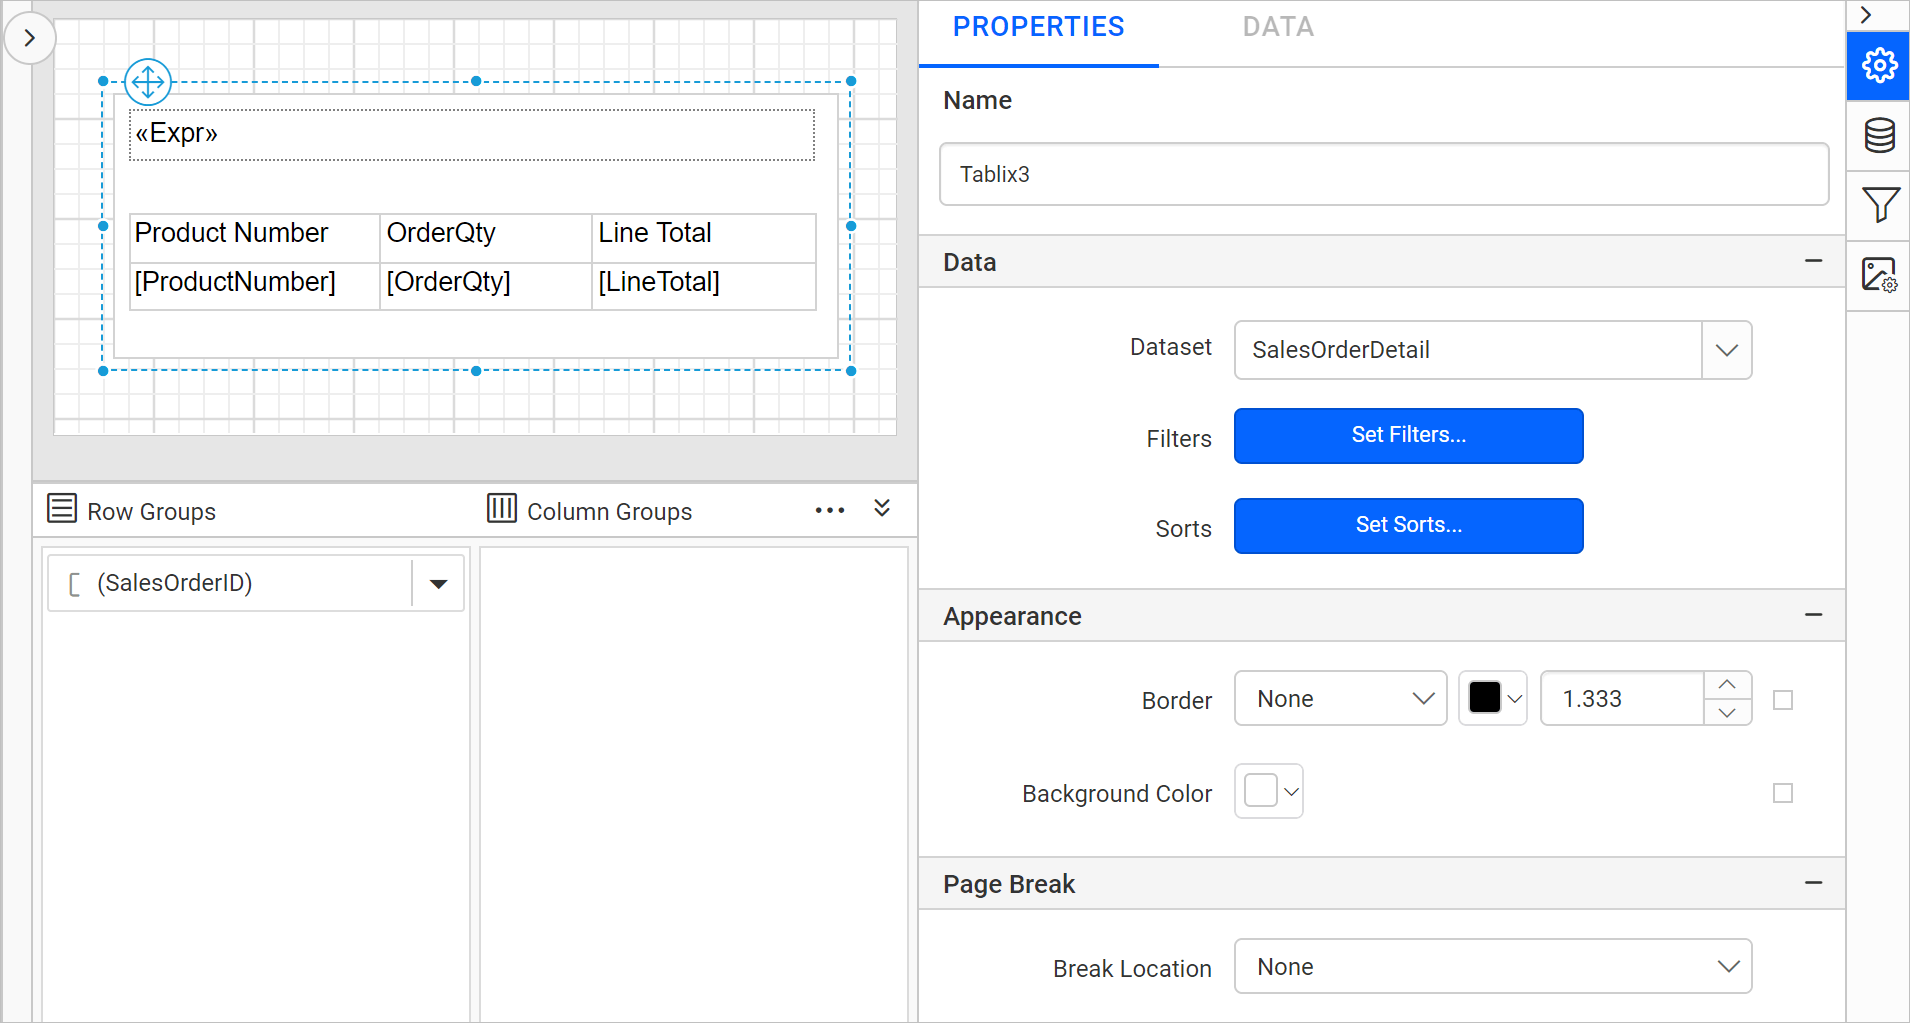
Resize the List data region to the required size and drag and drop a textbox report item in the list report item.
-
Refer Create Expression in Textbox and assign the
="Sales Order: " & Fields!SalesOrderID.Valueexpressions in the textbox. -
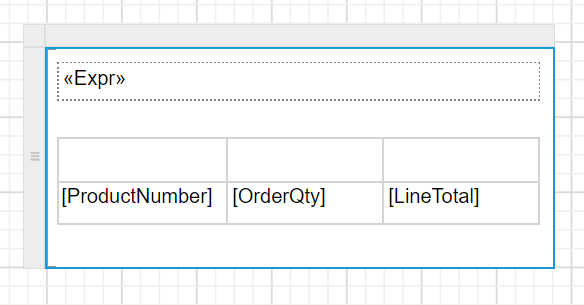
Drag and drop a
Tablereport item into List.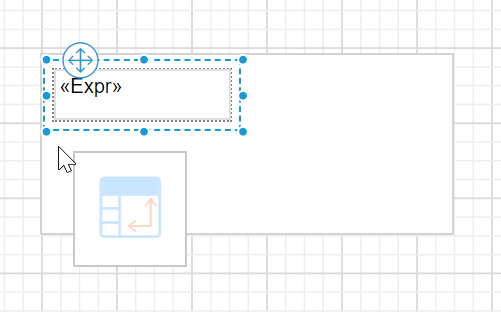
-
Refer Assign data fields section and assign the
ProductNumber,OrderQty,LineTotaldata fields to the table.
 11. Refer Set header text using data assign menu section and set header text to the table header row.
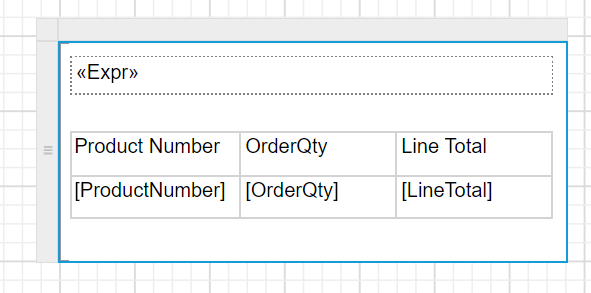
A simple sales order details report is designed using list and table data regions to group the data based on SalesOrderID.
Download the above report design from link.