Add Web Report Viewer to a React application
This section explains the steps required to add a web Report Viewer to a React application.
To get started quickly with Report Viewer, you can check this video:
Prerequisites
Before getting started with the bold report viewer, make sure that your development environment includes the following commands.
Install the Create React App package
Create React App is a simple way to create a single-page React application which provides a build setup with no configuration. To install the Create React App globally in your machine, run the following command in the Command Prompt.
npm install create-react-app -gTo learn more about Create React App package, refer here.
Create a new React application
To create a new React application, run the following command in the Command Prompt.
create-react-app reportsThe
create-react-appcommand adds thereact,react-dom,react-scripts, and other dependencies required for your React application.
The source code for this React reporting components app is available on GitHub.
Install the Create React Class
To configure the Report Viewer component, change the directory to your application�s root folder.
cd reportsTo install the type definitions for create-react-class, run the following command in the Command Prompt.
npm install create-react-class --saveInstall the Bold Reports® React package
Run the following commands to install the Bold Reports® React library.
| React version | NPM package installation |
|---|---|
| greater than 16 | npm install @boldreports/react-reporting-components@latest —save-dev |
| 16 or less than 16 (Warning: This version may have compatibility limitations with newer React features.) | npm install @boldreports/[email protected] —save-dev |
Note: Using the latest package with React 16 may cause compilation issues. Make sure to install the correct version to avoid problems.
Adding scripts reference
Bold Reports® needs window.jQuery object to render the React components. Hence, create a file named globals.js in the src folder and import jQuery into the globals.js file, like in the below code snippet.
import jquery from 'jquery';
import React from 'react';
import createReactClass from 'create-react-class';
import ReactDOM from 'react-dom';

window.React = React;
window.createReactClass = createReactClass;
window.ReactDOM = ReactDOM;
window.$ = window.jQuery = jquery;
Refer to the globals.js file in the index.js file, like in the below code snippet.
import './globals';
import React from 'react';
import ReactDOM from 'react-dom';
import './index.css';
import App from './App';

ReactDOM.render(<App />, document.getElementById('root'));
import './globals';
import React from 'react';
import { createRoot } from 'react-dom/client';
import './index.css';
import App from './App';
import reportWebVitals from './reportWebVitals';
const root = createRoot(document.getElementById('root'));
root.render(
<React.StrictMode>
<App />
</React.StrictMode>
);Adding Report Viewer component
The Bold Report Viewer script and style files need to be imported in order to run the Web Report Viewer. Hence, import the following files into the App.js file.
/* eslint-disable */
import React from 'react';
import './App.css';
//Report Viewer source
import '@boldreports/javascript-reporting-controls/Content/v2.0/tailwind-light/bold.report-viewer.min.css';
import '@boldreports/javascript-reporting-controls/Scripts/v2.0/common/bold.reports.common.min';
import '@boldreports/javascript-reporting-controls/Scripts/v2.0/common/bold.reports.widgets.min';
import '@boldreports/javascript-reporting-controls/Scripts/v2.0/bold.report-viewer.min';
//Reports react base
import '@boldreports/react-reporting-components/Scripts/bold.reports.react.min';

var viewerStyle = {'height': '700px', 'width': '100%'};

function App() {
  return (
    <div style={viewerStyle}>
      <BoldReportViewerComponent
      id="reportviewer-container">
      </BoldReportViewerComponent>
    </div>
  );
}

export default App;
Create a Web API service
The Web Report Viewer requires a Web API service to process the data and file actions. You can skip this step and use our online Web API services(https://demos.boldreports.com/services/) to create, edit, and browse reports or you must create any one of the following Web API services.
If you are looking to load the report directly from SQL Server Reporting Services (SSRS), then you can skip the following steps and move to the SSRS Report.
Set a Web API service URL
To set a Web API service, open the App.js file and replace the existing code with the below code snippet.
/* eslint-disable */
import React from 'react';
import './App.css';
//Report Viewer source
import '@boldreports/javascript-reporting-controls/Content/v2.0/tailwind-light/bold.report-viewer.min.css';
import '@boldreports/javascript-reporting-controls/Scripts/v2.0/common/bold.reports.common.min';
import '@boldreports/javascript-reporting-controls/Scripts/v2.0/common/bold.reports.widgets.min';
import '@boldreports/javascript-reporting-controls/Scripts/v2.0/bold.report-viewer.min';
//Reports react base
import '@boldreports/react-reporting-components/Scripts/bold.reports.react.min';

var viewerStyle = {'height': '700px', 'width': '100%'};

function App() {
  return (
    <div style={viewerStyle}>
     <BoldReportViewerComponent
     id="reportviewer-container"
     reportServiceUrl = {'https://demos.boldreports.com/services/api/ReportViewer'}
     reportPath = {'~/Resources/docs/sales-order-detail.rdl'} >
     </BoldReportViewerComponent>
    </div>
  );
}

export default App;
In the above code, the
reportServiceUrlis used from online URL. You can host the Bold Reports® service at any Azure, AWS, or own domain URL and use it in the Report Viewer. You can view the already created Web API service from the Reporting Service git hub location.
Run the Application
To run the application, run the following command at the command prompt.
npm run startWhile running the above command, if you are getting an error like
'BoldReportViewerComponent' is not definedthen you need to disable theeslintby adding the line/* eslint-disable */at the top of App.js.
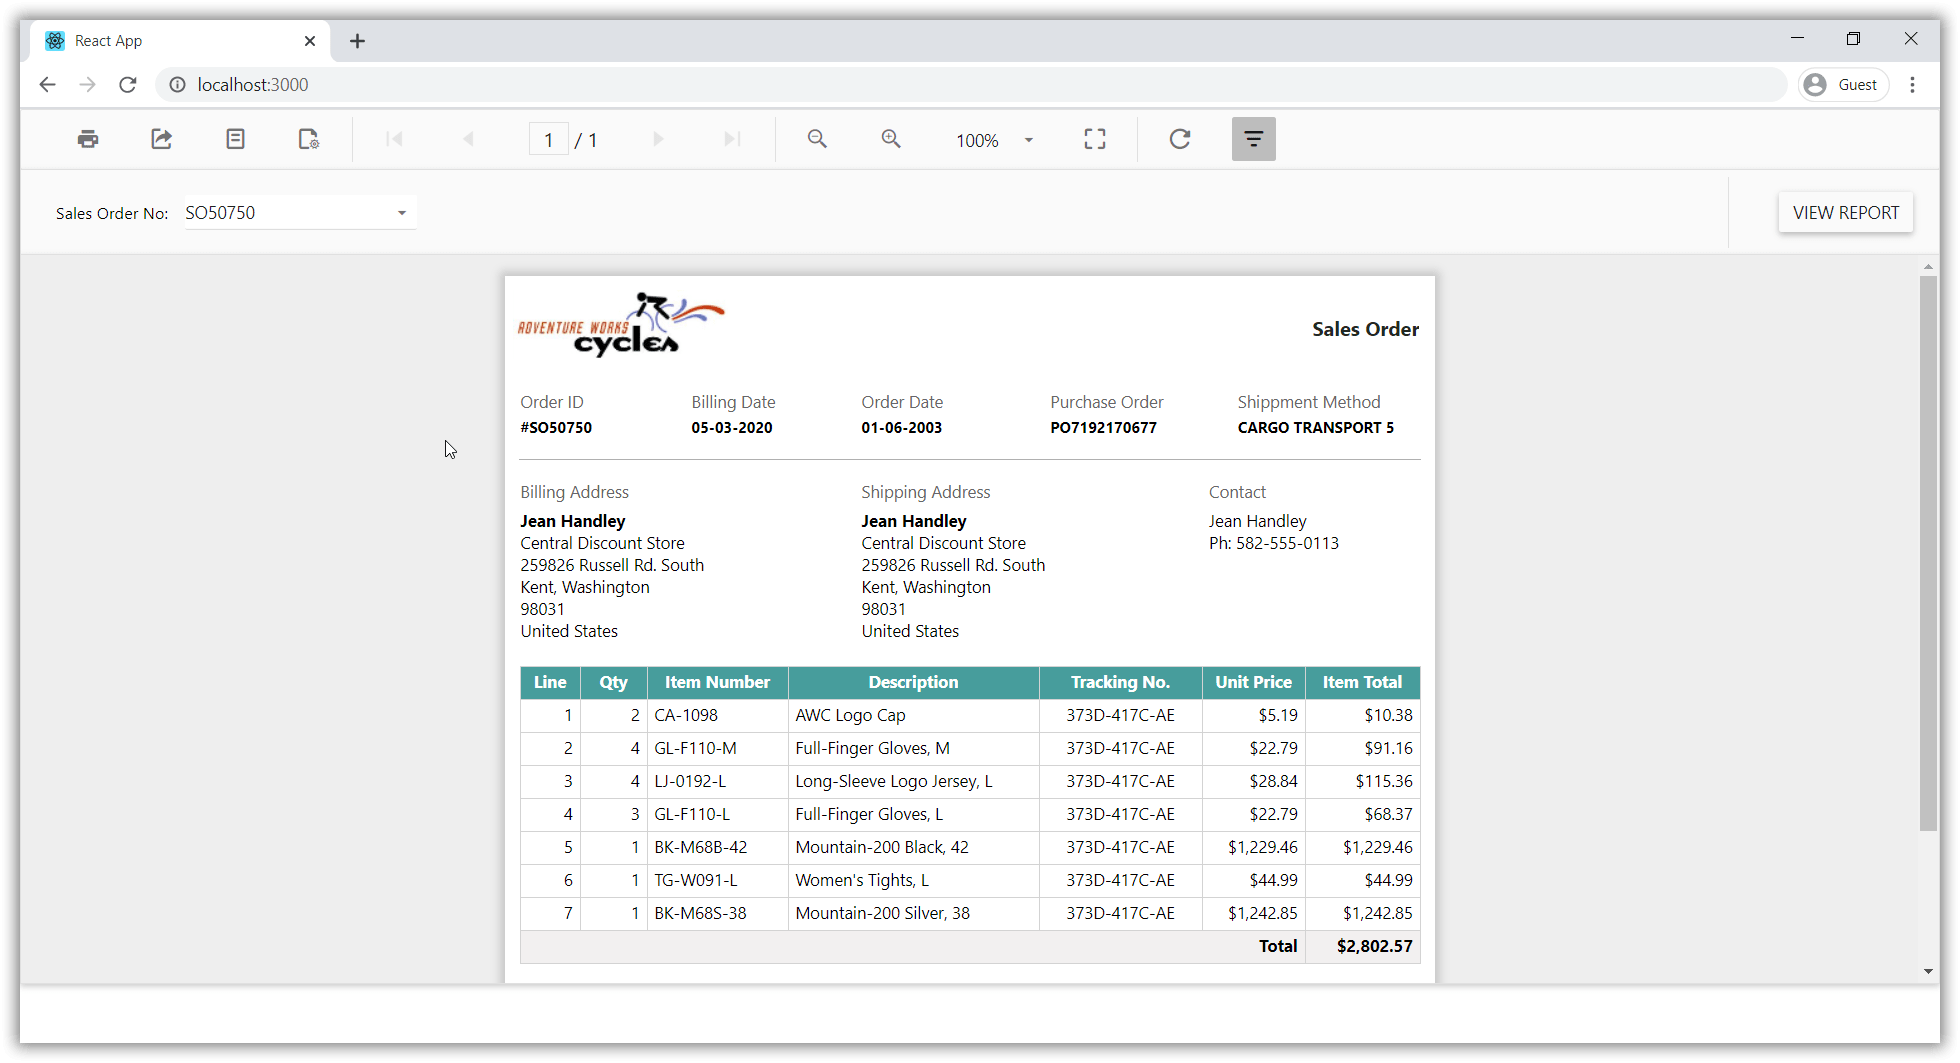
The npm run start command automatically opens your browser to http://localhost:3000/.
Deploying the application in production
To deploy the application in production, run the following command in the command prompt, which will create a folder named build to generate the build files.
npm run buildNote: You can refer to our feature tour page for the React Report Viewer to see its innovative features. Additionally, you can view our React Report Viewer examples which demonstrate the rendering of SSRS RDLC and RDL reports.