How to configure custom map shapes
This section explains the steps required to configure custom map shapes in Web Report Designer javascript application.
Create report designer javascript application
Refer Getting Started and create a Report Designer javascript application.
Place custom shape data file in application root location
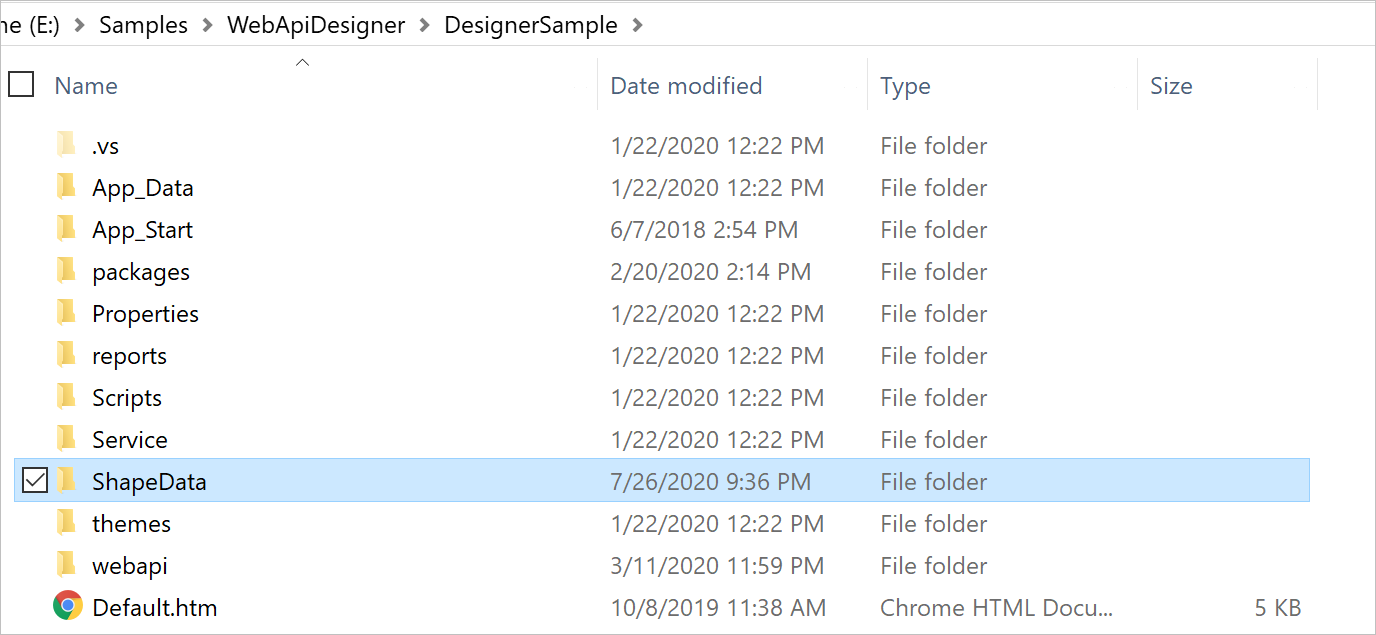
In the root folder of your application, create a new folder. For example, ShapeData.
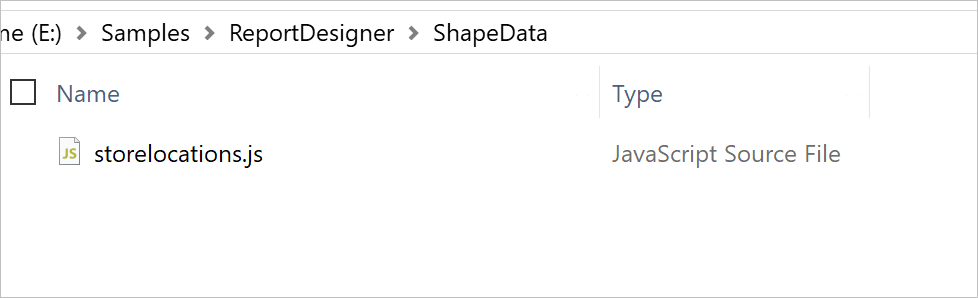
Copy your shape data file and paste it in the ShapeData folder. For example, storelocations.js.
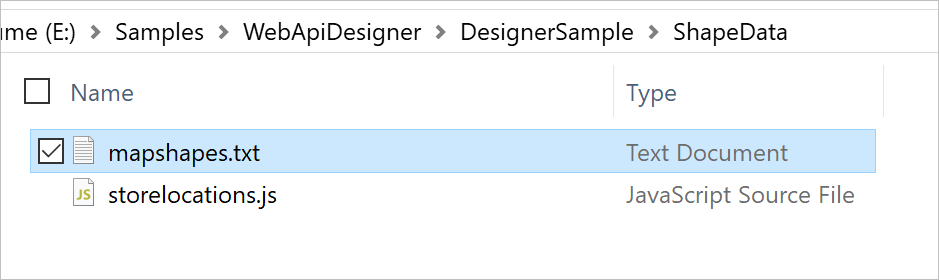
Create a text file inside ShapeData folder. For example, mapshapes.txt.
Once you create the mapshapes.txt file, open it and add your file name and display name as shown below and save the file,
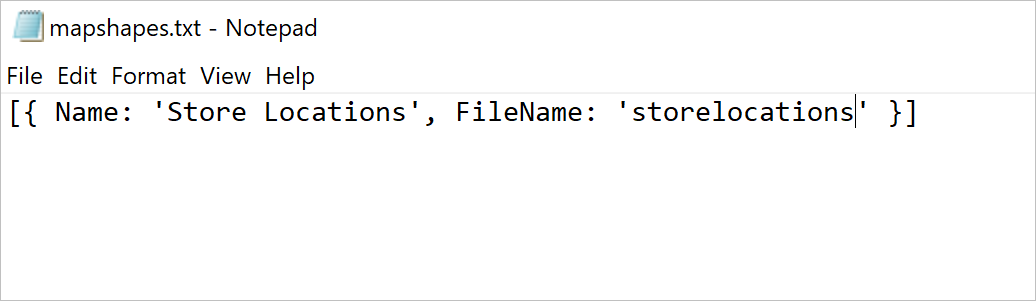
[{ Name: 'Store Locations', FileName: 'storelocations' }]Load map shape data in application startup
-
Open the code-behind file
Global.asax.csand add the following using statement.using BoldReports.Web; using Newtonsoft.Json; -
Then add the the following code to load shape data.
    protected void Application_Start(object sender, EventArgs e)
    {
        System.Web.Http.GlobalConfiguration.Configuration.Routes.MapHttpRoute(
        name: "DefaultApi",
        routeTemplate: "api/{controller}/{action}/{id}",
        defaults: new { id = RouteParameter.Optional });

        AppDomain.CurrentDomain.SetData("SQLServerCompactEditionUnderWebHosting", true);
        //Use the below code to load map shape data into report designer
        ReportConfig.DefaultSettings = new ReportSettings()
        {
            MapSetting = this.GetMapSettings()
        }
    }

    private BoldReports.Web.MapSetting GetMapSettings()
    {
        var shapePath = "\\ShapeData\\";
        try
        {
            return new MapSetting()
            {
                ShapePath = AppDomain.CurrentDomain.BaseDirectory + shapePath,
                MapShapes = JsonConvert.DeserializeObject<List<MapShape>>(System.IO.File.ReadAllText(AppDomain.CurrentDomain.BaseDirectory + shapePath + "\\mapshapes.txt"))
            };
        }
        catch (Exception ex)
        {
           // Implement to catch exception
        }
        return null;
    }
Visualize shape data on map
- Launch the application.
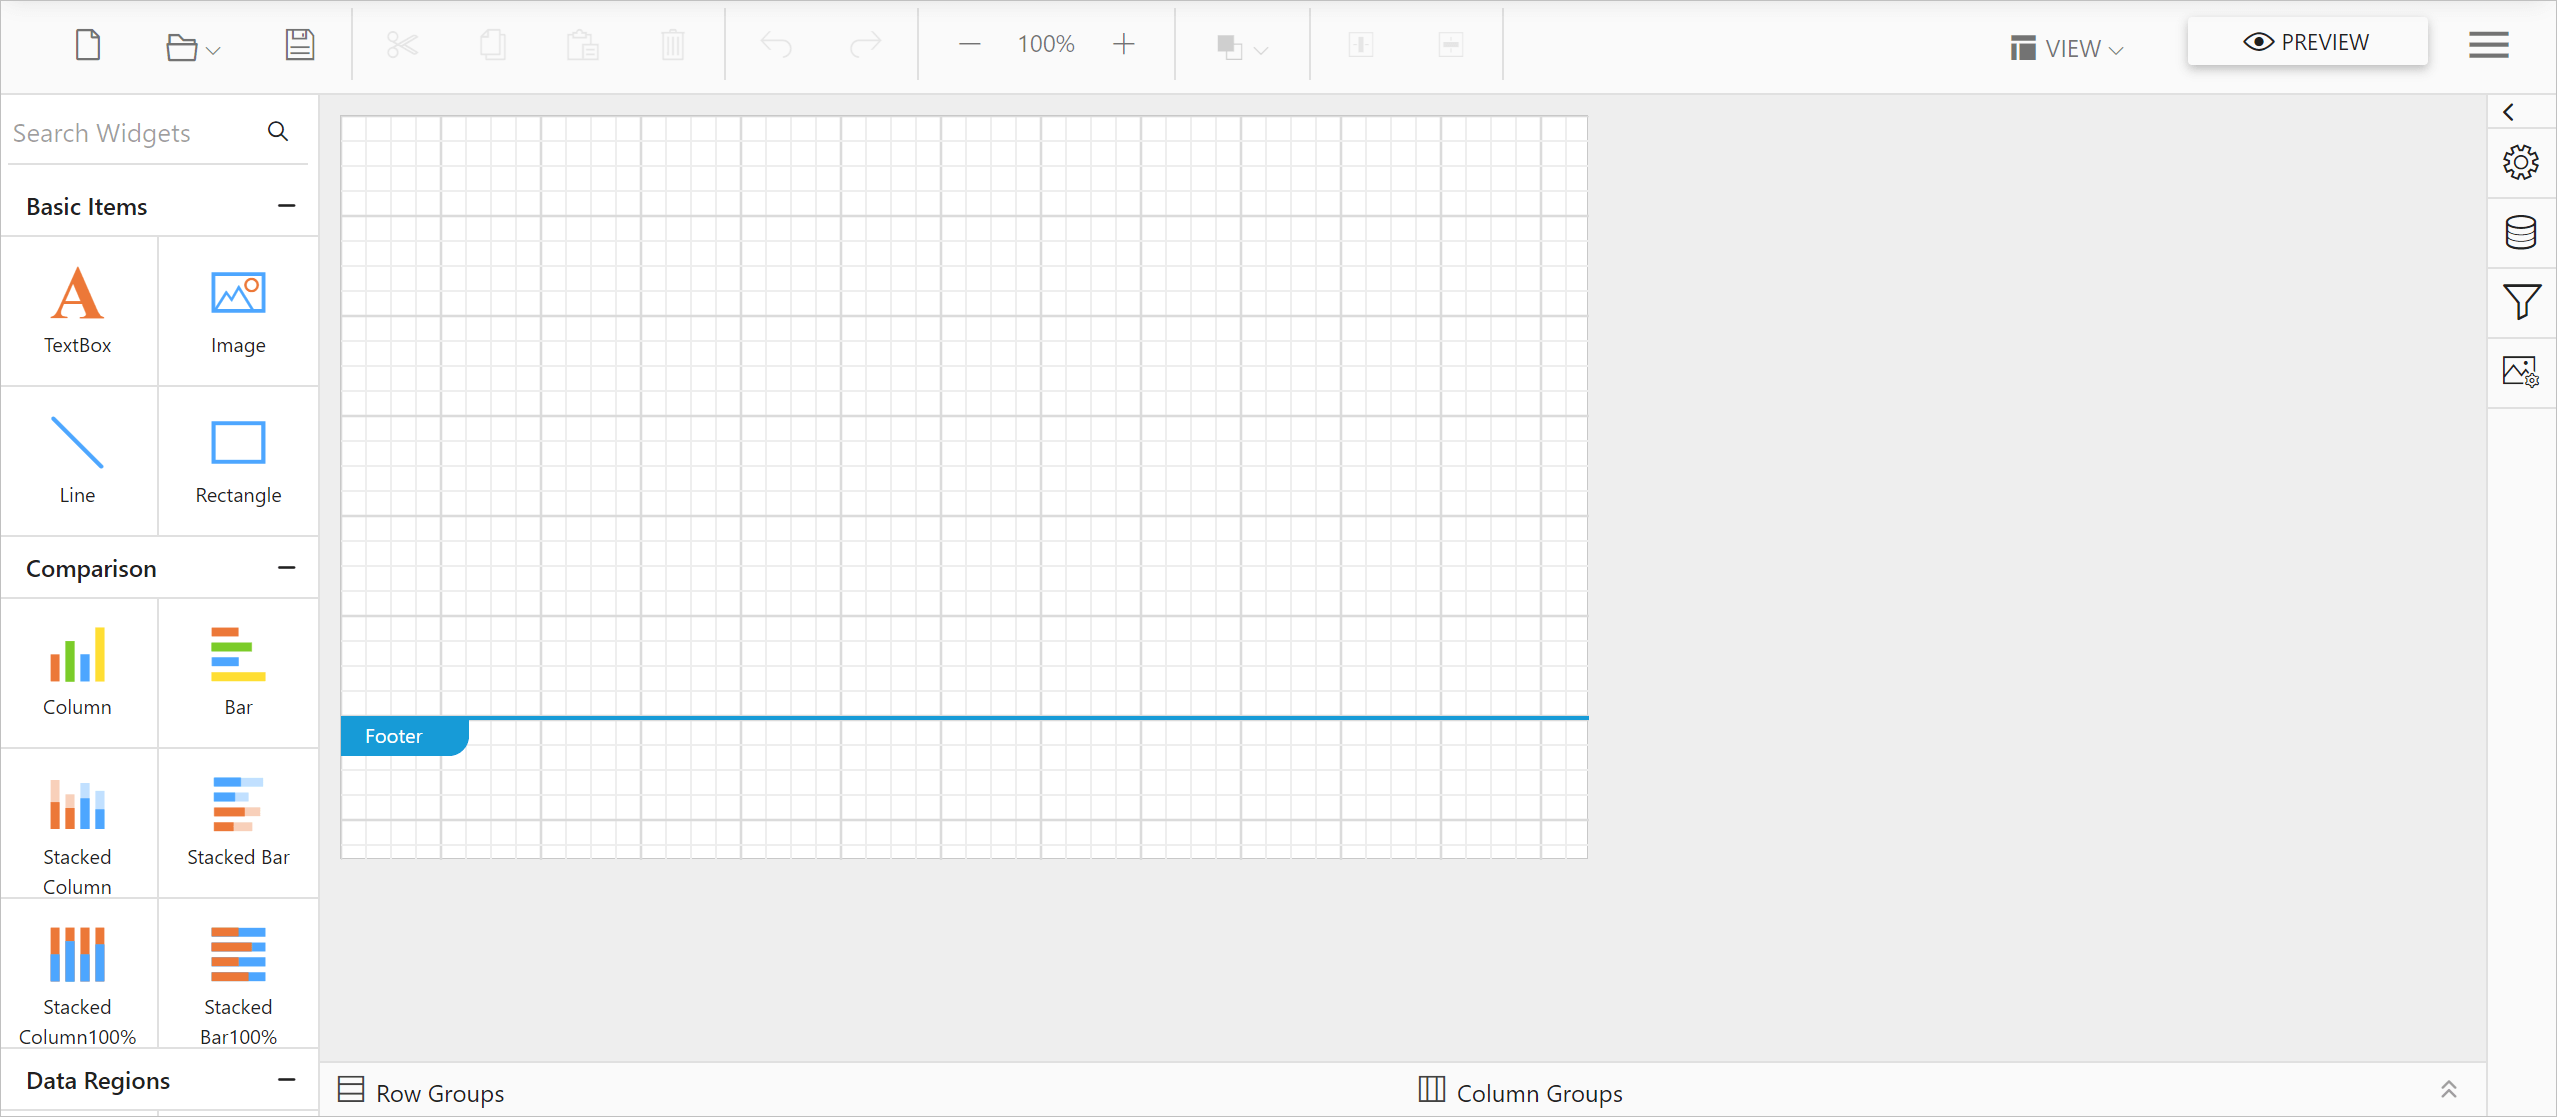
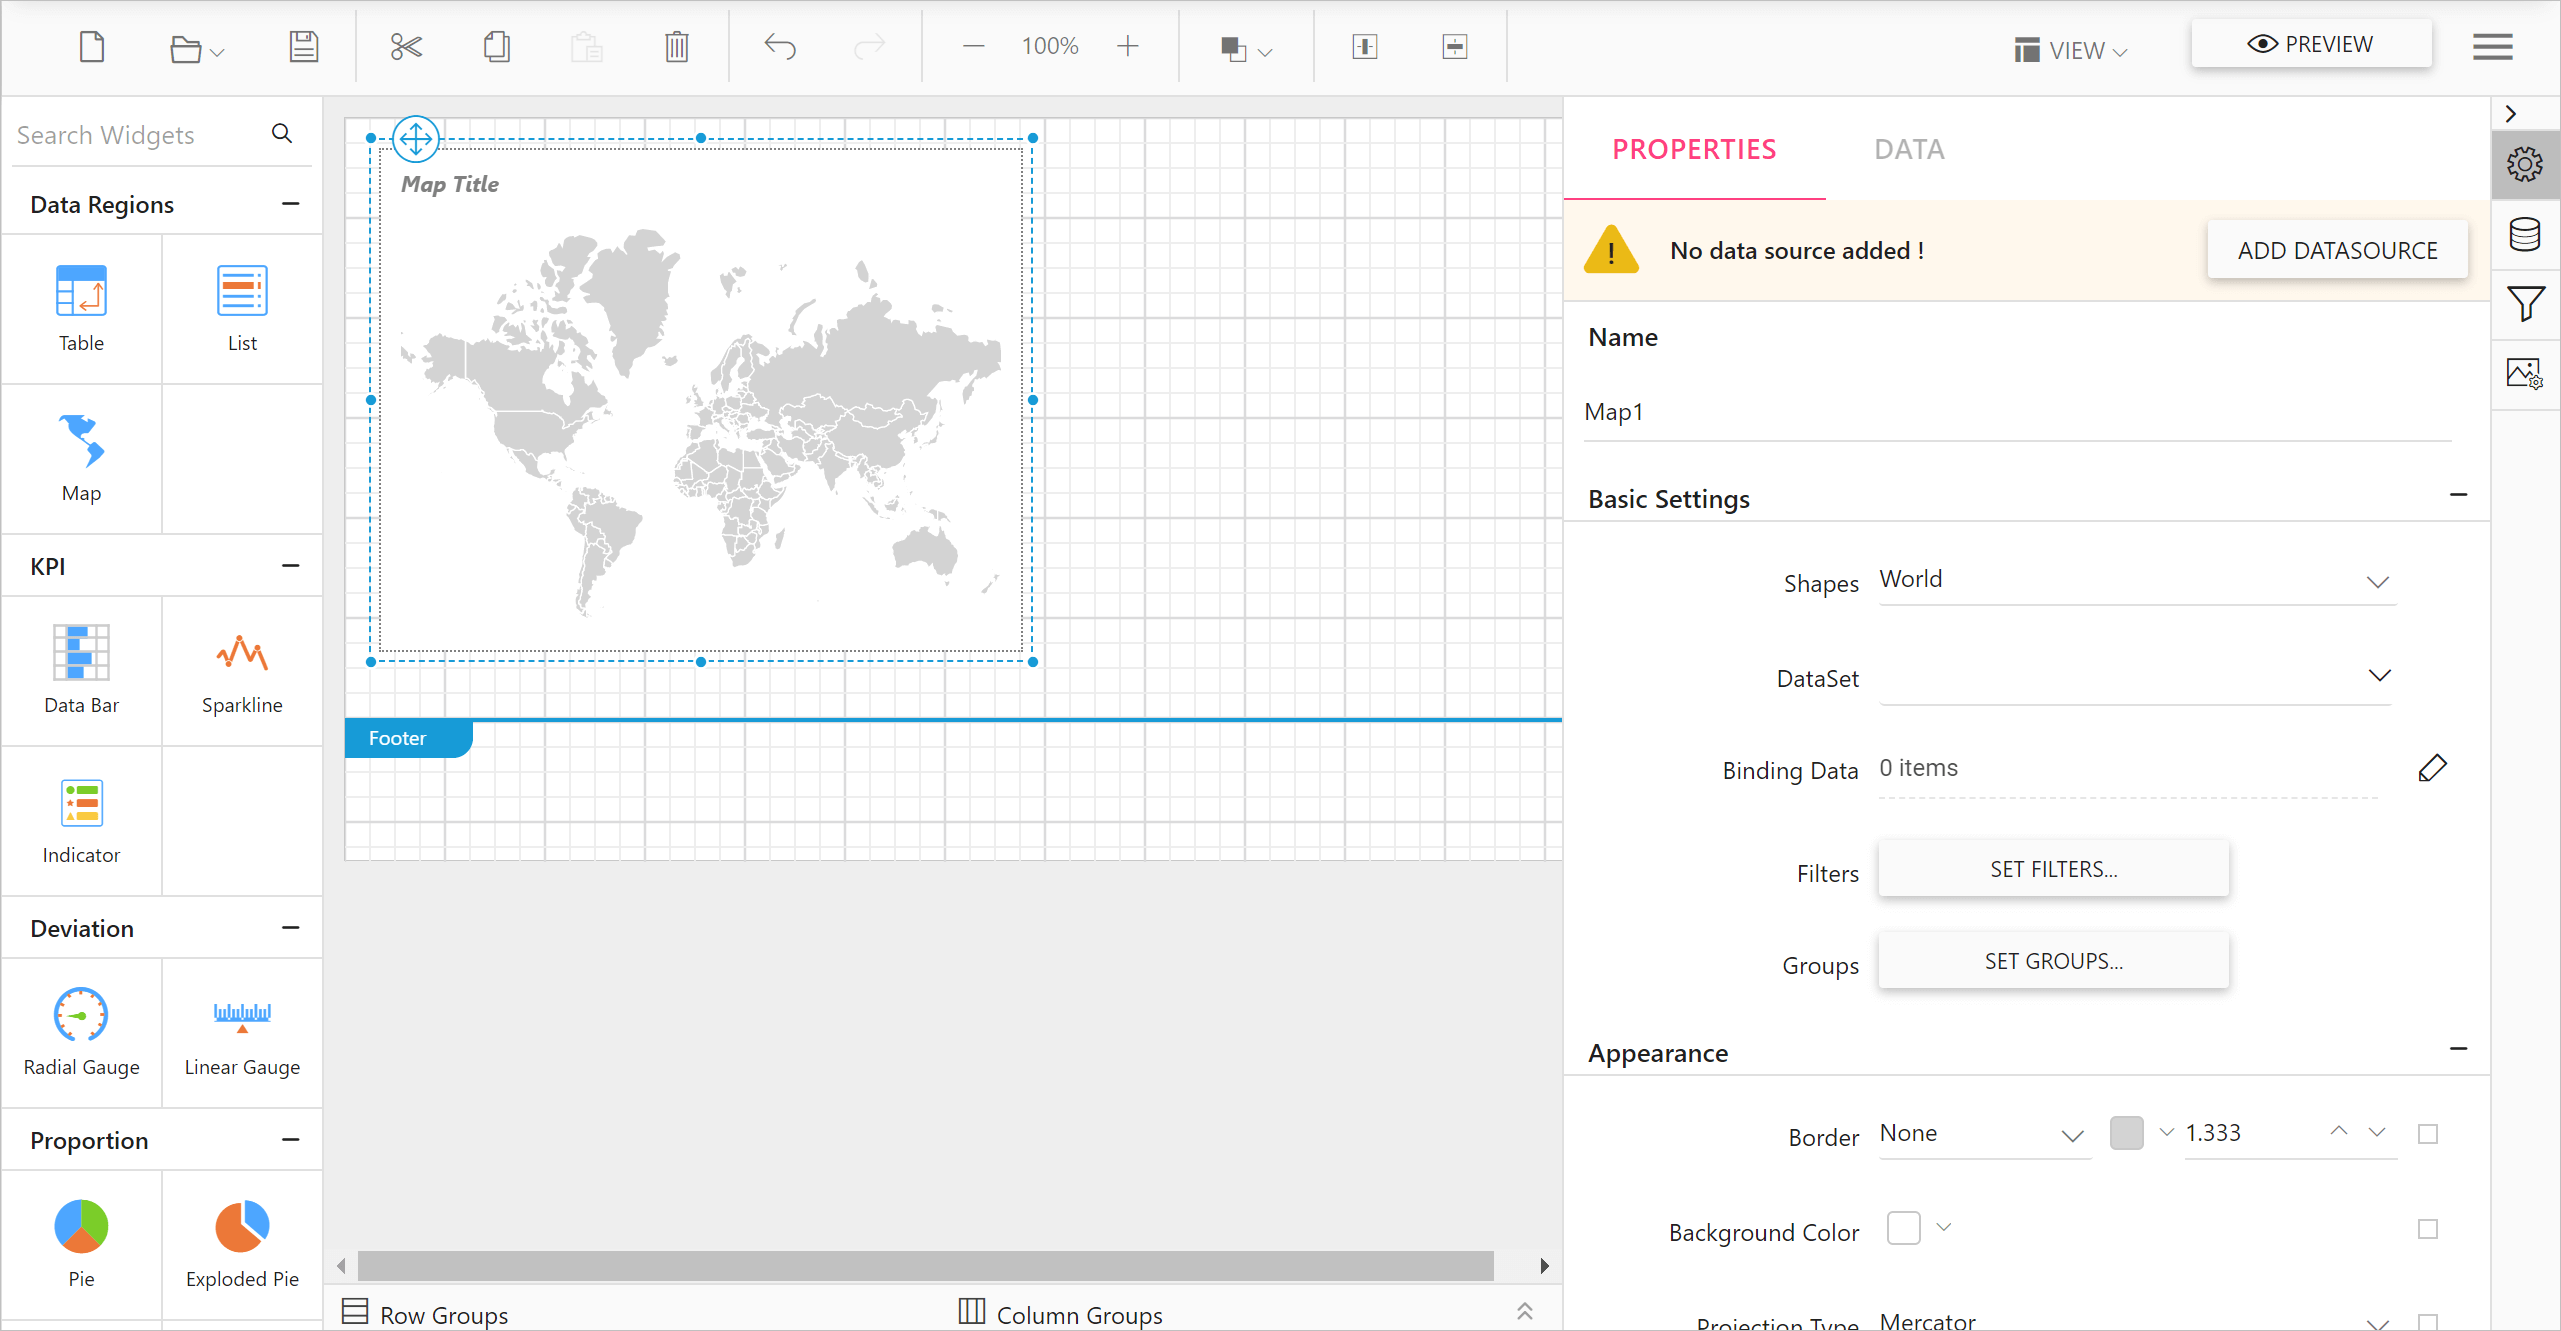
- Drag a map into design area from item panel.
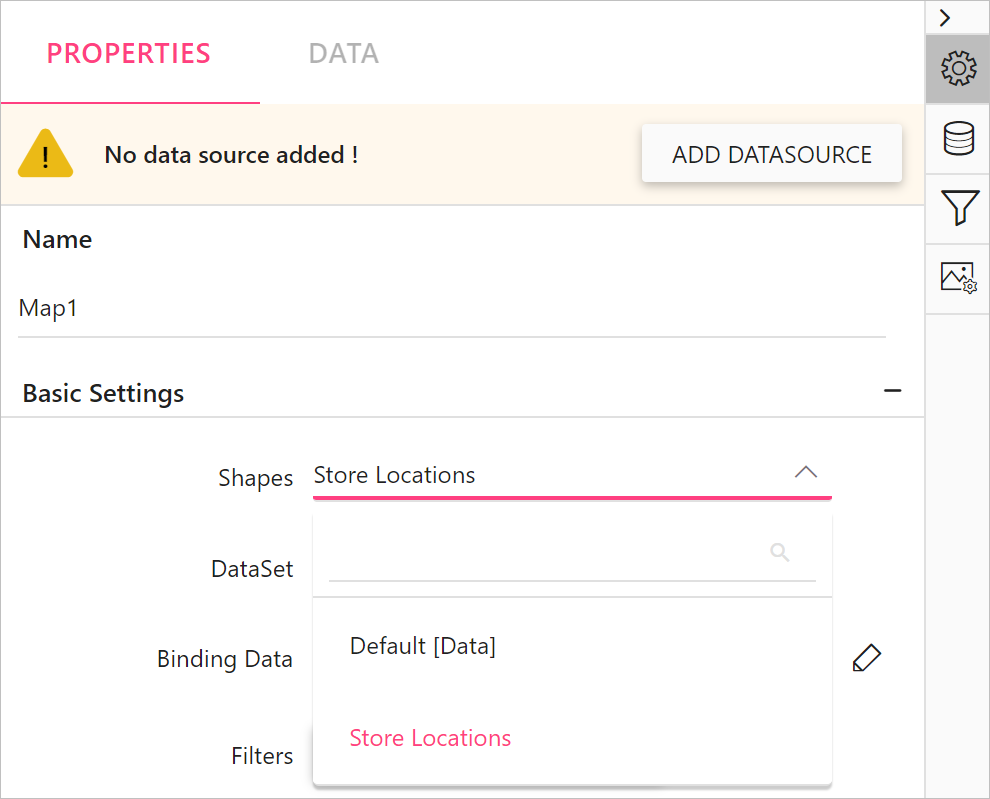
- The newly added shape data entry will be listed in the Shapes property drop-down under Basic Settings category.
Refer Design a rdl report using map section to visualize shape data and analytical data using map report item.