Create SSRS drill through report
Drill through can be used to create an interactive report which allows user to open an report by clicking the link within the main report.
Create data
To present data in the table, create a dataset and bind data to the table data region. In this designing section, the following dataset query is used for dataset creation.
SELECT PC.Name AS ProdCat, PS.Name AS SubCat, DATEPART(yy, SOH.OrderDate) AS OrderYear, 'Q' + DATENAME(qq, SOH.OrderDate) AS OrderQtr,SUM(SOD.UnitPrice * SOD.OrderQty) AS Sales
FROM Production.ProductSubcategory PS INNER JOIN
Sales.SalesOrderHeader SOH INNER JOIN
Sales.SalesOrderDetail SOD ON SOH.SalesOrderID = SOD.SalesOrderID INNER JOIN
Production.Product P ON SOD.ProductID = P.ProductID ON PS.ProductSubcategoryID = P.ProductSubcategoryID INNER JOIN
Production.ProductCategory PC ON PS.ProductCategoryID = PC.ProductCategoryID
WHERE (SOH.OrderDate BETWEEN '1/1/2002' AND '12/31/2003')
GROUP BY DATEPART(yy, SOH.OrderDate), PC.Name, PS.Name, 'Q' + DATENAME(qq, SOH.OrderDate), PS.ProductSubcategoryID
Refer Create Data section and create dataset using the above query.
AdventuresWorksdatabase is used here.
Design drill through report
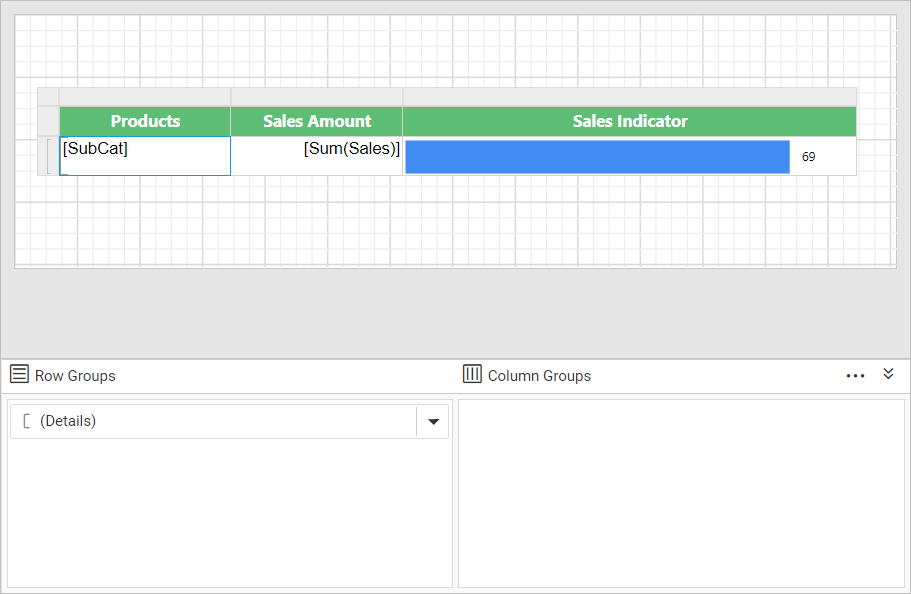
Design the drill through report, before configuring the drill through action in the main report. Refer the Data bar report section and the report design will look like below.
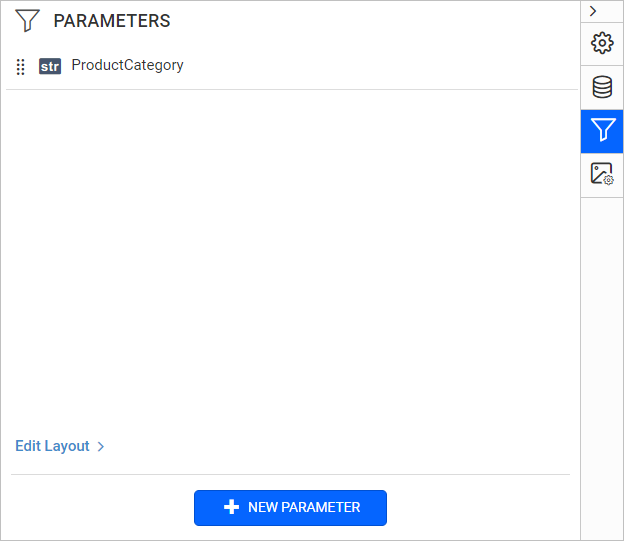
Now, define a basic parameter and name it as Product Category.
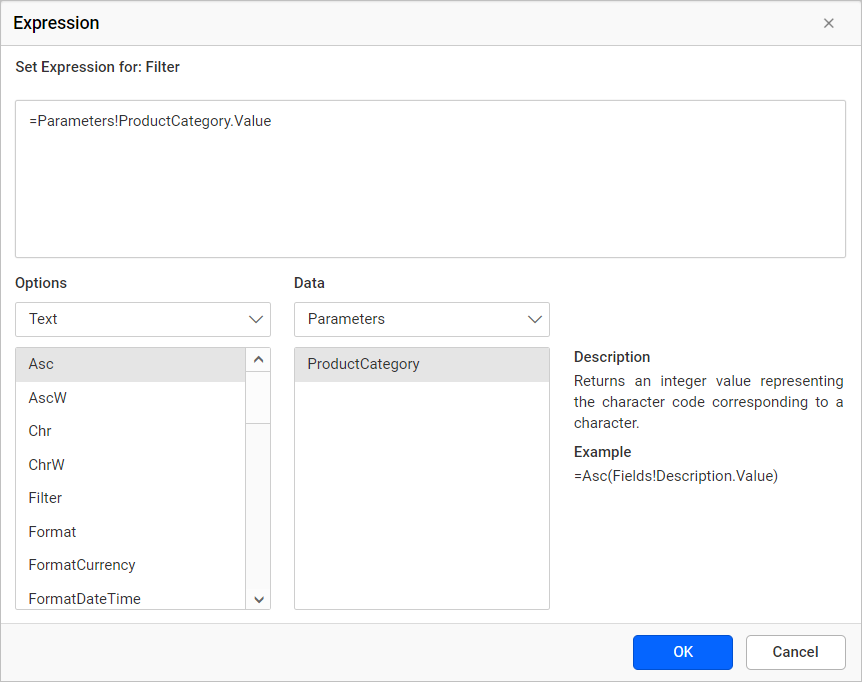
Then apply filter condition on the dataset to filter product category and its sub categories at dataset level.
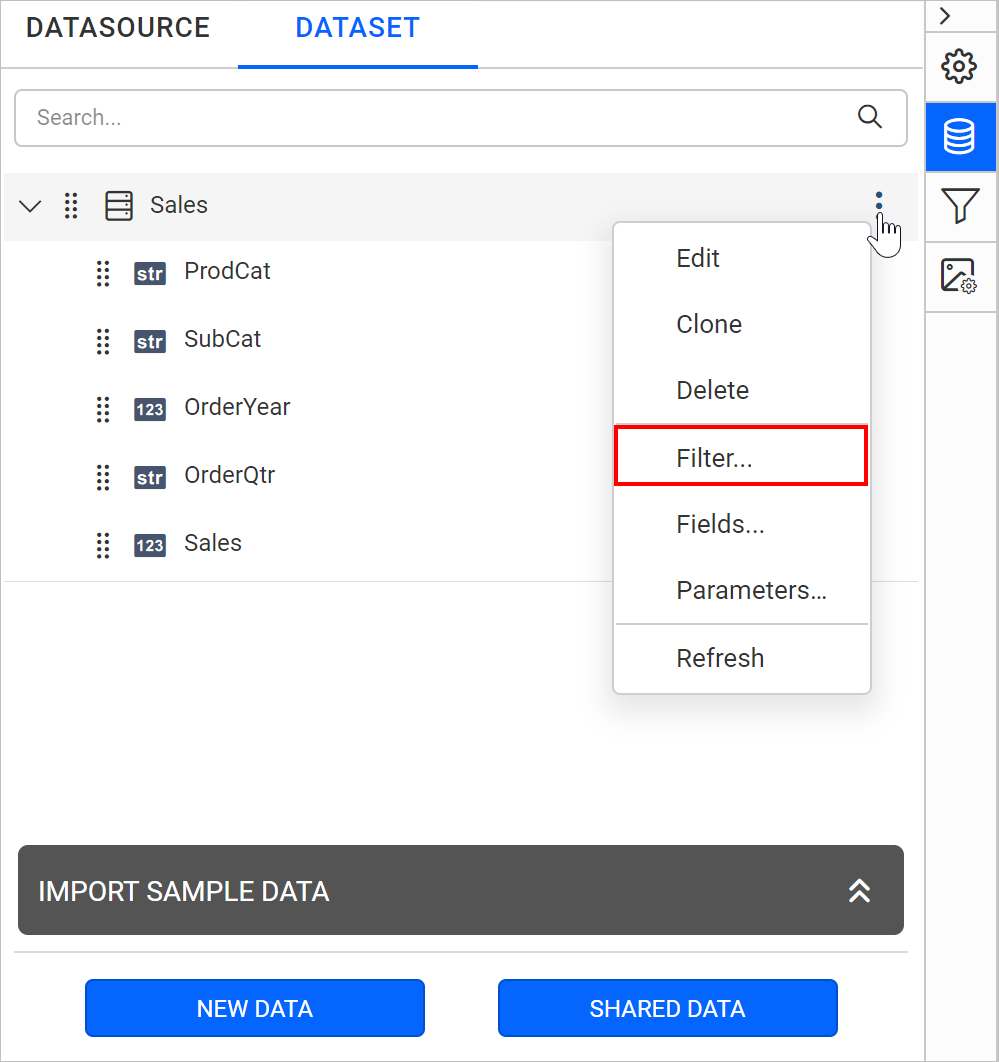
Add a filter and choose Prodcat field.
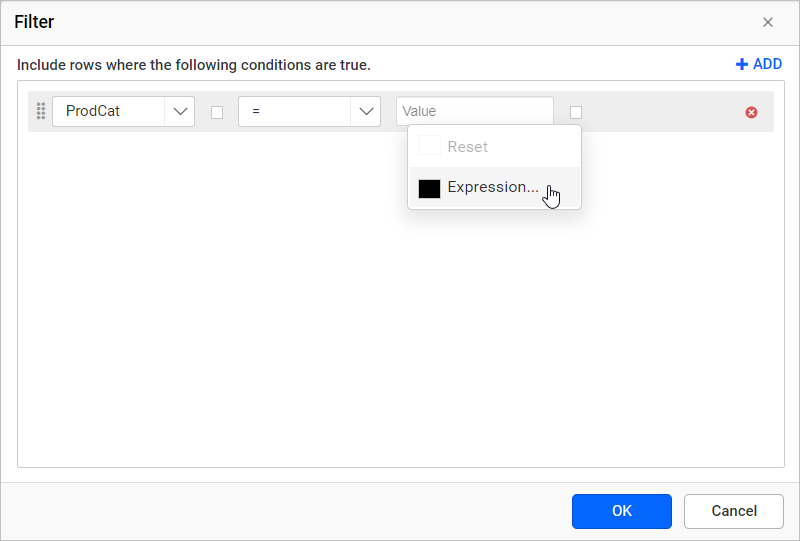
Assign a Product Category parameter as expression in the value field and click OK.
Refer Dataset Filters section to apply filters at dataset level.
Add drill through action to a chart
Now, design a main report and link the drill through report using Link property. Here, we are going to configure the drill through action for chart series.
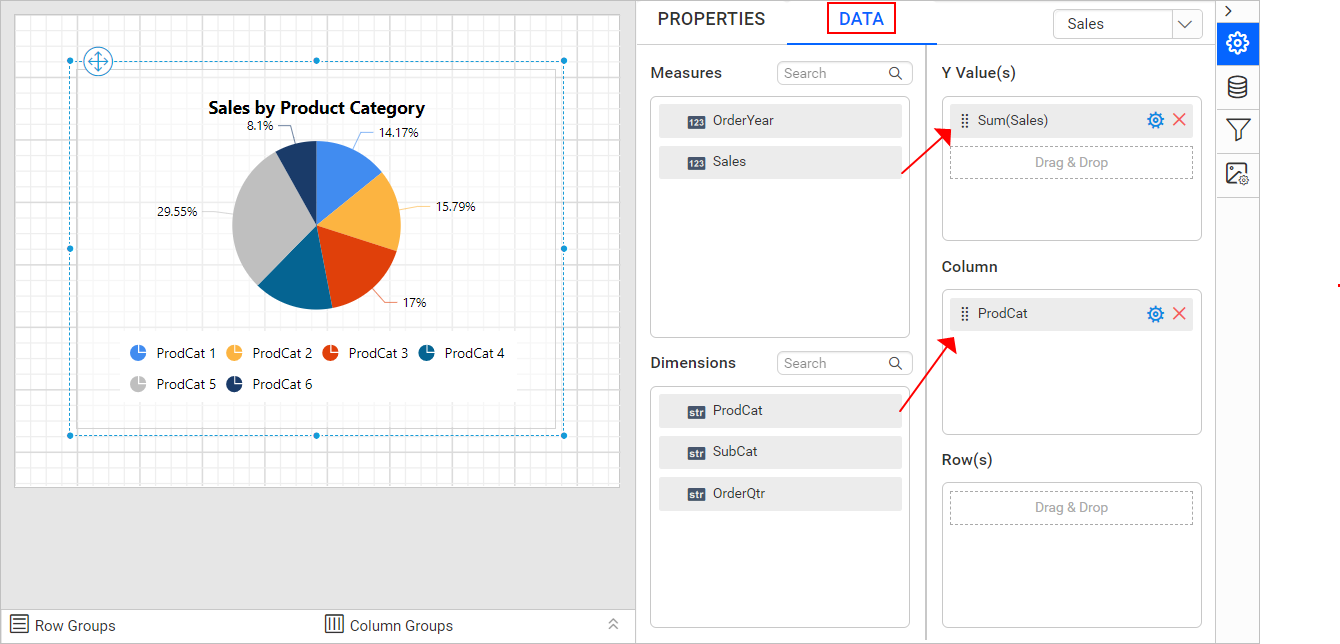
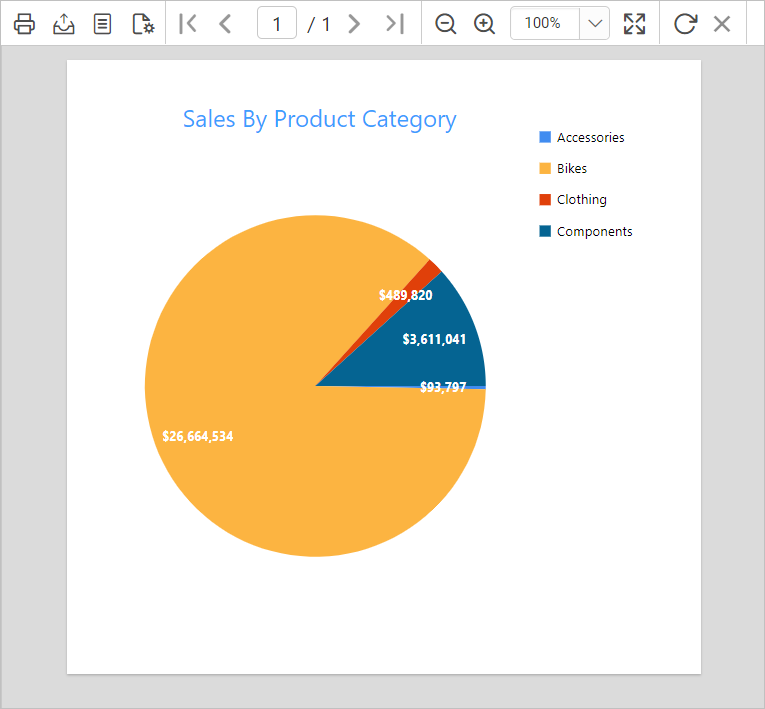
Refer the Pie chart section and design the report like below.
-
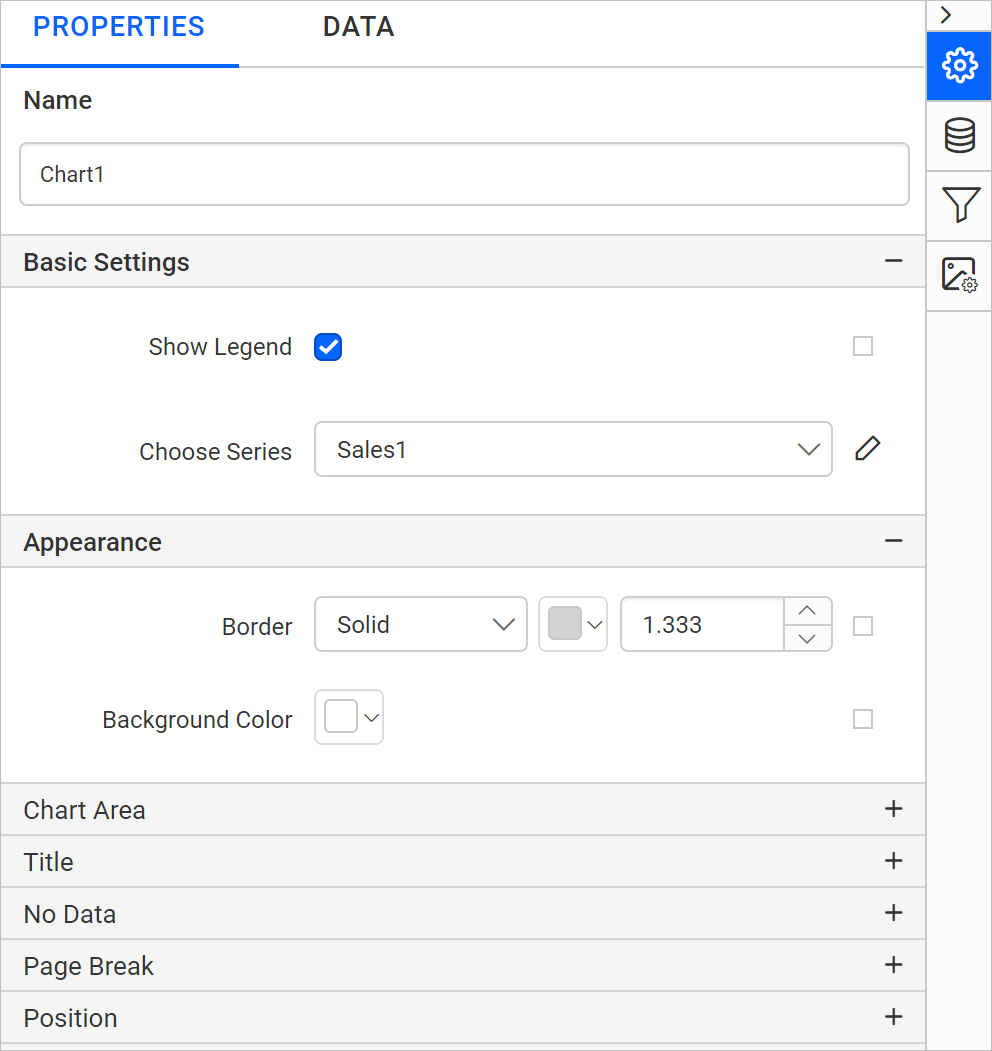
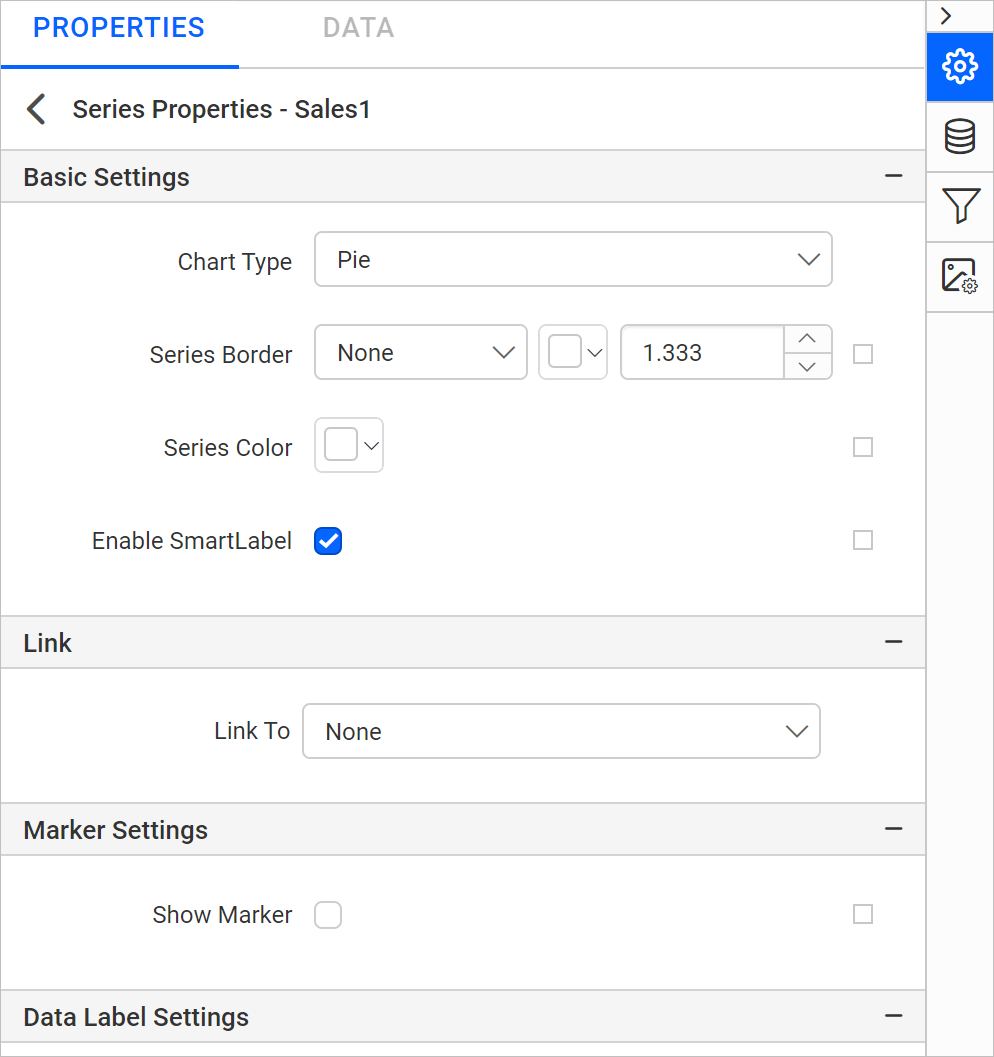
Open the chart properties,
-
Choose
Sales1series in choose series dropdown and clickediticon.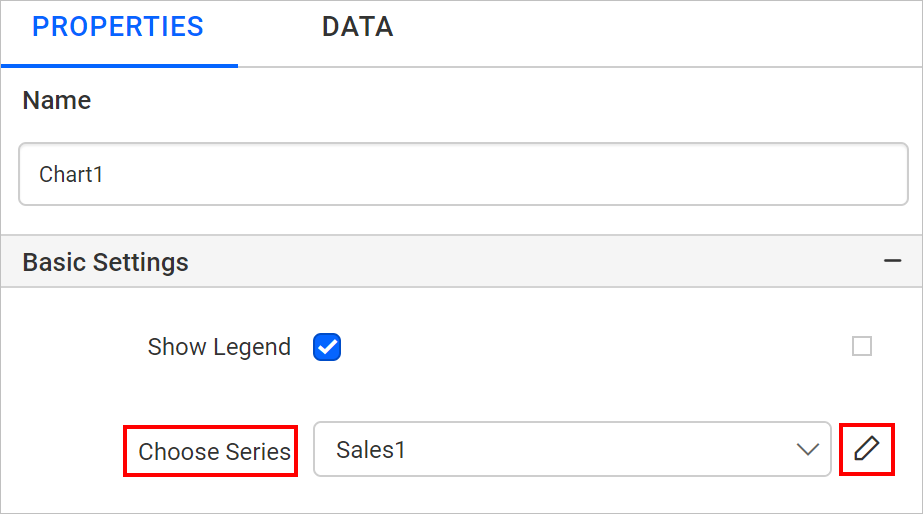
-
The respective series properties will be listed in secondary panel.
-
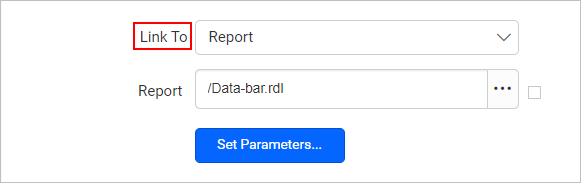
Under
Linkcategory, chooseReportoption inLink Toproperty.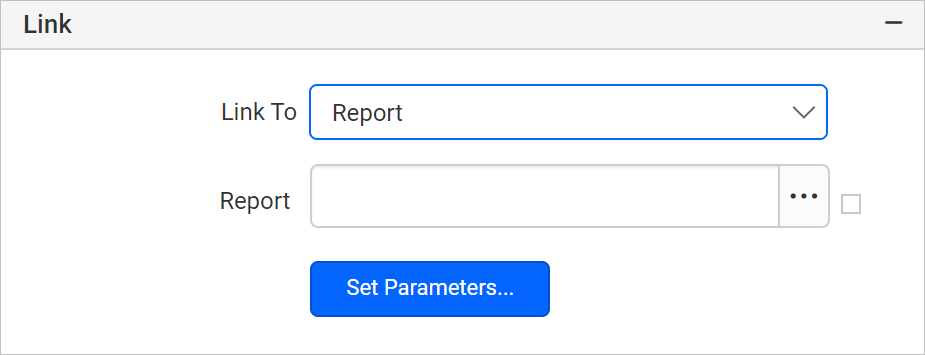
-
In the
Reportfield, browse and set the path of already designed data bar report.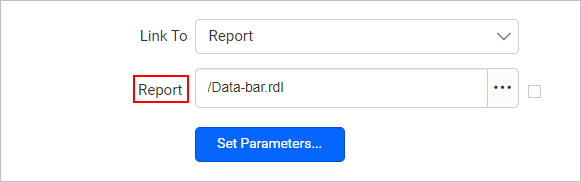
-
Click on
Set Parametersbutton. Now, the parameters dialog will open like below.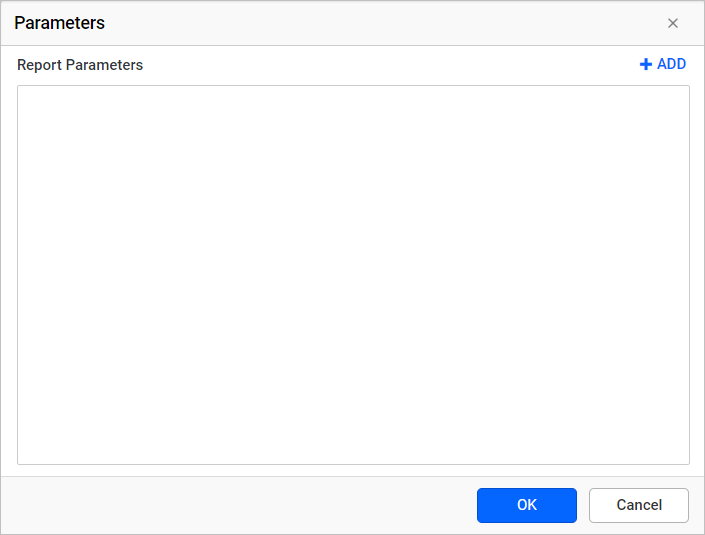
-
Click on
ADDoption in the dialog to configure parameter values.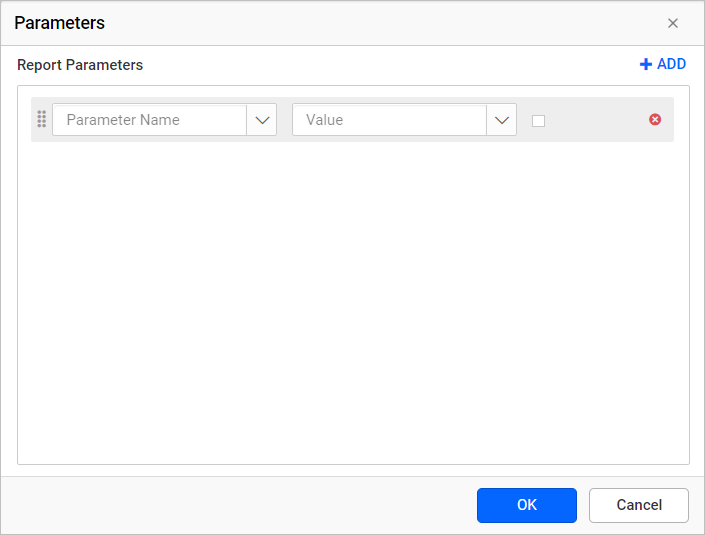
-
In the
Parameter Namefield, select the parameter name of the selected report.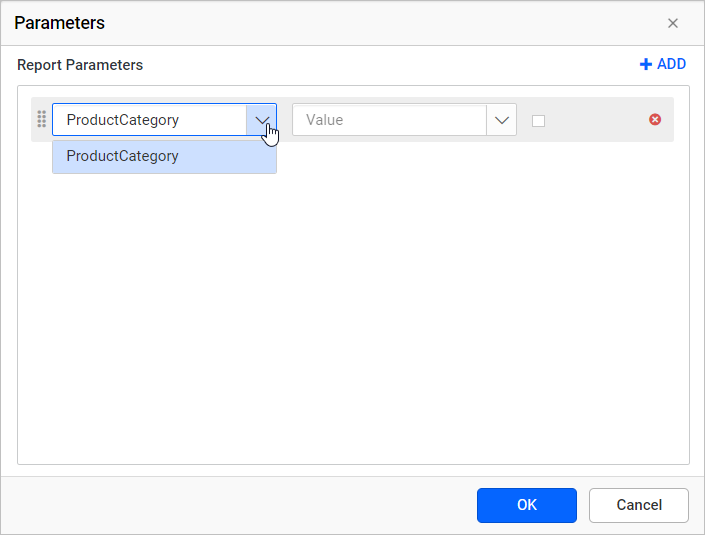
-
Provide the
=Fields!ProdCat.Valueexpression value inParameter Valuefield and clickOK.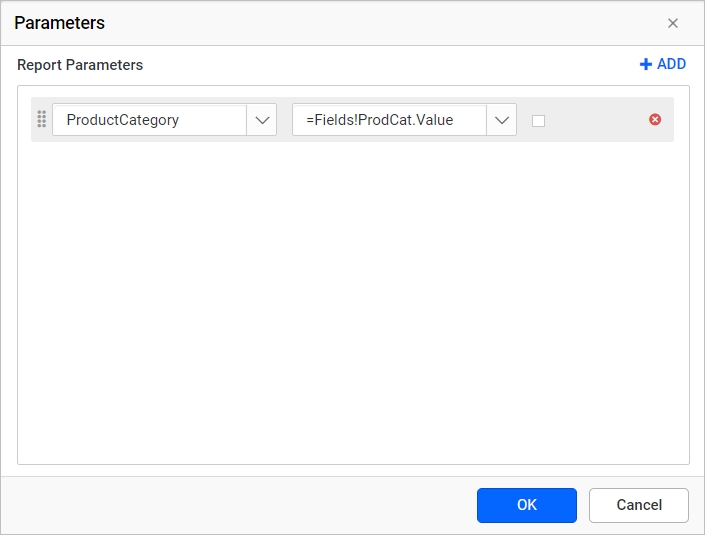
Refer Link Report section to know more about report linking.
Drill through chart series
Now, click on the Preview button and the report preview will look like normal pie chart.
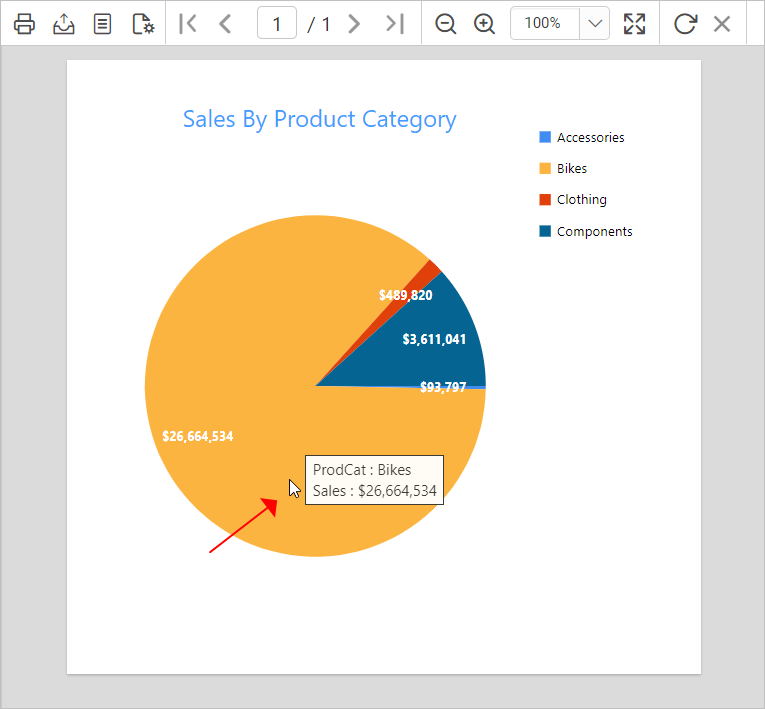
Then click on any series in the report preview,
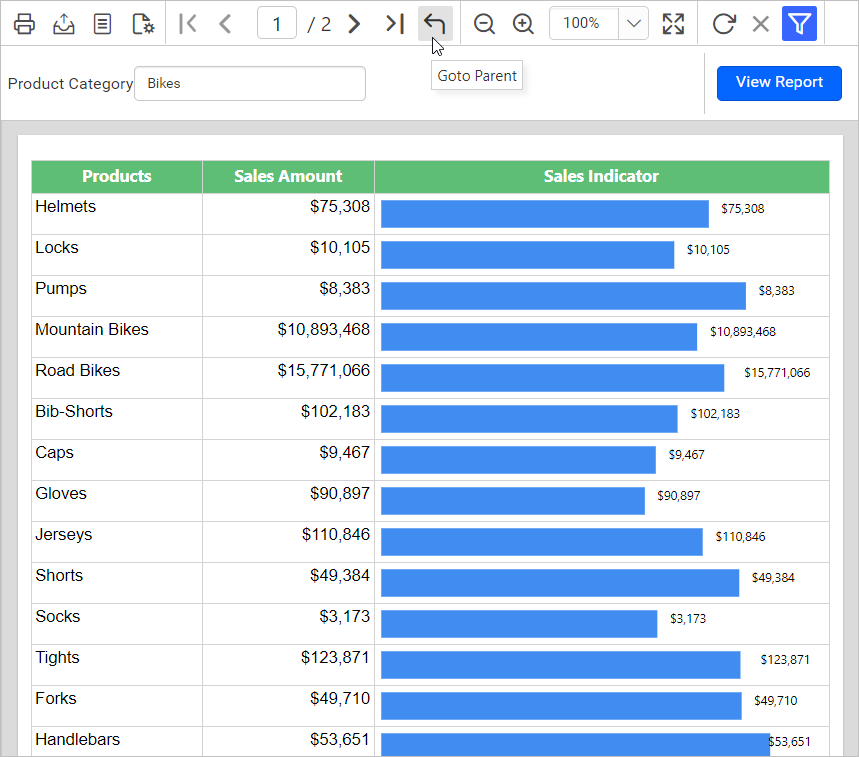
The sub-report displays sub-category wise sales amount of Bikes product. Click on the Go to parent icon to navigate from sub-report to main report.
Download the above report design from the links - Parent report and Child report