Design ssrs data bar report using table
This section describes the steps to design Data bar report using SSRS table report item.
Create dataset
The following dataset query is used for this Data bar report.
SELECT PC.Name AS ProdCat, PS.Name AS SubCat, DATEPART(yy, SOH.OrderDate) AS OrderYear, 'Q' + DATENAME(qq, SOH.OrderDate) AS OrderQtr,SUM(SOD.UnitPrice * SOD.OrderQty) AS Sales
FROM Production.ProductSubcategory PS INNER JOIN
Sales.SalesOrderHeader SOH INNER JOIN
Sales.SalesOrderDetail SOD ON SOH.SalesOrderID = SOD.SalesOrderID INNER JOIN
Production.Product P ON SOD.ProductID = P.ProductID ON PS.ProductSubcategoryID = P.ProductSubcategoryID INNER JOIN
Production.ProductCategory PC ON PS.ProductCategoryID = PC.ProductCategoryID
GROUP BY DATEPART(yy, SOH.OrderDate), PC.Name, PS.Name, 'Q' + DATENAME(qq, SOH.OrderDate), PS.ProductSubcategoryID
Refer Create Data section and create dataset using the above query.
AdventuresWorksdatabase is used here.
Add data bar report item
-
Drag and drop table report item to the design area.
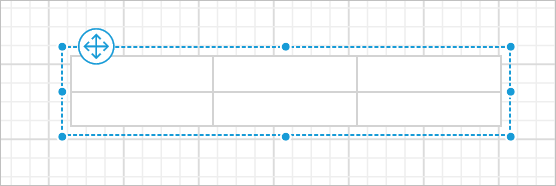
-
Assign dataset to the table.
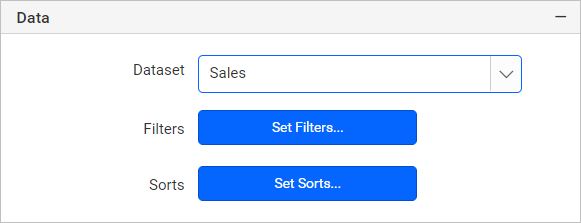
-
Design a simple table design with two columns like below.
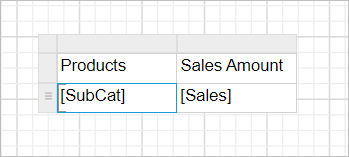
-
Click on
Details groupinRow Groupspane, now the respective tablix member properties will be listed in the properties panel.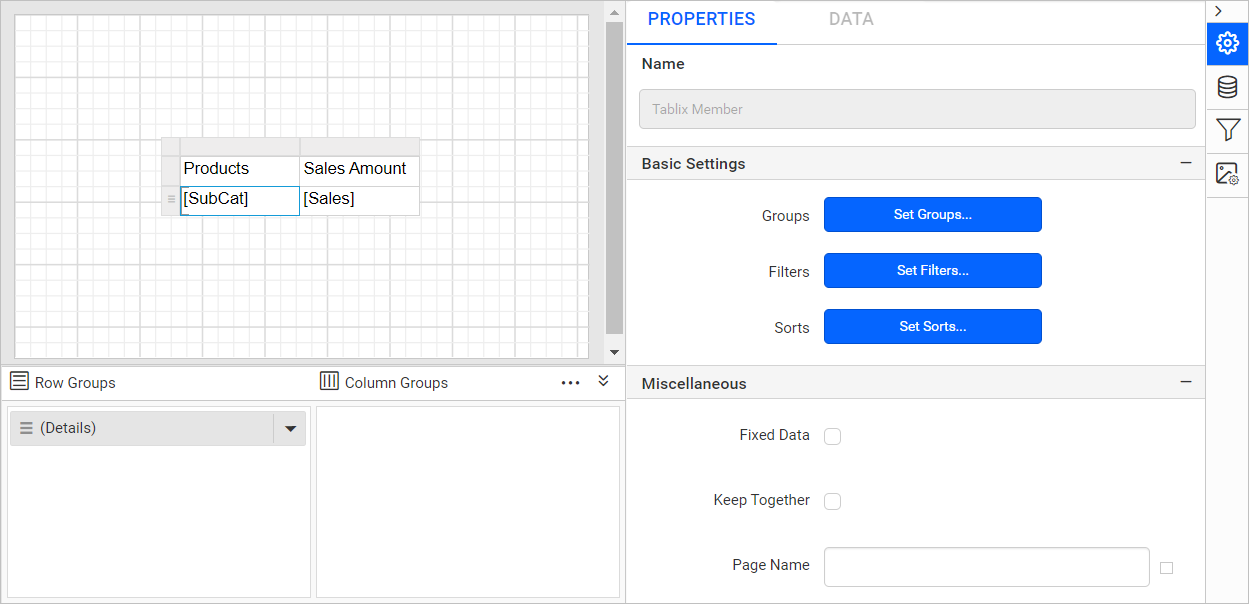
-
Click on the
Set Groups...button in the properties panel. Now, theGroupingdialog will be opened like below.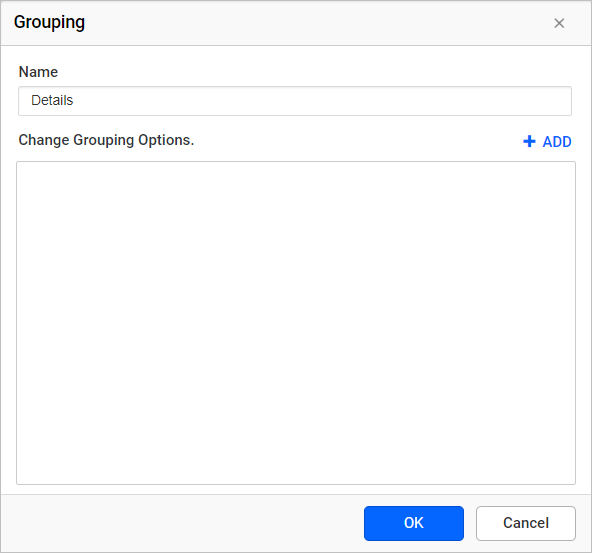
-
Click on
Addbutton and selectSubCatand click OK.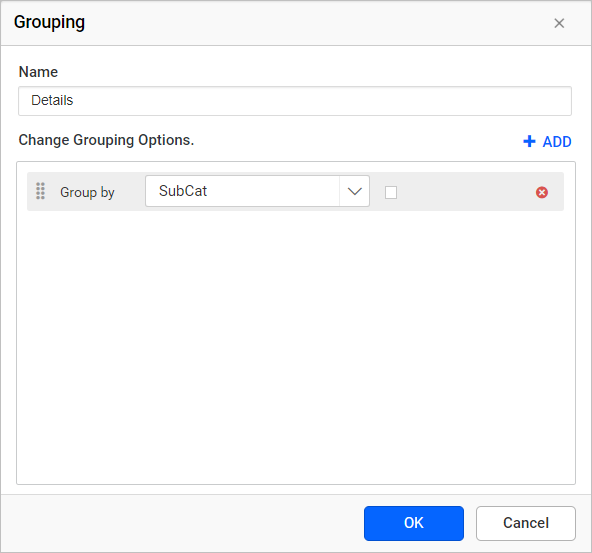
-
Now select the
Salestext box and assign the following expression=Sum(Fields!Sales.Value)in the cell.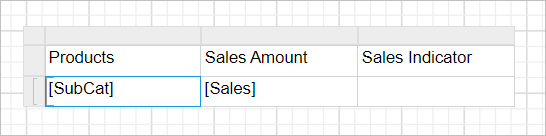
-
Format the numbers produced by the
Salesfield, usingFormatproperty. Set the'$'#,0;('$'#,0)as value format property field.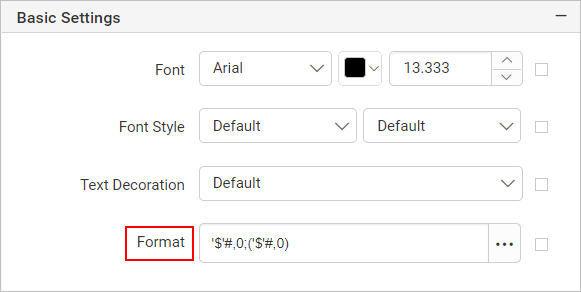
-
Add a column to the right and name it as
Sales Indicator.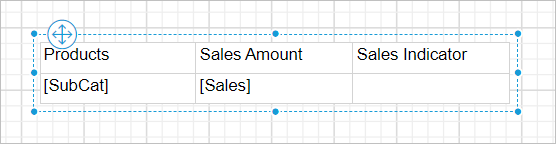
-
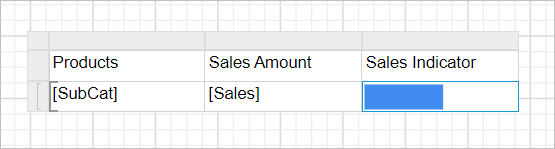
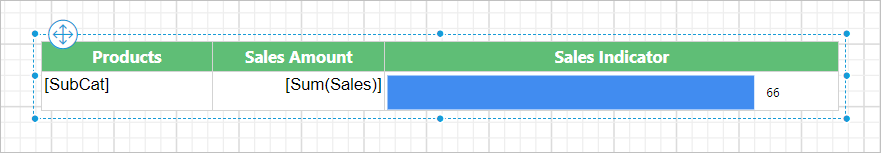
Drag and drop the data bar report item into last cell of the table.
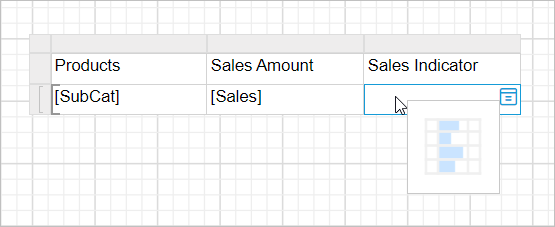
Now, the report design will look like below.
Cannot insert a data bar into a detail cell. Detail members can only contain the static inner members.
Assign data
- Select the cell containing data bar report item and switch to
DATAtab in properties panel.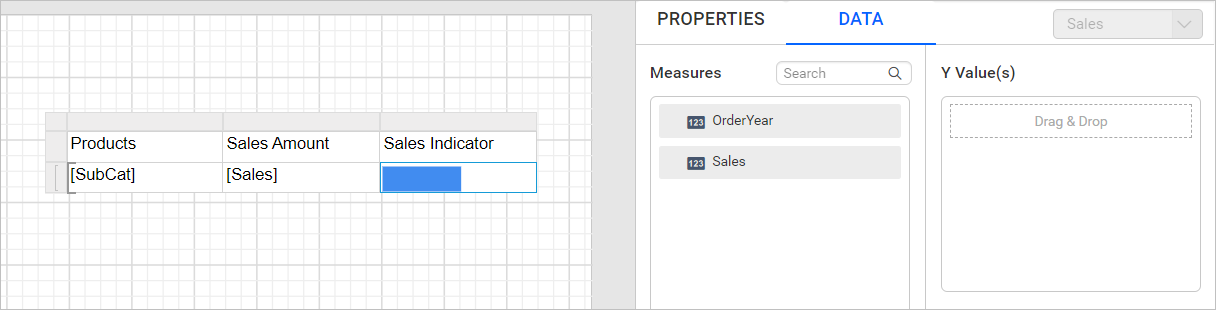
- Drag and drop
Salesfield intoY-Valuessection as shown below.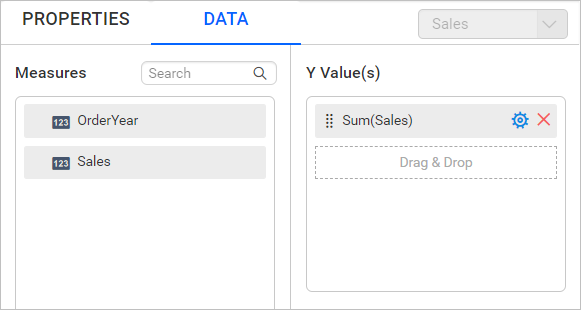
Configure properties
- Now, switch to the
PROPERTIEStab in the properties panel. - Choose the
Salesseries in theChoose Seriesdropdown.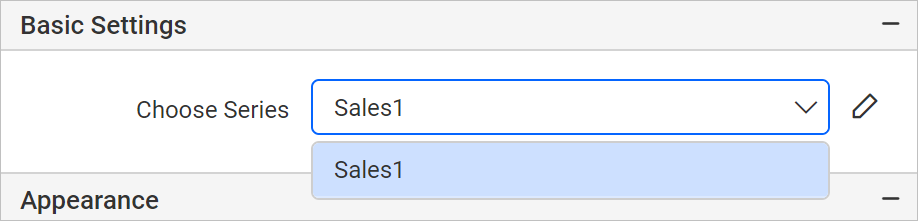
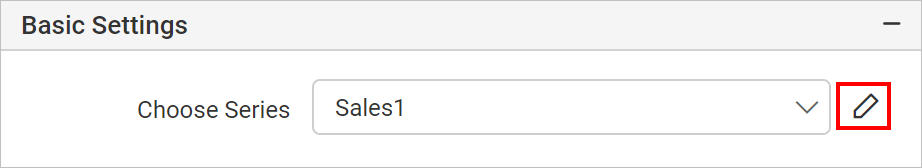
- Click on the edit icon to open series properties.
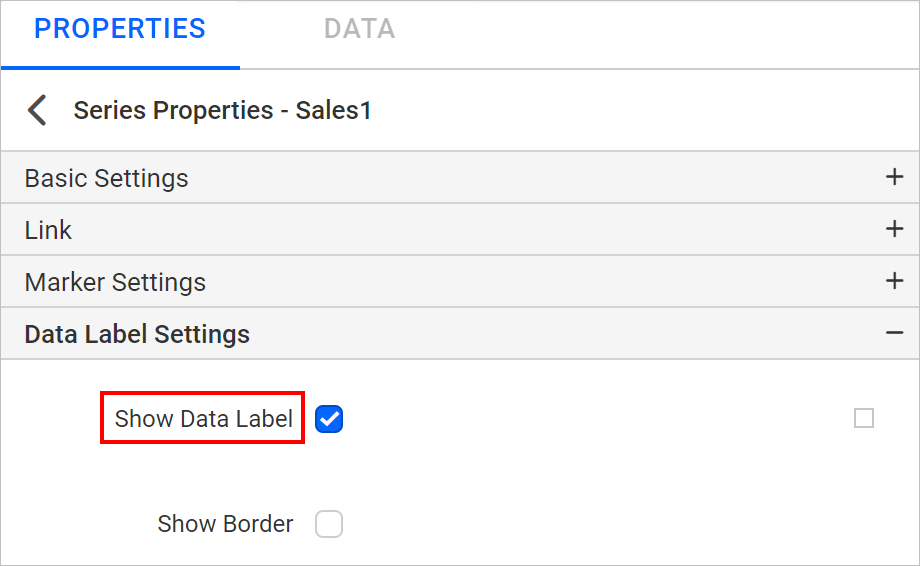
- Under data label settings category, enable Data Label property checkbox.
- Format the numbers produced by the
Data labels, usingFormatproperty. Set the'$'#,0;('$'#,0)as value in format property field.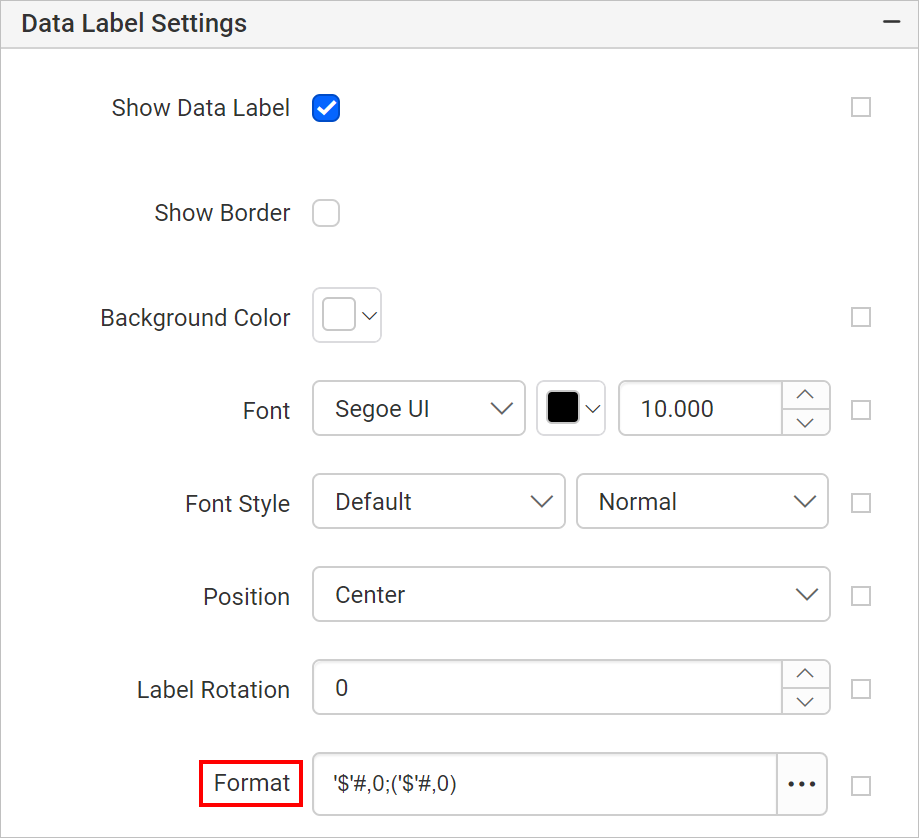
- In the below design background color and font styles are changed in table cells to improvise the report design.
Refer the Cell Properties to style the table cell.
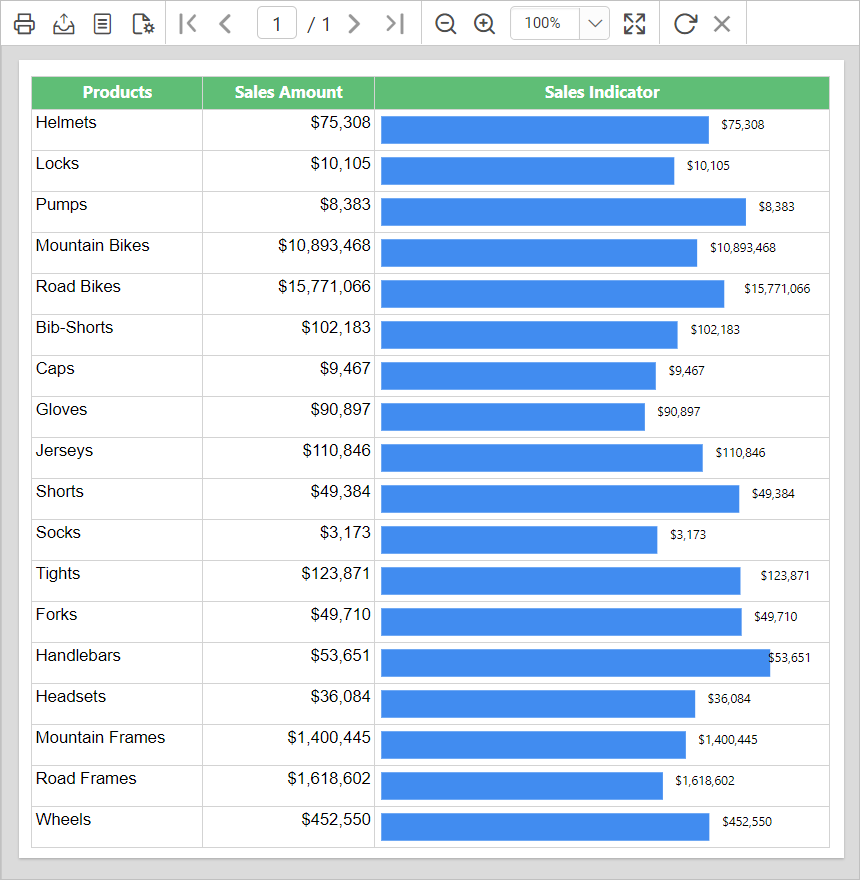
Report preview
On report preview, the difference in sales between each product category will be displayed like below,
Download the above report design from the link