Display SSRS RDL report in Bold Reports® Angular Report Viewer
This section explains you the steps required to create your first Angular reporting application in Angular CLI to display already created SSRS RDL report in Bold Reports® Angular Report Viewer without using a Report Server, refer to the following steps.
If you are using higher version of Angular CLI (>= v17.x), then refer Getting Started for Latest Version.
To get started quickly with Report Viewer, you can check this video:
Prerequisites
Before you begin, make sure your development environment includes the following:
- Node JS (
version 8.x or 10.x and above) Version Compatibility - NPM (
v3.x.x or higher)
Install the Angular CLI
Angular provides the easiest way to set Angular CLI projects using the Angular CLI tool. To install the CLI application globally to your machine, run the following command in the Command Prompt.
npm install -g @angular/cliTo learn more about
angular-clicommands, click here.
Create a new application
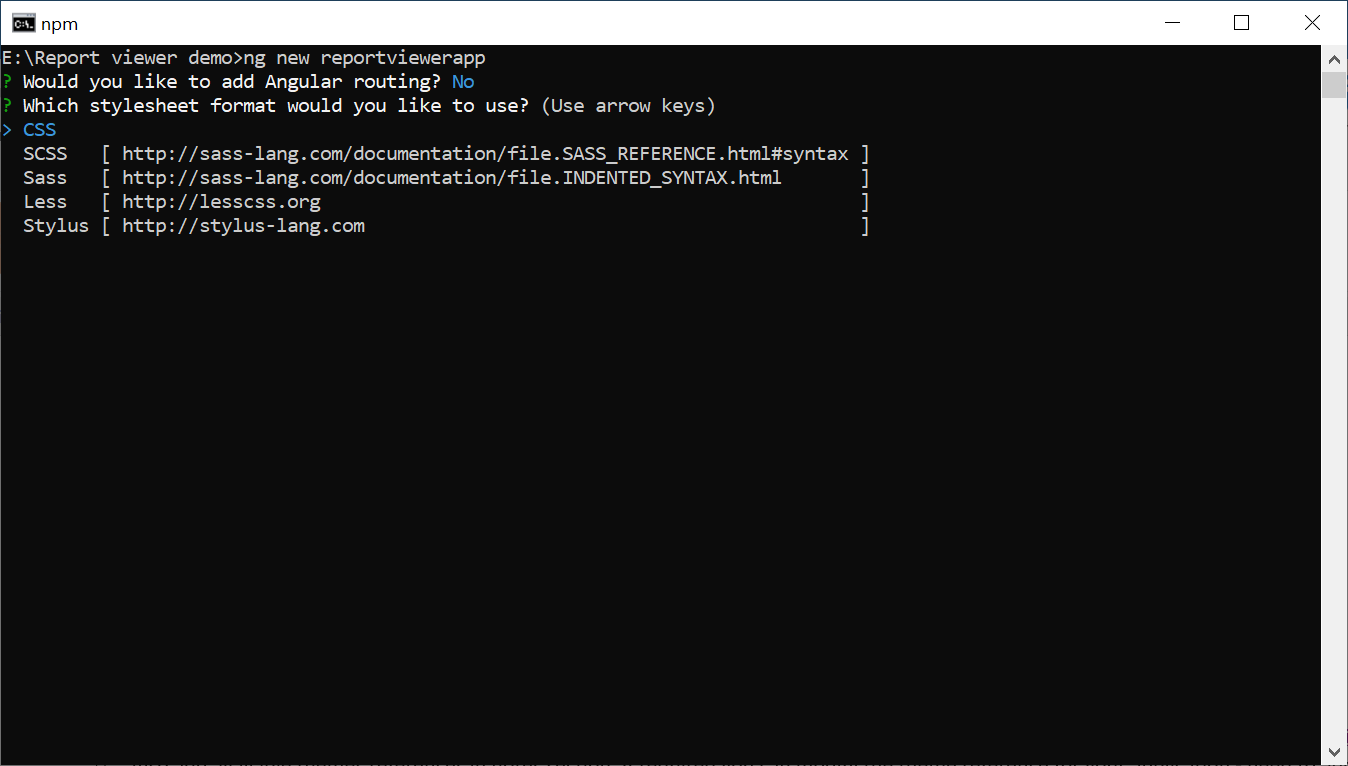
To create a new Angular application, run the following command in the Command Prompt.
ng new project-name

E.g : ng new reportviewerapp
The ng new command prompts you for information about features to include in the initial app project. Accept the defaults by pressing the Enter or Return key.
Configure the Bold Report Viewer in Angular CLI
Reporting tools packages are distributed in NPM package as @boldreports/angular-reporting-components.
-
To configure the Report Viewer component, change the directory to your application’s root folder.
cd project-name E.g: cd reportviewerapp -
Run the following commands to install the Bold Reports® Angular library.
Angular version NPM package installation 12 or greater than 12 npm install @boldreports/angular-reporting-components@latest —save-dev lesser than 12 npm install @boldreports/[email protected] —save-dev Note: It is important to exercise caution during the package installation process to avoid potential complications with package compilation.
-
Install the typings dependencies
jquery,types/jqueryandboldreports/types.npm install --save-dev jquery npm install --save-dev @types/jquery npm install --save-dev @boldreports/types -
Add the typings
jquery, andreports.allto thetsconfig.app.jsonfile.{ ... ... "compilerOptions": { ... ... "baseUrl": "", "types": [ "jquery", "reports.all" ] }, ... ... } -
Register the
@bold-reports/typesunder thetypeRootsnode in thetsconfig.jsonfile.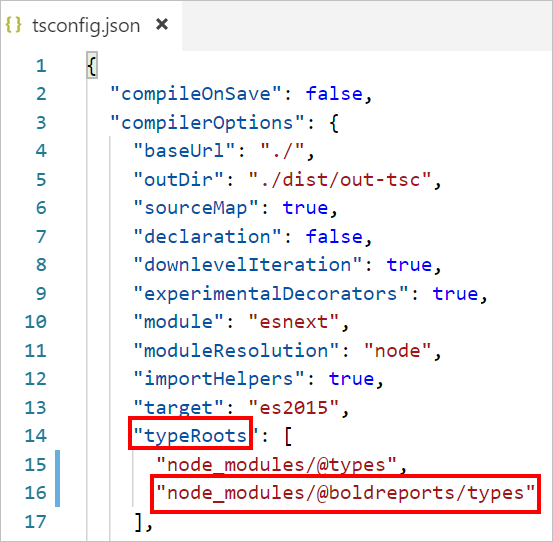
-
The Report Viewer requires a
window.jQueryobject to render the component.-
For
Angular version 12 or higher, Refer the jQuery script file (jquery.js) as given in theangular.jsonfile within theprojectname > scriptssection (For example,reportviewerapp > scripts).{ "$schema": "./node_modules/@angular/cli/lib/config/schema.json", "projects": { "reportviewerapp": { "root": "src", "outDir": "dist", . . . . . . "styles": [ "src/styles.css" ], "scripts": [ "./node_modules/jquery/dist/jquery.js" ], . . . . . . } } } -
For
Angular version lesser than 12, importjQueryinto thesrc/polyfills.tsfile as shown in the following code snippet.import * as jquery from 'jquery'; let windowInstance = (window as { [key: string]: any }); windowInstance['jQuery'] = jquery; windowInstance['$'] = jquery;
-
Adding CSS reference
Add the Report Viewer component style (bold.report-viewer.min.css) as given in the angular.json file within the projectname > styles section (For example, reportviewerapp > styles).
If you are using an Angular 6 or lower version project, add the changes to the
angular-cli.jsonfile.
{
  "$schema": "./node_modules/@angular/cli/lib/config/schema.json",
  "projects": {
    "reportviewerapp": {
      "root": "src",
      "outDir": "dist",
      . . .
      . . .
      "styles": [
        "styles.css",
        "./node_modules/@boldreports/javascript-reporting-controls/Content/v2.0/tailwind-light/bold.report-viewer.min.css"
      ],
      "scripts": [
        "./node_modules/jquery/dist/jquery.js"
      ],
      . . .
      . . .
    }
  }
}
In the previous code, the
tailwind-lighttheme is used. You can modify the theme based on your application, refer the following syntax:./node_modules/@boldreports/javascript-reporting-controls/Content/v2.0/[theme-name]/bold.report-viewer.min.css
Adding Report Viewer component
To add the Report Viewer component, refer to the following steps:
-
Open the
app.module.tsfile. -
You can replace the following code snippet in the
app.module.tsfile.import { BrowserModule } from '@angular/platform-browser'; import { NgModule } from '@angular/core'; import { BoldReportViewerModule } from '@boldreports/angular-reporting-components'; import { AppComponent } from './app.component'; // data-visualization import '@boldreports/javascript-reporting-controls/Scripts/v2.0/common/bold.reports.common.min'; import '@boldreports/javascript-reporting-controls/Scripts/v2.0/common/bold.reports.widgets.min'; // Report viewer import '@boldreports/javascript-reporting-controls/Scripts/v2.0/bold.report-viewer.min'; @NgModule({ declarations: [ AppComponent ], imports: [ BrowserModule, BoldReportViewerModule ], providers: [], bootstrap: [AppComponent] }) export class AppModule { } -
Open the
app.component.htmlfile and initialize the Report Viewer. -
You can replace the following code snippet in the
app.component.htmlfile.<bold-reportviewer id="reportViewer_Control" style="width: 100%;height: 950px"> </bold-reportviewer> -
Open the
app.component.tsand replace the following code example.import { Component } from '@angular/core'; @Component({ selector: 'app-root', templateUrl: './app.component.html', styleUrls: ['./app.component.css'] }) export class AppComponent { title = 'reportviewerapp'; public serviceUrl: string; public reportPath: string; constructor() { // Initialize the Report Viewer properties here. } }If you have faced the issue
'ej' is not definedafter the above configuration in Angular CLI version 7, refer to the following code snippet in your application where you have rendered Syncfusion® Components(model file) to resolve the issue.`/// <reference types="reports.all" />`
Create Web API service
The Report Viewer requires a Web API service to process the report files. You can skip this step and use the online Web API services to preview the already available reports or you should create any one of the following Web API services:
Adding already created report
If you have created a new service, you can add the reports from the Bold Reports® installation location. For more information, refer to samples and demos section.
-
Create a folder
Resourcesin your Web API application to store the RDL reports and add already created reports to it. -
Add already created reports to the newly created folder.
In this tutorial, the
sales-order-detail.rdlreport is used, and it can be downloaded in this link.
Refer to the create RDL report section for creating new reports.
Set report path and Web API service
To set report path and Web API service, open the app.component.ts file and add the codes as shown in the constructor.
import { Component } from '@angular/core';

@Component({
  selector: 'app-root',
  templateUrl: './app.component.html',
  styleUrls: ['./app.component.css']
})
export class AppComponent {
  title = 'jsreport-sample';
  public serviceUrl: string;
  public reportPath: string;

    constructor() {
        this.serviceUrl = 'https://demos.boldreports.com/services/api/ReportViewer';
        this.reportPath = '~/Resources/docs/sales-order-detail.rdl';
    }
}
In the above code, the
sales-order-detail.rdlreport andreportServiceUrlused from online URL.
Open the app.component.html to set reportPath and reportServiceUrl properties of Report Viewer as in the following.
<bold-reportviewer id="reportViewer_Control" [reportServiceUrl] = "serviceUrl" [reportPath] = "reportPath" style="width: 100%;height: 950px">
</bold-reportviewer>
Serve the application
To serve the application, follow these steps:
-
Navigate to the root of the application and run the application using the following command.
ng serve -
Navigate to the appropriate port
http://localhost:4200in the browser.
See Also
Set data source credential for shared data sources