Assign data to a tablix data region in Bold Reports®
In the Bold Reports® Web Report Designer, the table, matrix, and list report items can display data from a single dataset. You can also assign conditional expressions to filter or sort the dataset columns.
How do I assign a dataset to a tablix?
You assign a dataset to a tablix in the Bold Reports® Web Report Designer in one of two ways:
- Assign dataset from data assign menu.
- Assign dataset in
Datasetproperty of tablix.
How do I assign a dataset from the data assign menu?
You assign a dataset from the data assign menu of any tablix cell in the Web Report Designer.
-
Select any cell in the tablix data region, then click the
Data Assignmenu icon to open the data assign menu. If the report does not have a dataset, the data assign menu has the following options.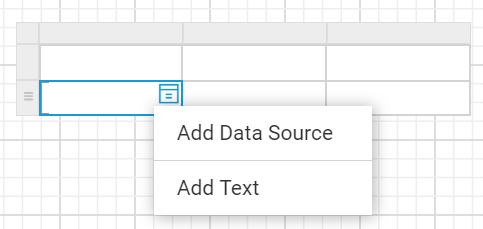
Click the
Add Datasourceoption in the menu and add a dataset using the steps provided in the Create Data section. -
Review the fields. By default, the menu displays the fields of the first dataset in the report.
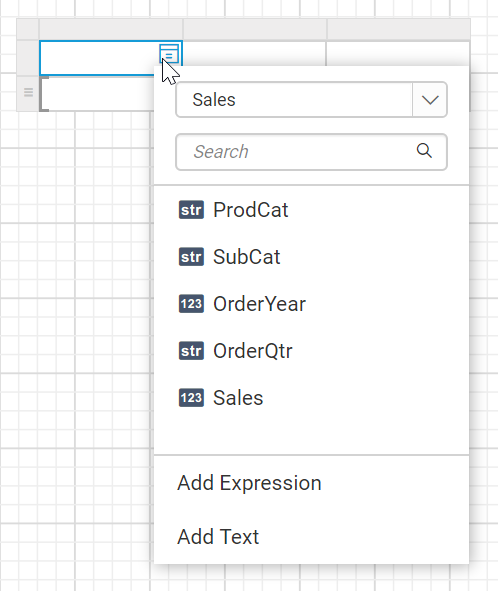
-
Choose the desired dataset in the first dropdown, which lists the available datasets in the report, to assign a different dataset.
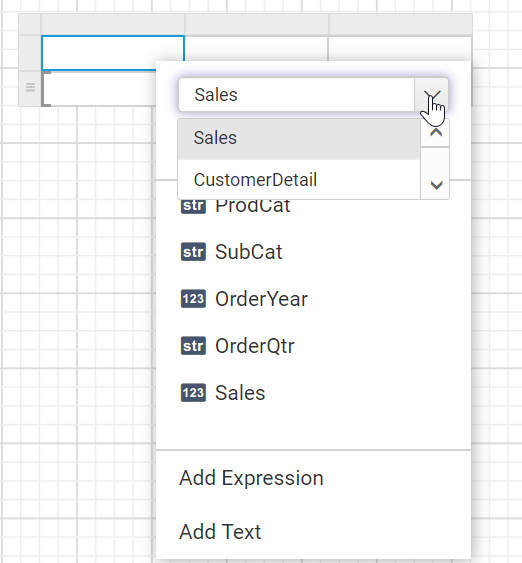
-
Check that the fields of the selected dataset are listed in the data assign menu, as shown in the following image.
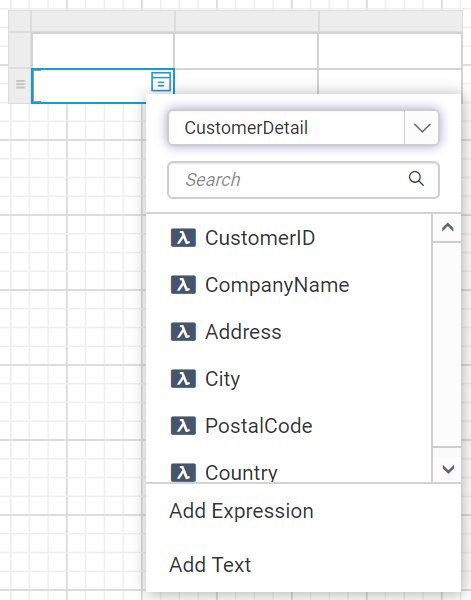
Assign dataset from properties panel
You assign a dataset from the Dataset property of the tablix in the Web Report Designer properties panel.
- Select the tablix report item in the design area. The tablix properties are listed in the properties panel.
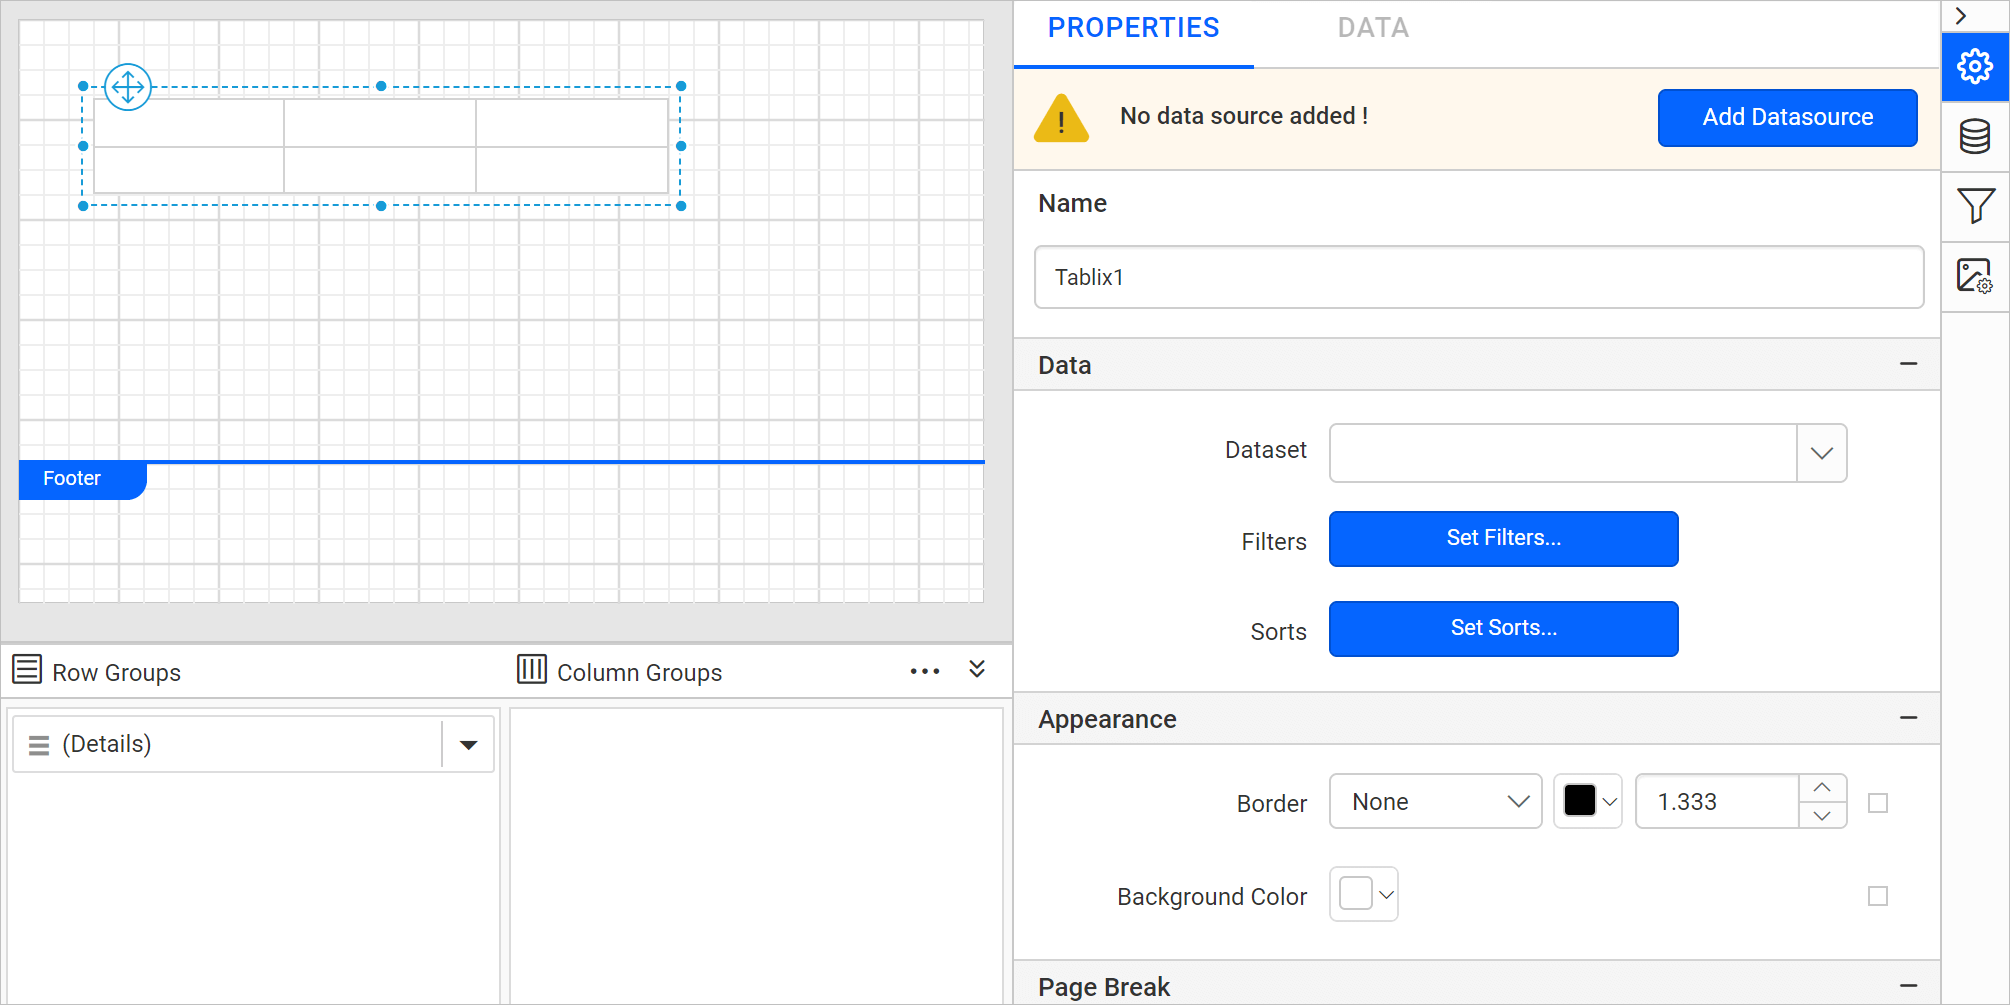
- Choose the desired dataset from the
Datasetproperty drop-down, which lists the available datasets in the report.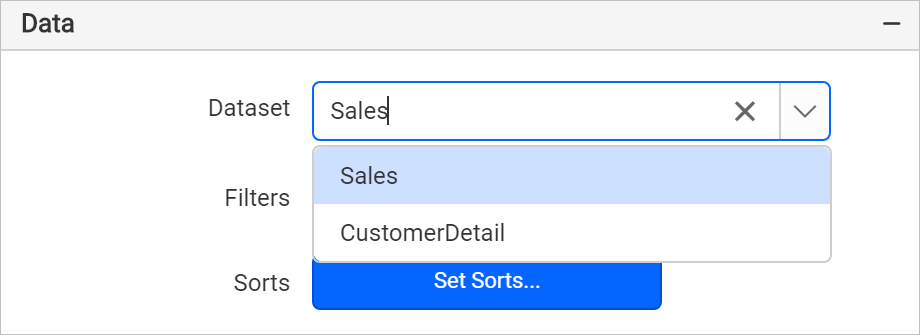
- Check that the fields of the selected dataset are listed in the data assign menu, as shown in the following image.
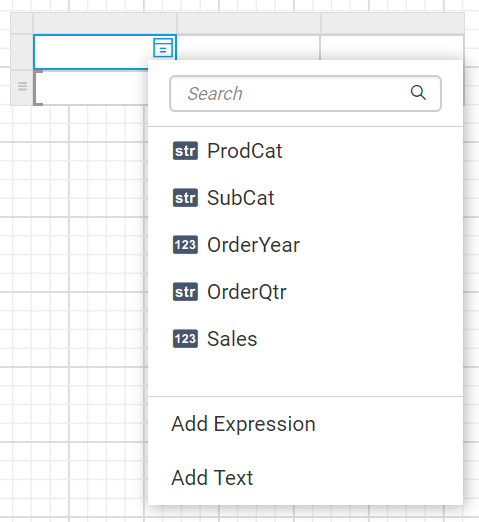
How do I assign fields to a tablix cell?
You assign fields to a tablix cell in the Bold Reports® Web Report Designer in a few different ways:
- Drag and drop data fields from the
DATApanel. - Select the field from the data assign menu provided in each cell.
How do I drag and drop data fields?
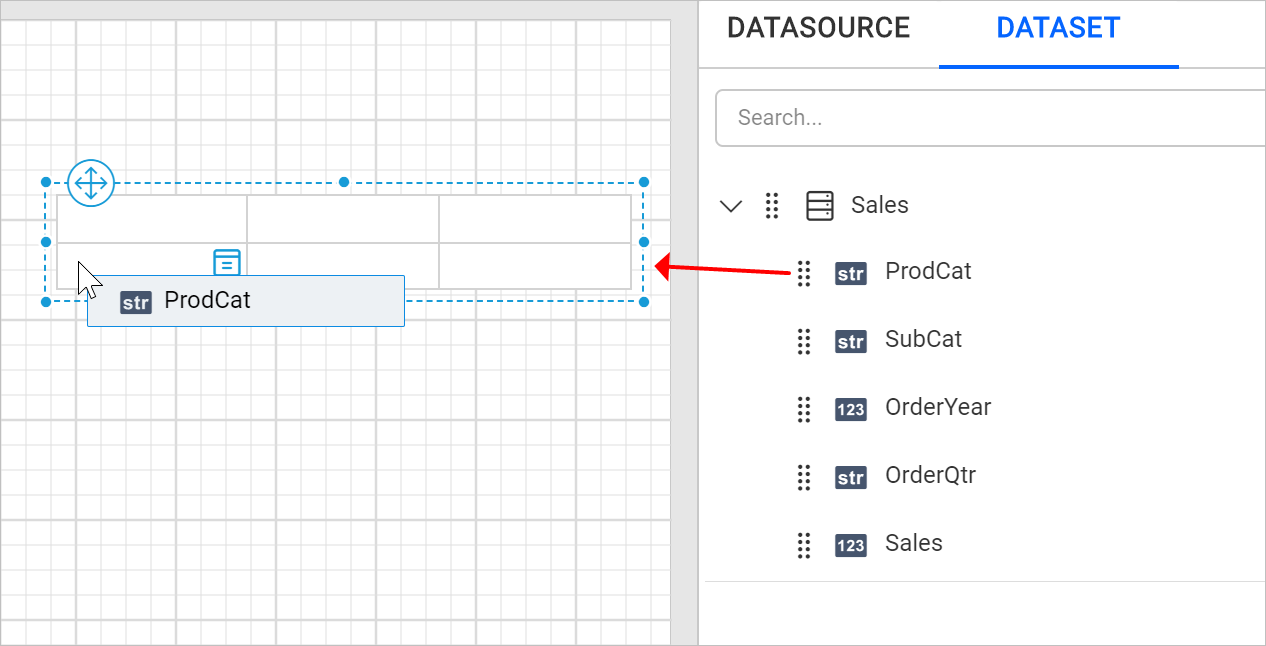
You drag fields into tablix cells from the DATA panel of the Web Report Designer.
- Open the
DATApanel and expand the required dataset.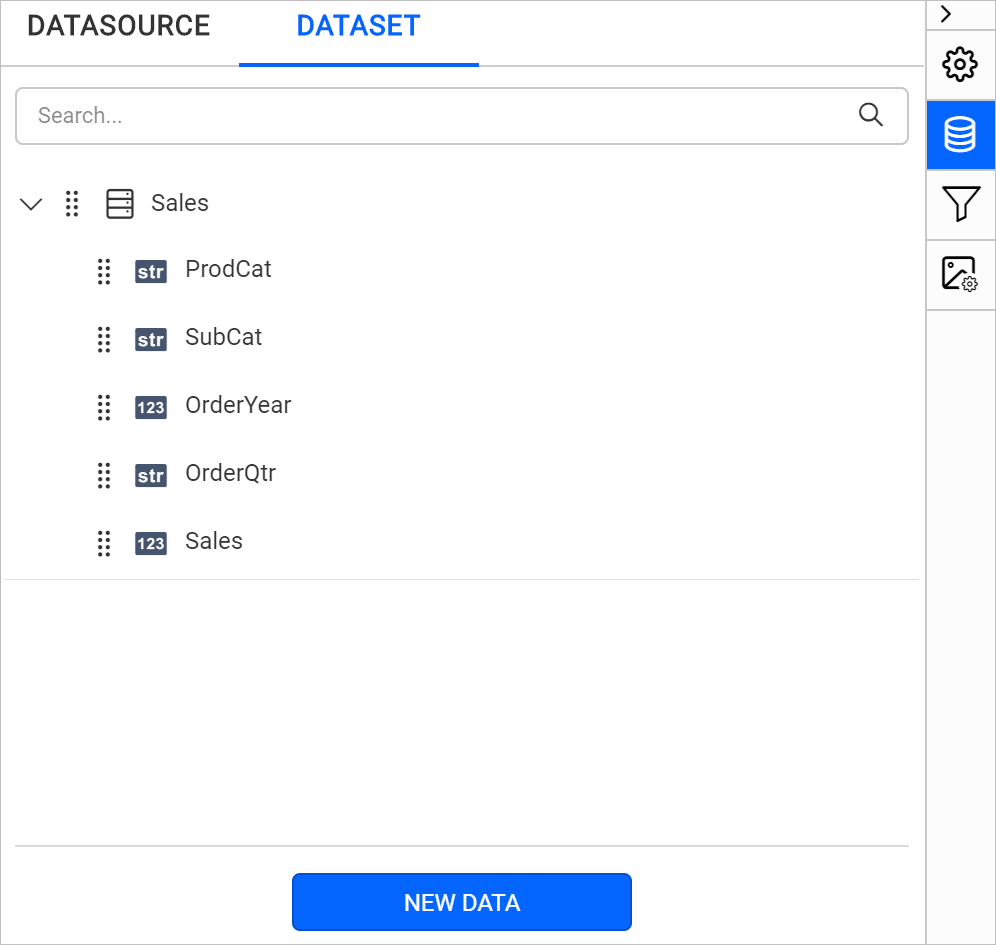
- Drag a field from the list and drop it into the required cell.
Assign fields using data assign menu
You assign a field from the data assign menu that each tablix cell provides in the Web Report Designer.
-
Select the tablix cell and click the
Data assignmenu icon to open the data assign menu.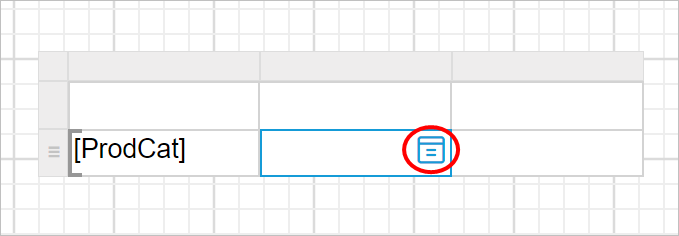
-
Click the required data field name in the menu.
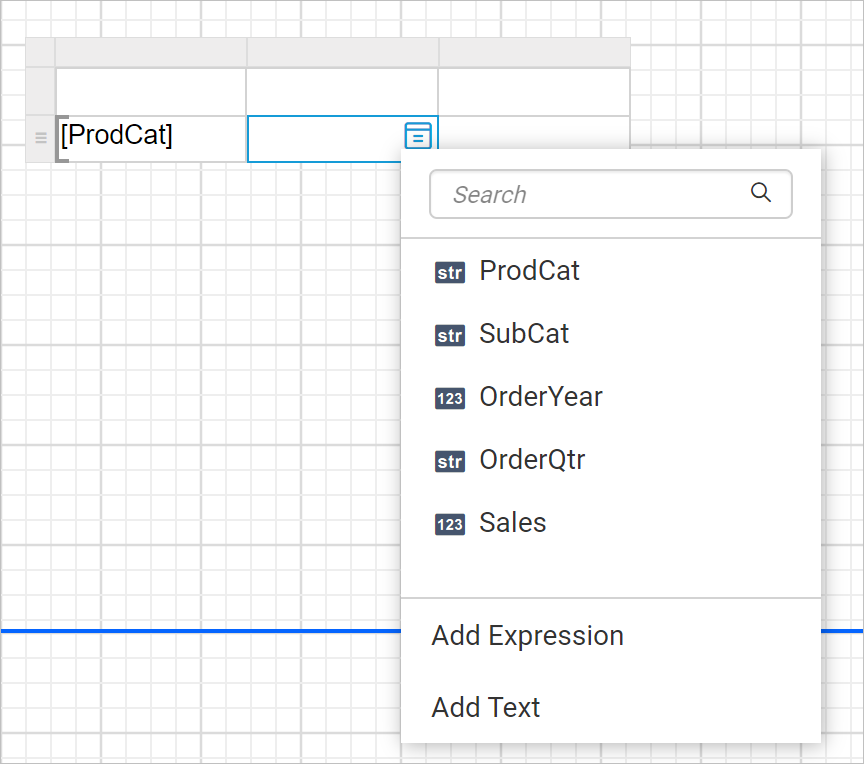
The fields of the dataset assigned to the
Datasetproperty of the tablix are listed in the menu. -
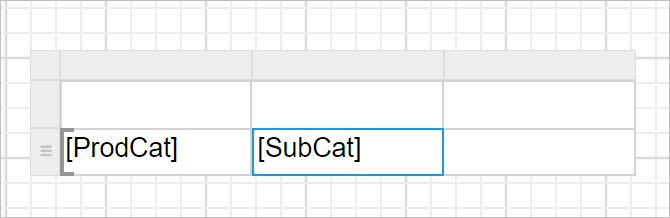
Check that the field is assigned to the respective cell, as shown in the following image.
Assign or edit expression into table cell
You assign or edit an expression in a tablix cell in the Bold Reports® Web Report Designer in two ways:
- Set expression using the
Add Expressionand modify them using theEdit Expressionoption in the Data Assign menu. - Set or edit expression using Multi-Text Run Editor Dialog.
How do I set an expression using the data assign menu?
The Data Assign Menu is recommended when you want to quickly assign a single TextRun expression to a tablix cell. It provides a direct way to open the Expression Editor.
-
Select a tablix cell and click the
Data Assignmenu icon to open the Data Assign menu.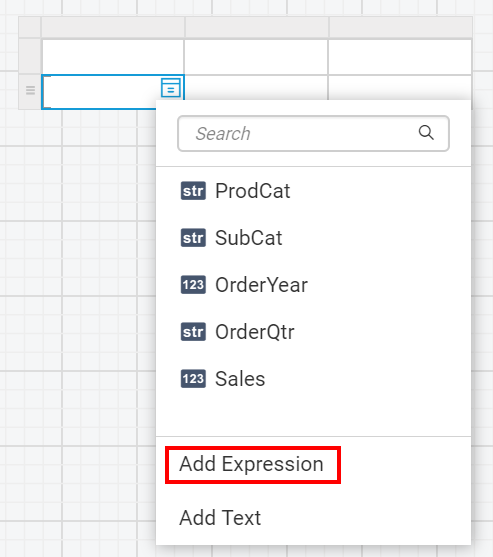
-
Click the
Add Expressionoption in the data assign menu. TheExpressionbuilder opens, as shown in the following image.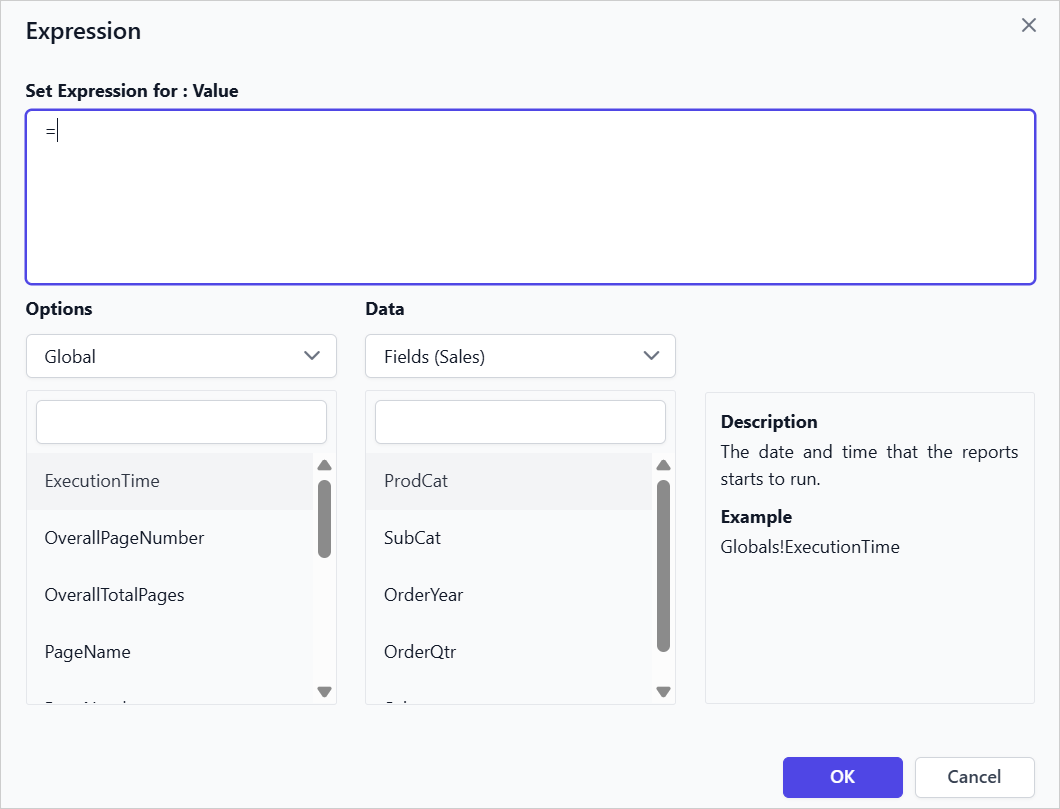
To learn more about working with expressions in the Web Report Designer, refer to the Expressions section.
-
Set the Expression in the Expression editor.
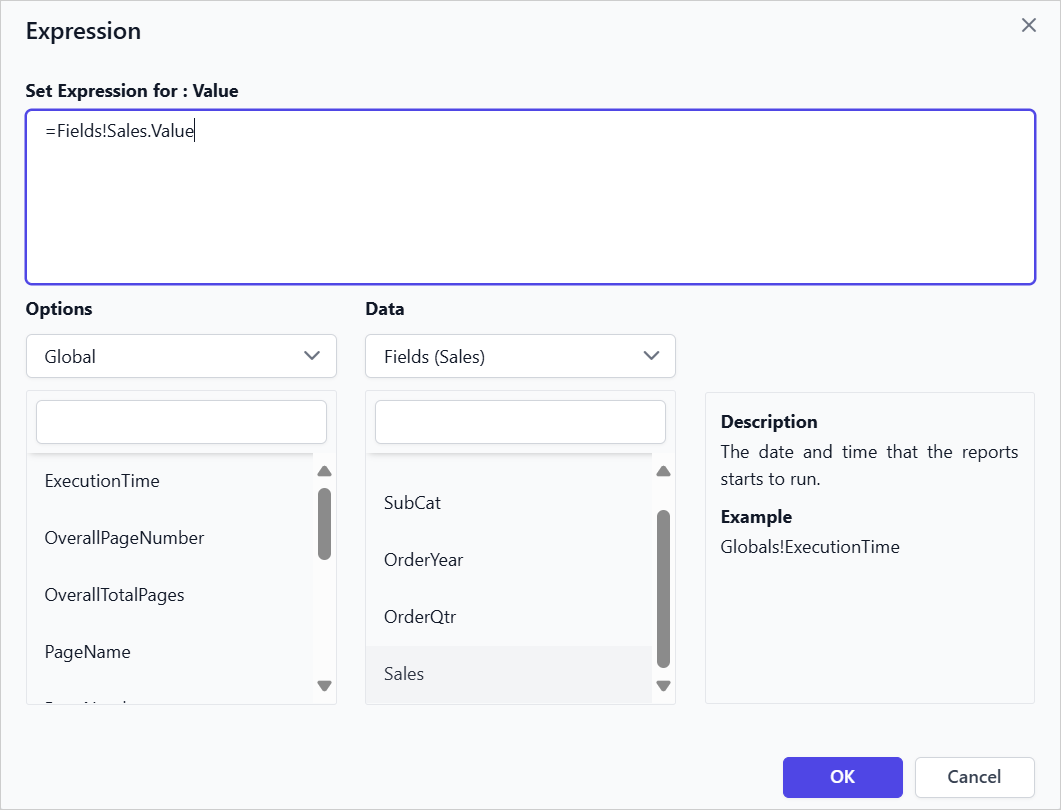
-
Click
OKto assign the added expression to the respective tablix cell.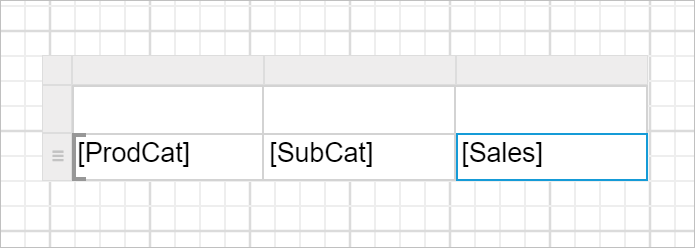
Set expression using Multi-Text Run Editor Dialog
The Multi‑Text Run Editor Dialog is ideal when you need to manage multiple TextRuns within the same tablix cell. In this dialog, you can combine static text and expressions for complex formatting or mixed content.
- Select the tablix cell and click the
Text Editoricon to open the Multi-Text Run Editor Dialog.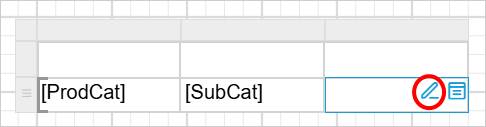
- Review the
Multi-Text Run EditorDialog that opens, which lets you add and manage expressions within the cell.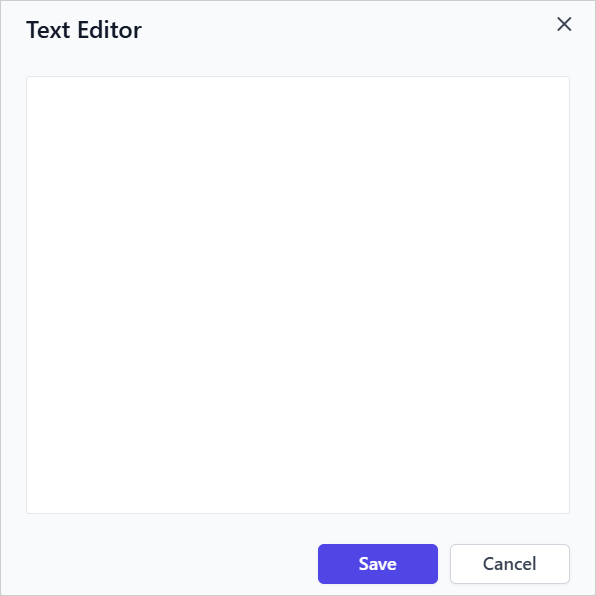
- Right-click within the editor area to open the context menu.
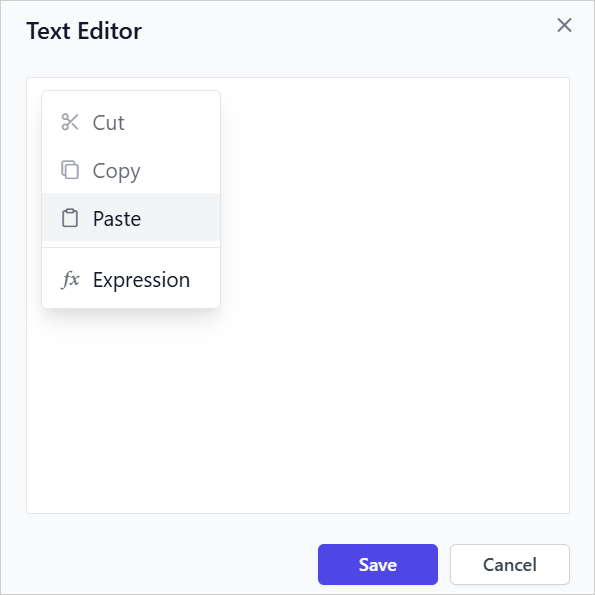
- From the context menu, click the
Expressionoption to open theExpression Editor. - Set the Expression in the Expression editor and click
OK. - Check that the
[Sales]expression appears in theMulti-Text Run EditorDialog.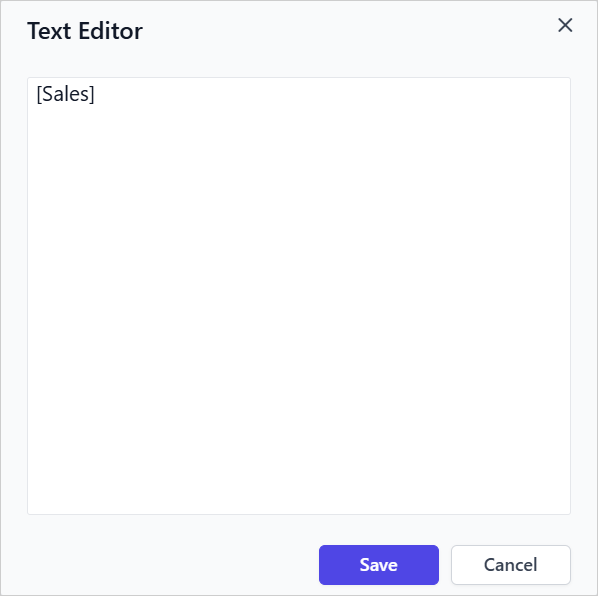
- Click
Saveto assign the added expression to the respective tablix cell.
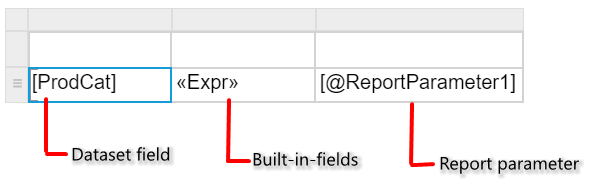
You can specify dataset fields, parameters, or built-in functions in the Expression Editor, then click OK.
The label shown in the table cell varies based on the values assigned to the table cell. The following image shows the label text variations.
Edit expression using data assign menu
You edit a single expression in a tablix cell with the Edit Expression option of the Web Report Designer data assign menu.
- Select the table cell whose expression you want to edit and click the
Data assignmenu icon to open the data assign menu.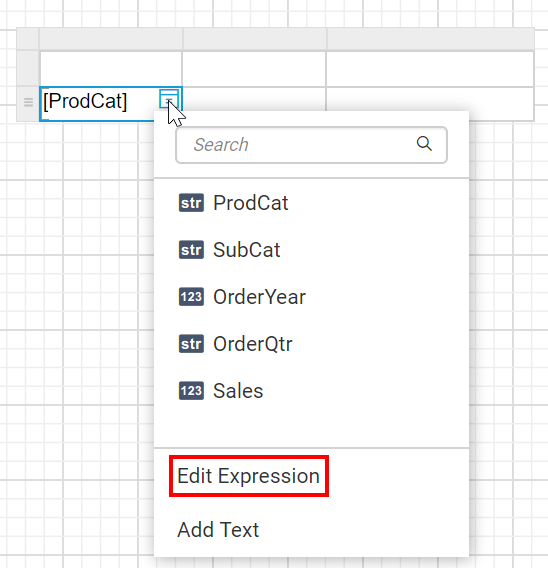
- Click the
Edit Expressionoption in the data assign menu. TheExpressionbuilder opens, as shown in the following image. - Modify the expression as required and click the
OKbutton.
Edit expression using Multi-Text Run Editor Dialog
You edit an existing expression in the Multi-Text Run Editor Dialog of the Web Report Designer through its context menu.
- Select the tablix cell and click the
Text Editoricon to open the Multi-Text Run Editor Dialog.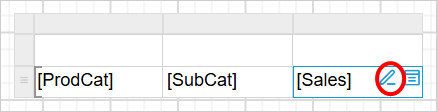
- Review the
Multi-Text Run Editordialog that appears, which lets you modify the existing Expression. - Right-click within the expression context to edit the Expression.
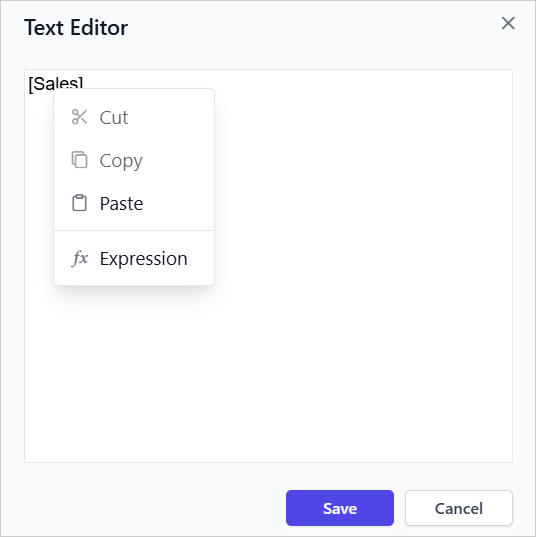
- From the context menu, click the
Expressionoption to open theExpression Editor. - Update the Expression in the
Expression editorand clickOK.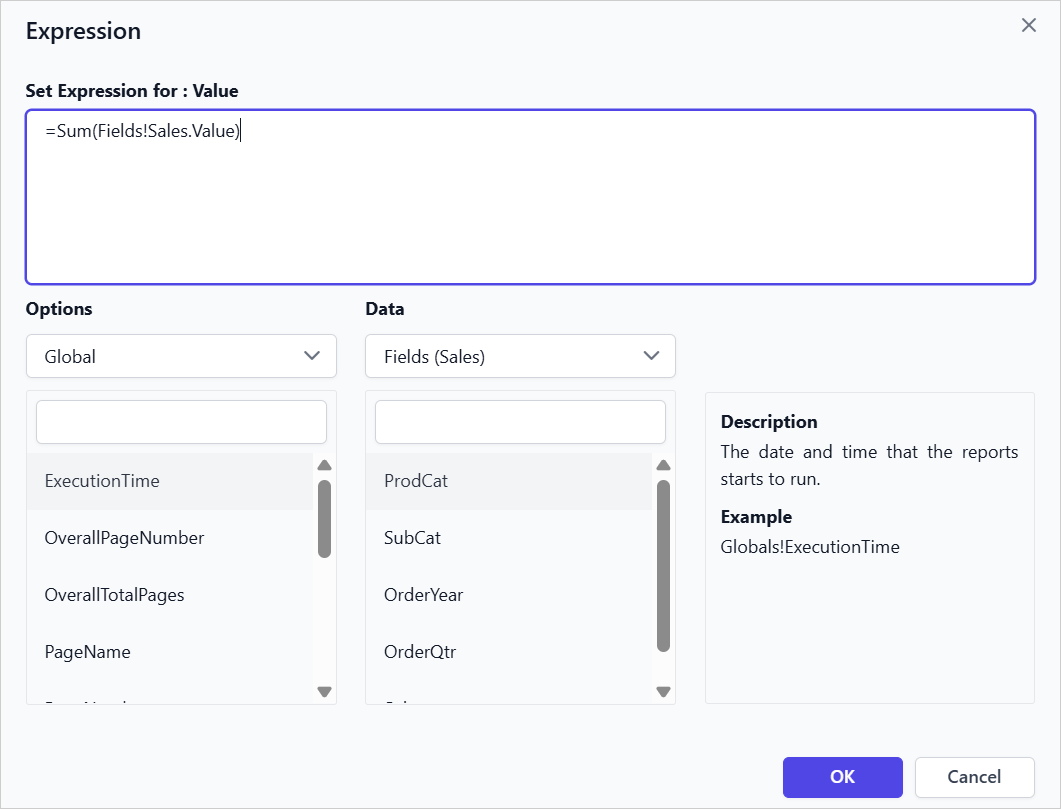
- Check that the
[Sum(Sales)]expression is updated in the Multi-Text Run Editor dialog.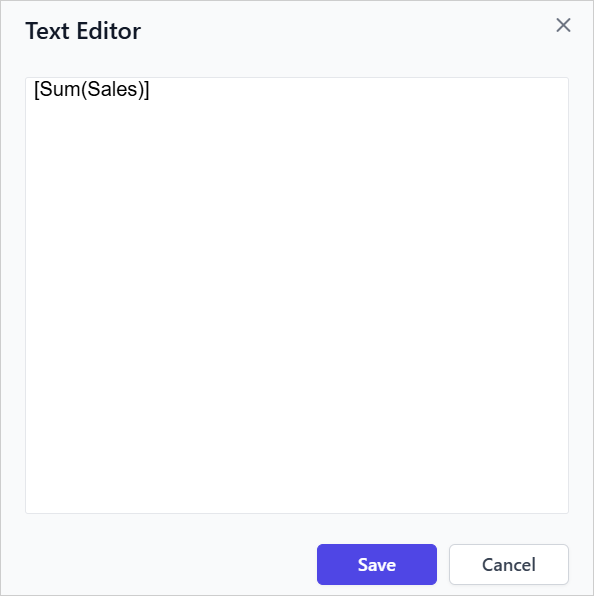
- Click
Saveto assign the modified expression to the respective tablix cell.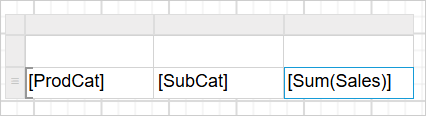
Tablix Cell Editors
Each tablix cell in the Bold Reports® Web Report Designer provides flexible editing options to manage text and expressions. These options simplify report design with quick access to text entry or expression assignment.
- Text Editor icon: Opens the Multi-Text Run Editor dialog.
- Data Assign Menu icon: Opens a menu with options to add text or expression.
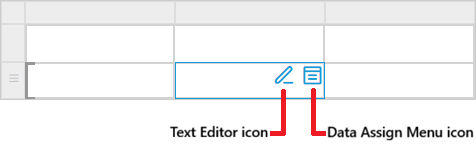
Text Editor Icon
The Text Editor icon in a tablix cell works as follows:
- Opens the
Multi-Text Run Editordialog to enter static text or expressions. - Right-click inside the editor and select Expression from the context menu to open the Expression Editor.
- Supports adding a single TextRun or multiple TextRuns.
Data Assign Menu Icon
The Data Assign Menu provides the following options:
- Add Text: Opens the
Multi-TextRun Editordialog to enter static text or expressions. - Add Expression: Opens the
Expression Editordirectly. This option allows adding only a single TextRun, enabling faster report creation.
The options shown in the Data Assign Menu depend on the current state of the tablix cell:
| Cell State | Menu Options Displayed |
|---|---|
| Empty cell (no TextRuns) | Add Expression, Add Text |
| Single TextRun (static text) | Add Expression, Edit Text |
| Single TextRun (expression) | Edit Expression, Edit Text |
| Multiple TextRuns | Edit Text |
What happens when I double-click a tablix cell?
Double-clicking a tablix cell in the Web Report Designer provides a shortcut to open the appropriate editor:
| Cell State | Double-Click Action |
|---|---|
| Empty cell (no TextRuns) | Opens Multi TextRun Editor |
| Single TextRun (static text) | Opens Multi TextRun Editor |
| Single TextRun (expression) | Opens Expression Editor |
| Multiple TextRuns | Opens Multi TextRun Editor |
Frequently asked questions
How many datasets can a tablix display?
The table, matrix, and list report items can display data from a single dataset.
When should I use the Multi-Text Run Editor Dialog?
Use the Multi-Text Run Editor Dialog when you need to manage multiple TextRuns within the same tablix cell or combine static text and expressions.