Design an RDL report using a subreport in Bold Reports®
To compare the details of two employees side by side, create an SSRS RDL report with a subreport in the Bold Reports® Web Report Designer. You build a main report, build a subreport, link the two, and pass parameters.
How do I create the main report?
The main report in the Bold Reports® Web Report Designer holds the employee parameters and the two subreport items.
- Create a dataset with the following query, which the main report uses. Refer to the Create Data section for the steps.
SELECT
Employees.EmployeeID,
Employees.FirstName
FROM
Employees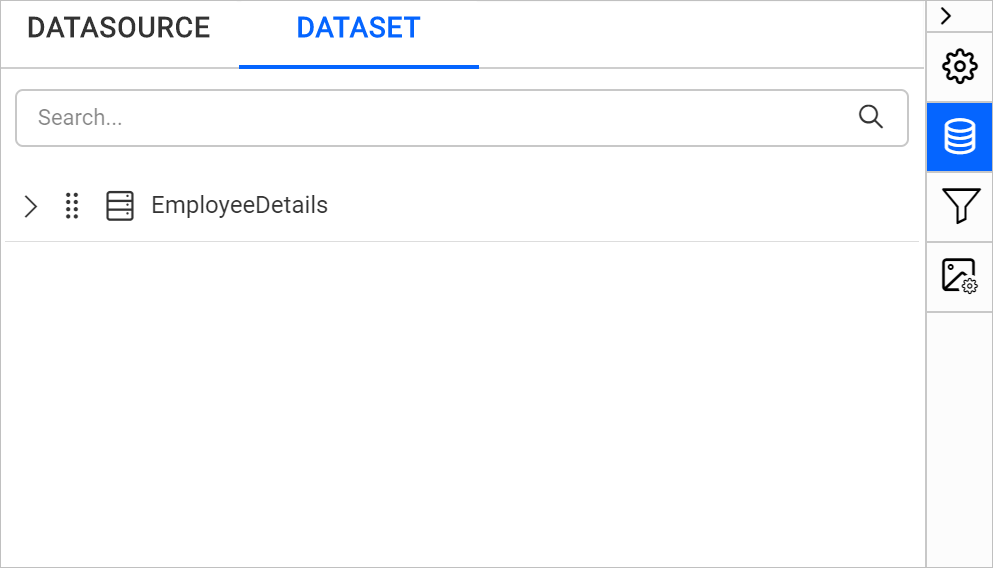
- Create two parameters named
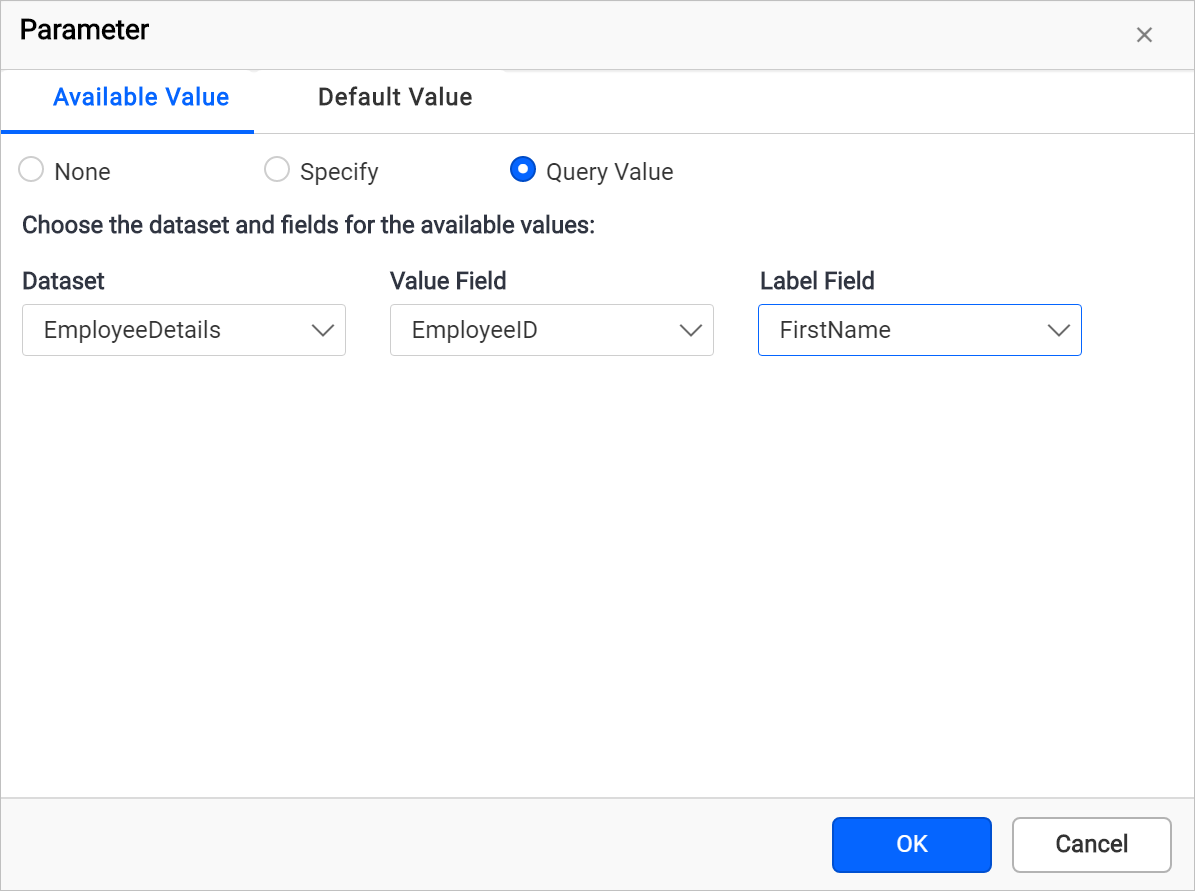
Employee-AandEmployee-Bin the main report to compare the employee details. Assign the required dataset field value to the parameters as shown in the following images. Refer to the Parameter and Assign Value sections to create and assign values to the parameters.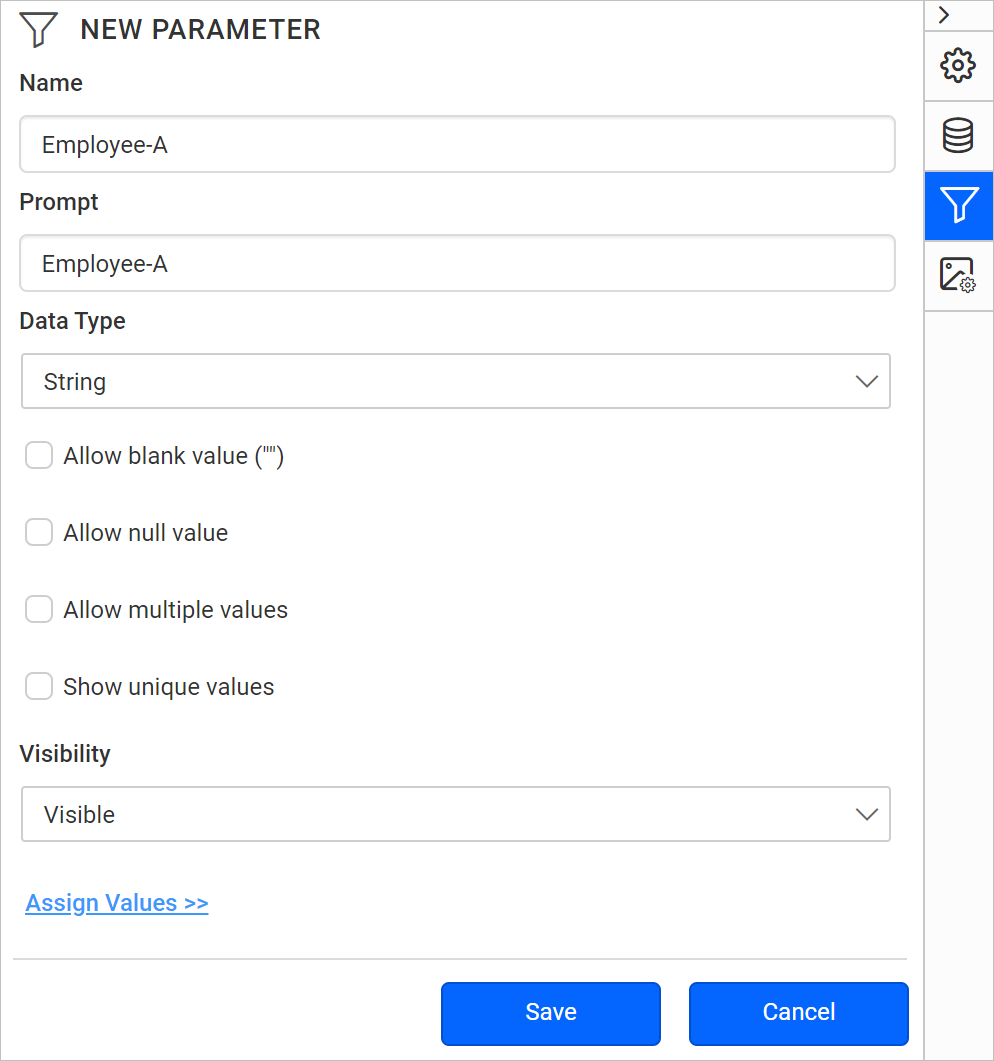
- Design a simple report using textbox and line report items.
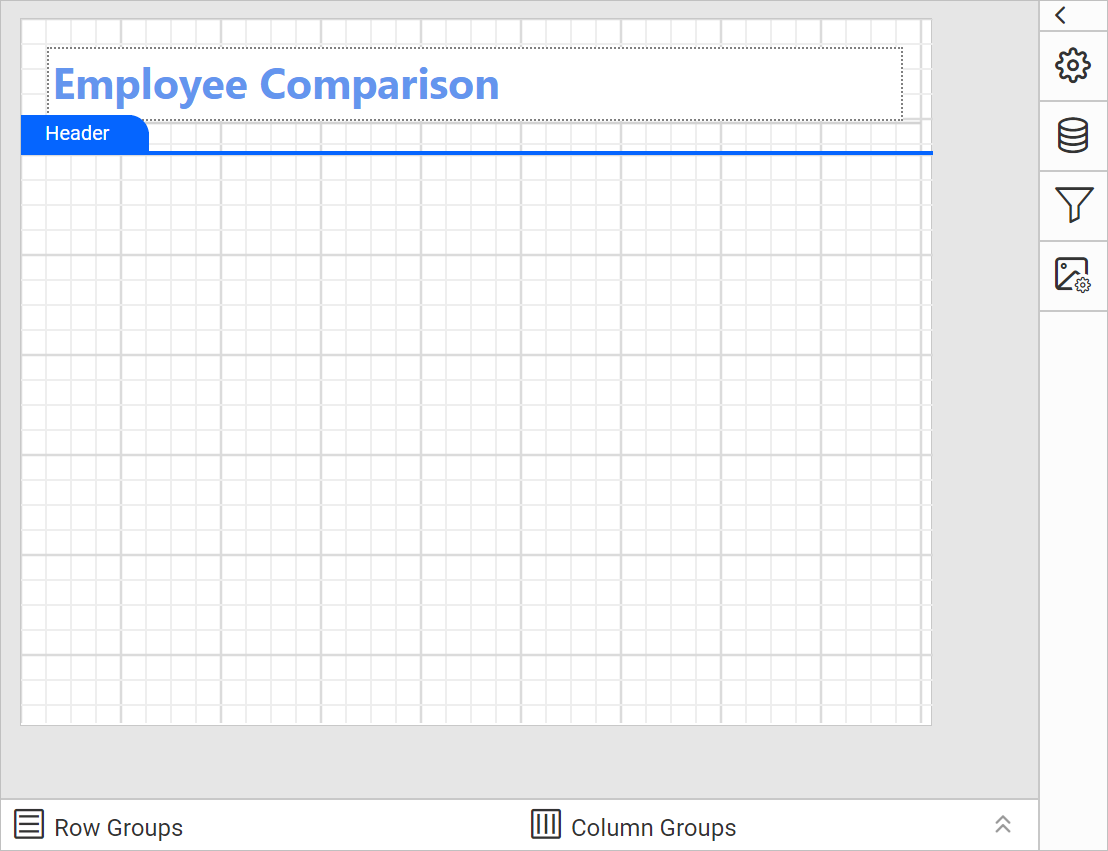
Note: Refer to the Textbox and Line sections to create the above report design.
How do I add the subreport items?
You add subreport items in the Web Report Designer from the Sub Reports category of the item panel.
- Drag and drop the subreport item listed in the item panel under the
Sub Reportscategory.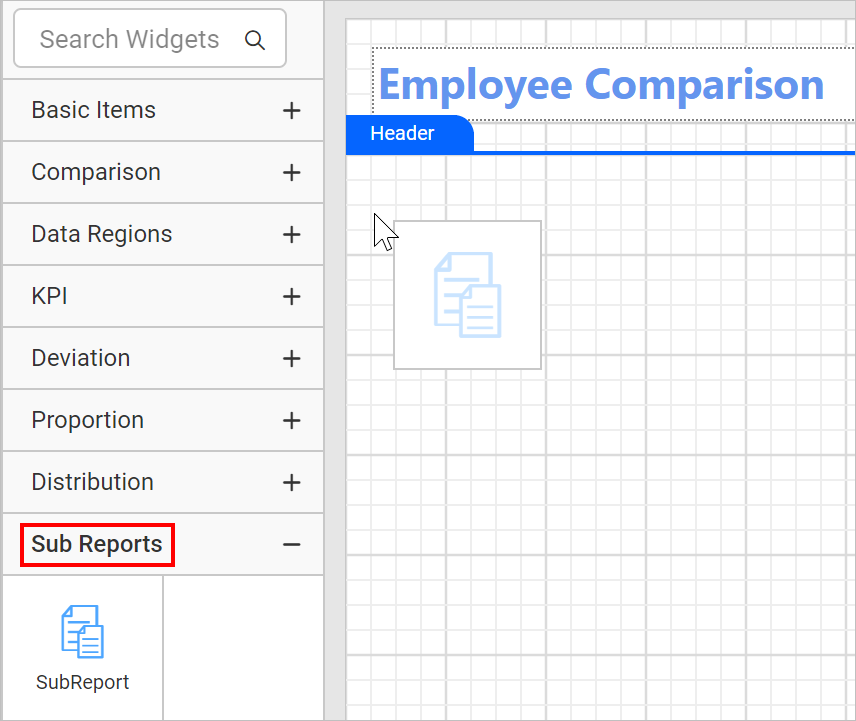
- Drag and drop two subreport items side by side in the design area to compare the employee details.
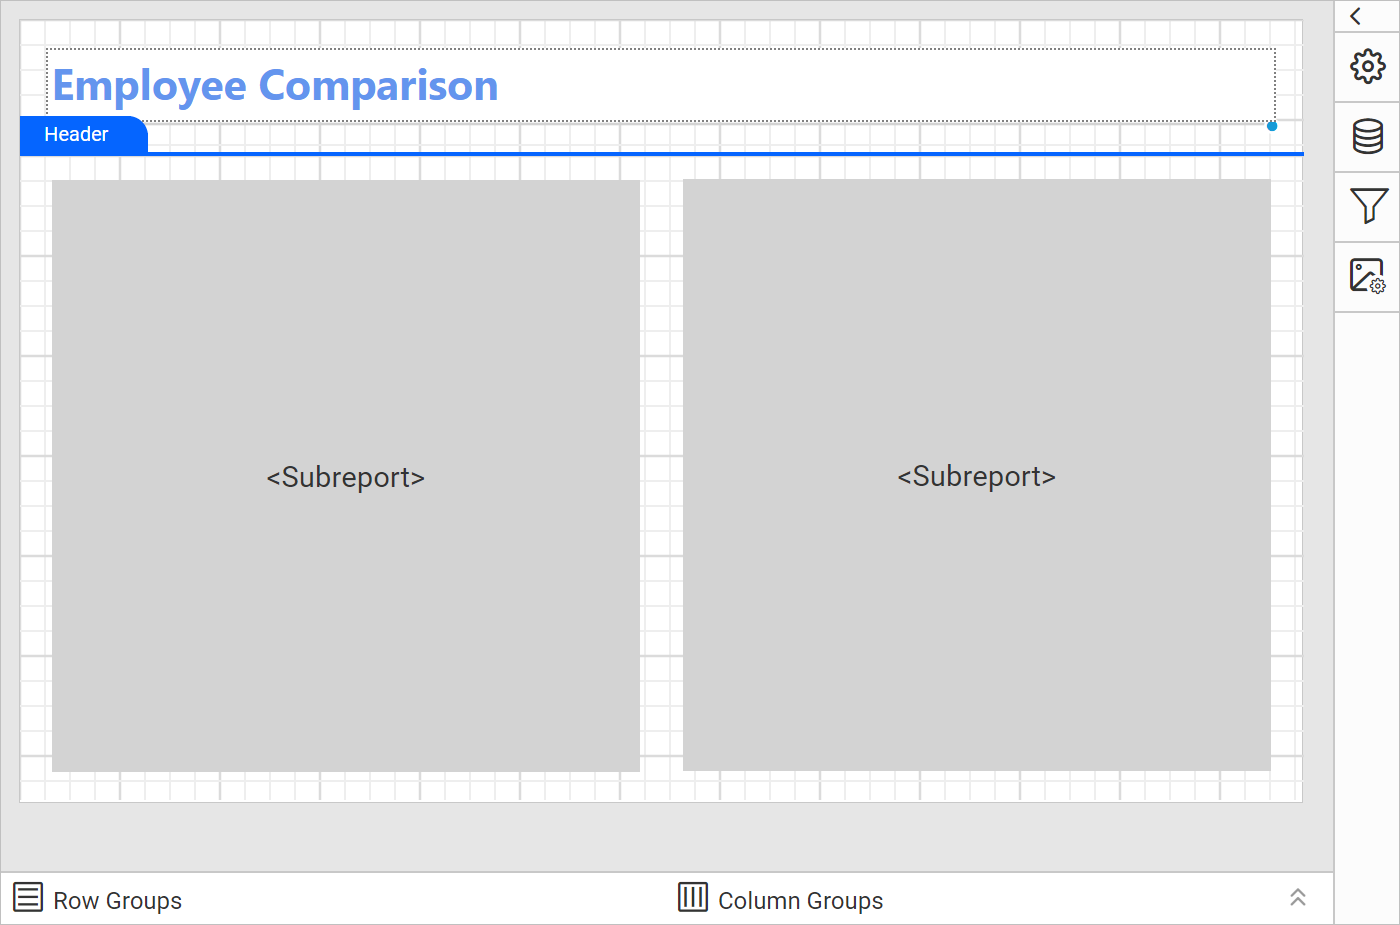
How do I create the subreport?
The subreport in the Bold Reports® Web Report Designer displays the employee details. You create its datasets, design its layout, and assign its fields.
How do I create the subreport datasets?
The subreport uses three datasets from the Northwind database, each filtered by the @SalesPersonID query parameter.
-
Create a dataset with the following query to fetch the employee personal details, which is bound to the
Employeestable of theNorthwinddatabase. Refer to the Create Data section for the steps.SELECT Employees.EmployeeID,Employees.LastName,Employees.FirstName,Employees.Title,Employees.TitleOfCourtesy ,(DATENAME(WEEKDAY,Employees.BirthDate)+', '+ DATENAME (DAY,Employees.BirthDate)+'+DATENAME(MONTH,Employees.BirthDate)+'+DATENAME(YEAR,Employees.BirthDate)) as BirthDate ,(DATENAME(WEEKDAY,Employees.HireDate)+', '+DATENAME(DAY,Employees.HireDate)+'+DATENAME(MONTH,Employees.HireDate)+'+DATENAME(YEAR,Employees.HireDate))as HireDate ,Employees.HomePhone ,Employees.City,Employees.Region,Employees.PostalCode,Employees.Country ,SUM(o.Quantity * o.UnitPrice) As TotalGain FROM Employees,[Order Details] as O,[Orders] as Ord WHERE o.OrderID = ord.OrderID and Employees.EmployeeID = ord.EmployeeID and Employees.EmployeeID = @SalesPersonID group by Employees.EmployeeID ,Employees.LastName,Employees.FirstName,Employees.Title,Employees.TitleOfCourtesy,BirthDate,HireDate,Employees.City,Employees.HomePhone,Employees.Region ,Employees.PostalCode,Employees.Country -
Create a dataset using the following query to present the employee sales order details in tabular format, and bind the data to the table report item:
SELECT Top(10) o.OrderID,Cus.CompanyName,SUM(OD.UnitPrice * od.Quantity ) As ExPrice FROM [Orders] as O, [Customers] as Cus,[Order Details] as OD where (O.EmployeeID = @SalesPersonID) and (cus.CustomerID=o.CustomerID) and od.OrderID = o.OrderID group by o.OrderID,o.CustomerID,cus.CompanyName -
Create a dataset with the following query to retrieve the employee image details from the
Employeestable of theNorthwinddatabase:SELECT Employees.Photo FROM Employees WHERE (Employees.EmployeeID = @SalesPersonID)The datasets created in the report are now listed in the
Data panel.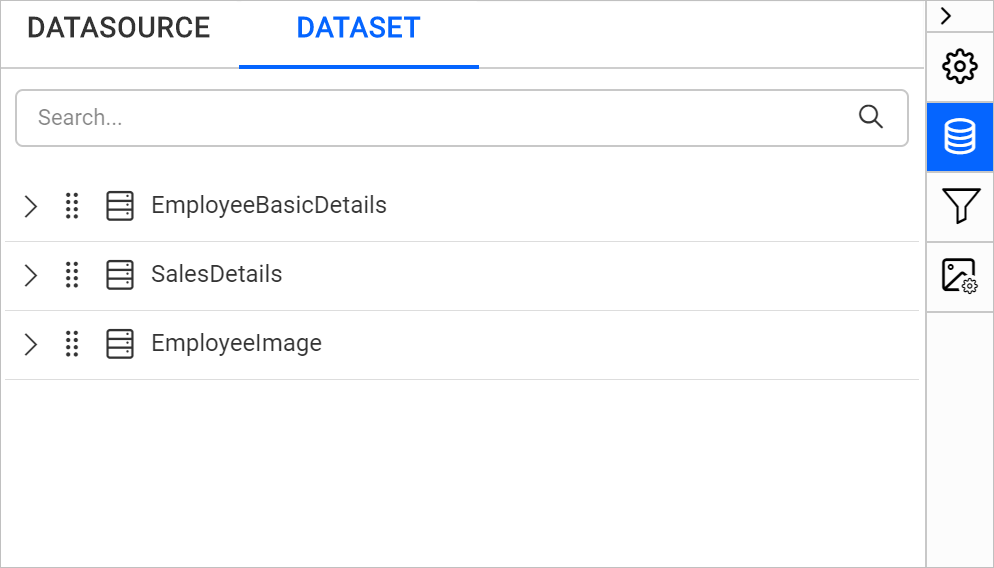
-
Check the report parameters. Based on the
@SalesPersonIDquery parameter created in the dataset query, an equivalent report parameter is created automatically in the report.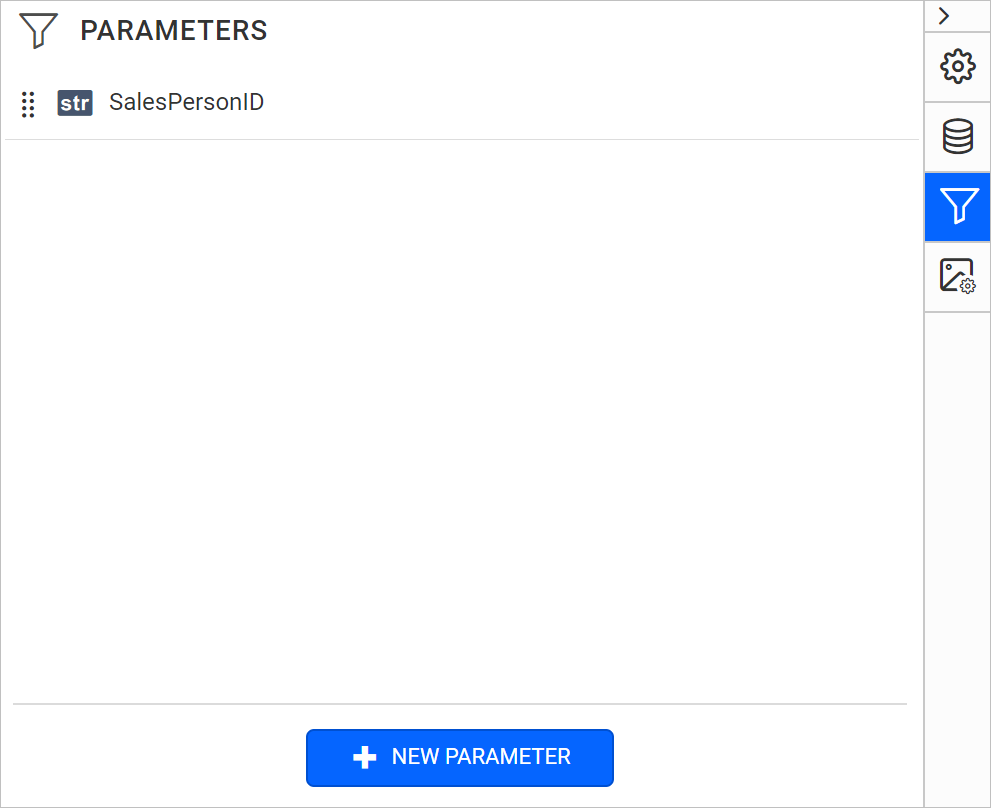
How do I design the subreport layout?
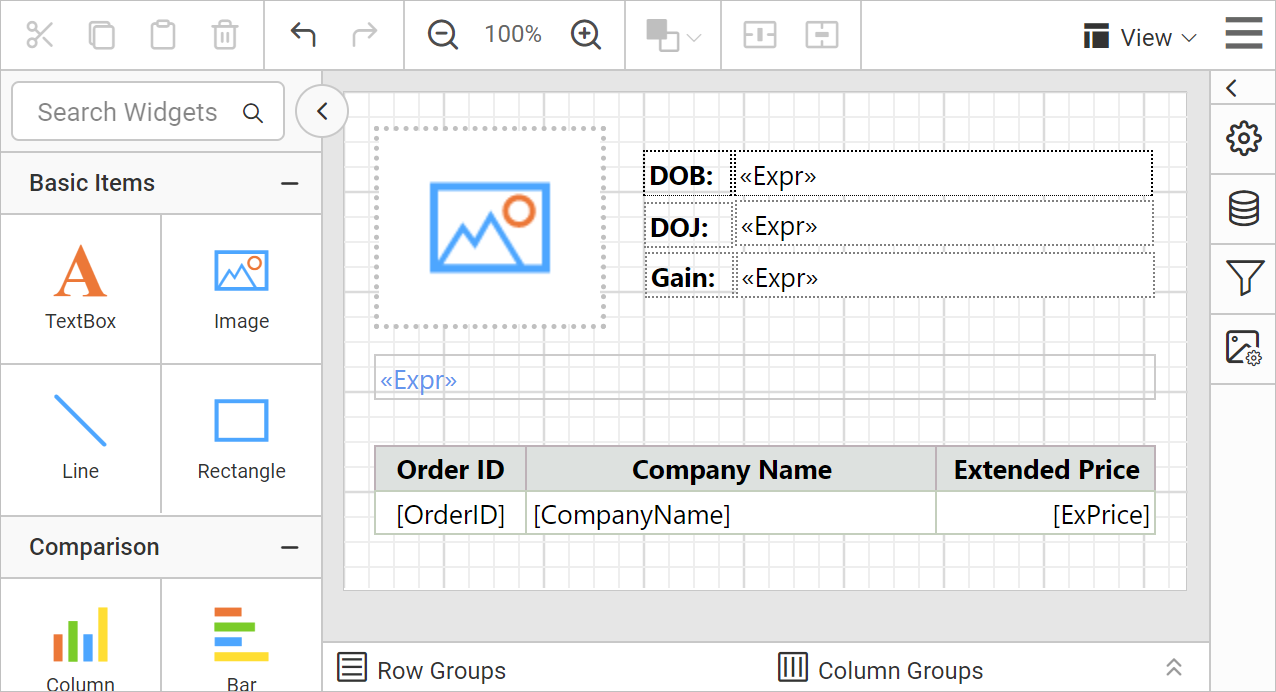
The sample subreport in the Web Report Designer is a simple design that uses image, textbox and table report items, as shown in the following image.
Note: Refer to the Image, Line, and Table sections to design the above subreport.
How do I assign fields in the subreport?
The subreport assigns fields in the Web Report Designer with the following expressions and datasets:
- To display the employee
DOB, the=First(Fields!BirthDate.Value,"EmployeePersonalDetails")expression is used in the textbox report item. - To display the employee
DOJ, the=First(Fields!HireDate.Value,"EmployeePersonalDetails")expression is used in the textbox report item. - To display the employee
GAIN, the=Sum(Fields!TotalGain.Value,"EmployeePersonalDetails")expression is used in the textbox report item. - To display the employee
First NameandLast Name, the=First(Fields!FirstName.Value, "EmployeePersonalDetails")+" "+" "+First(Fields!LastName.Value, "EmployeePersonalDetails")expression is used in the textbox report item. - To present the sales details of the respective employee, the
EmployeeSalesDetailsdataset is assigned to the table report item. - To display the employee image in the report, the
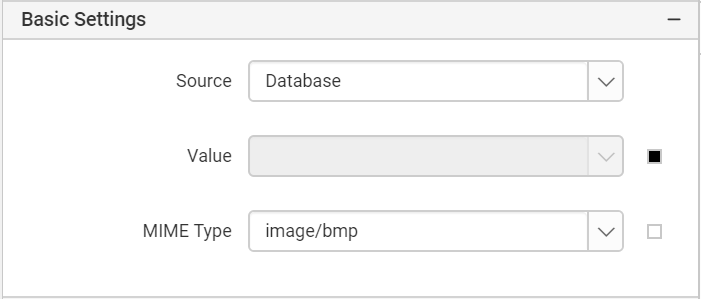
=First(Fields!Photo.Value, "EmployeeImages")expression is assigned to the image report item value property.
Download the side-by-side subreport design (RDL).
How do I link the subreport into the main report?
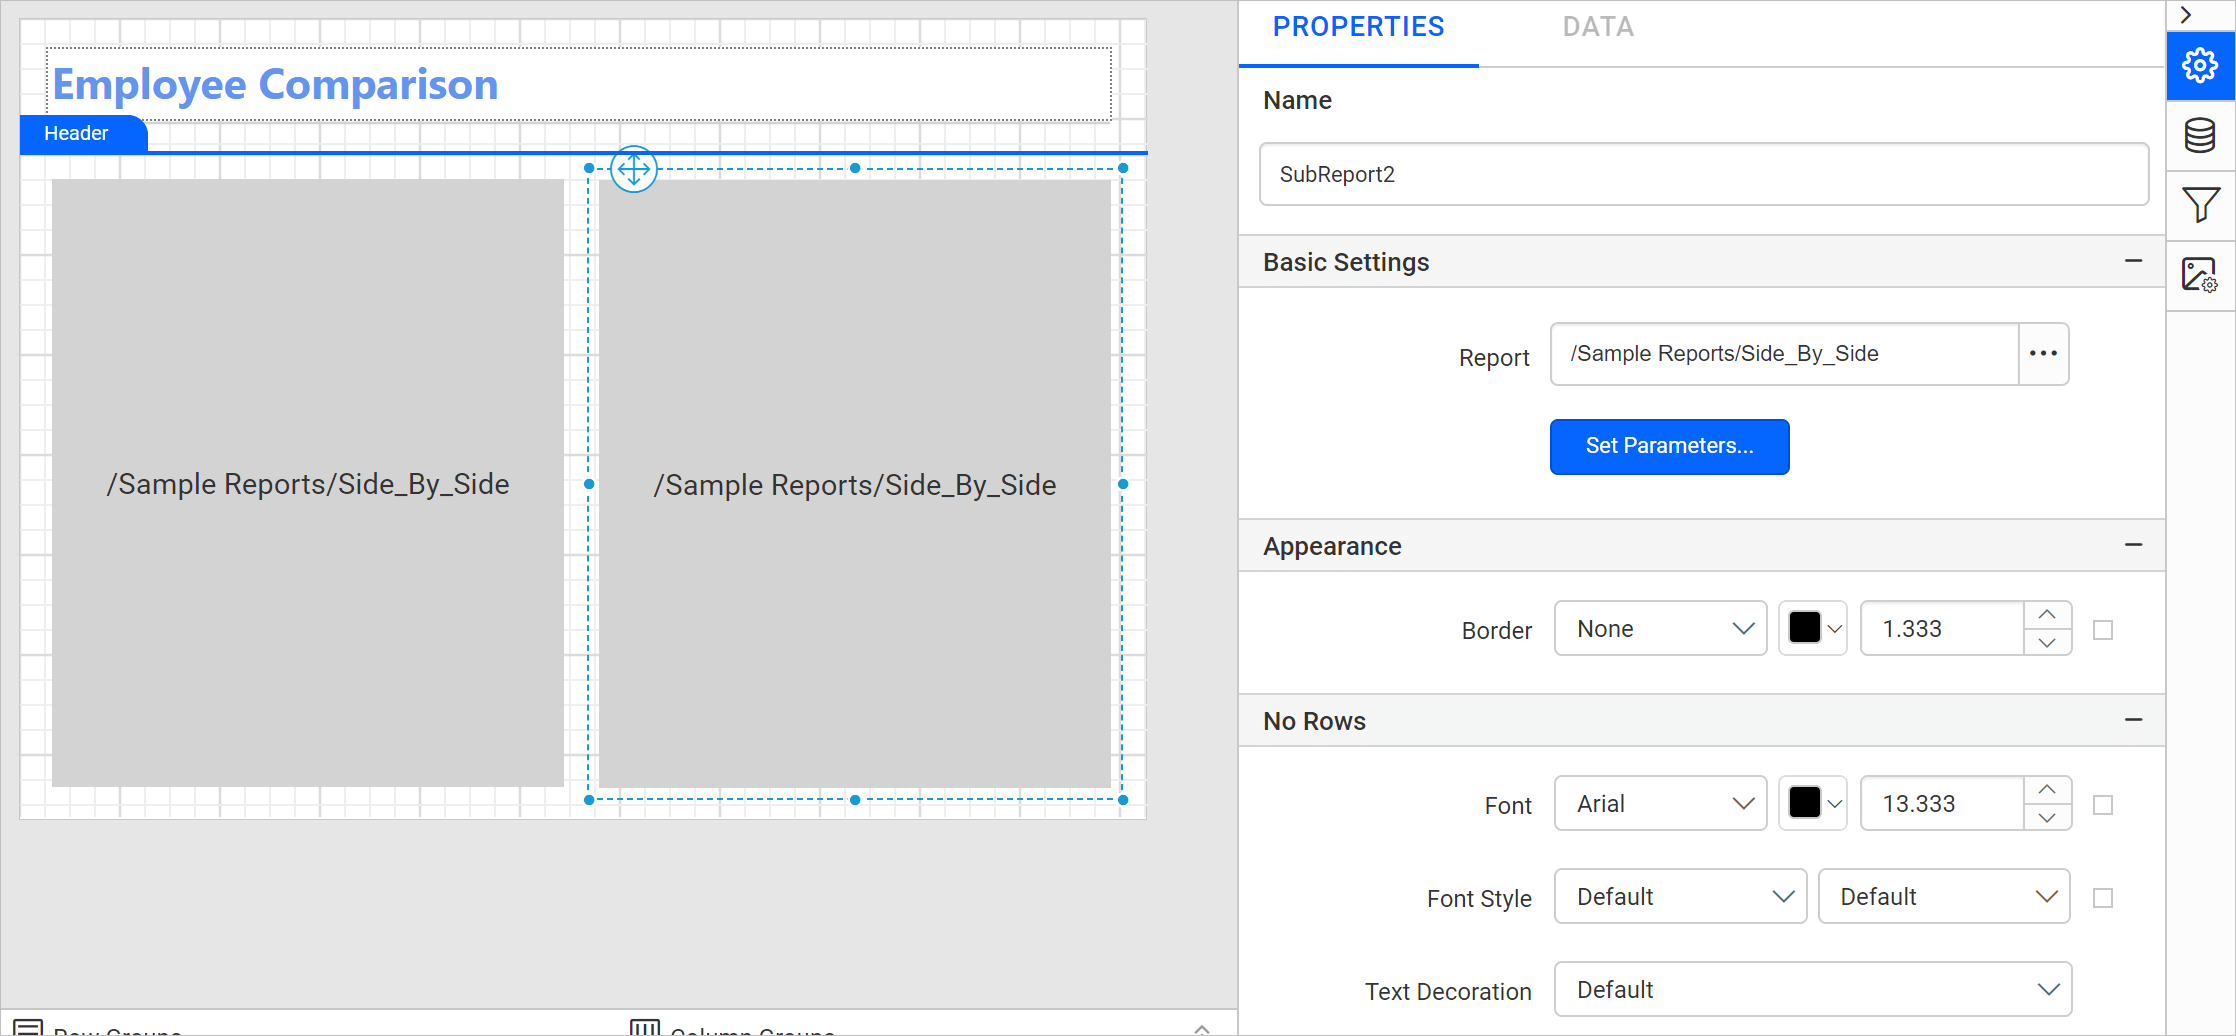
You link a subreport in the Bold Reports® Web Report Designer from the Report option in the properties panel. After you drag and drop the subreport item into the design area, its item properties are listed in the properties panel.
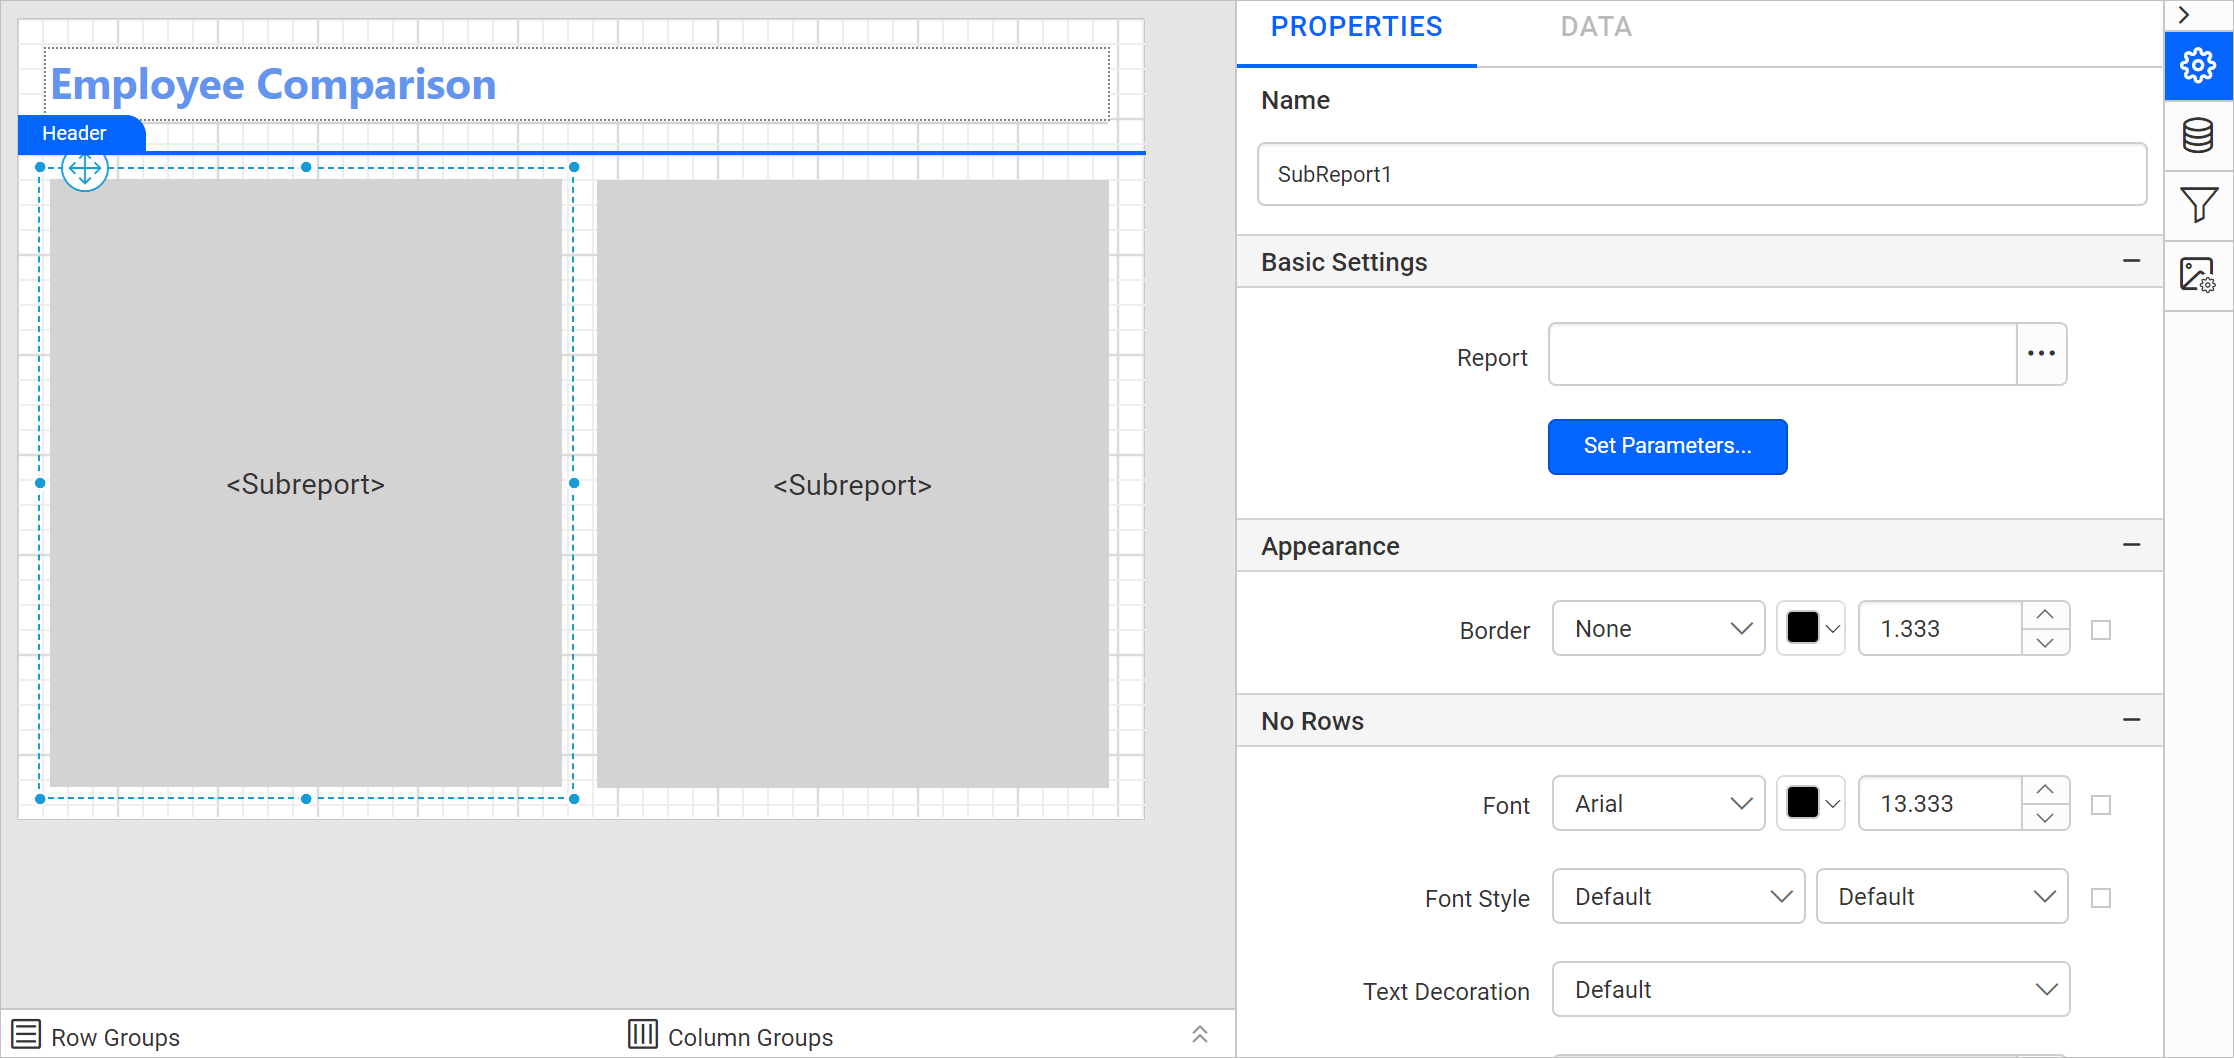
Follow these steps to link the subreport into the main report:
-
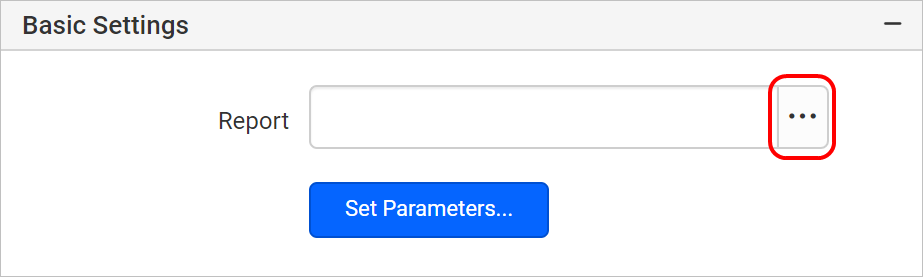
Click the browse button in the Report option.
-
In the Browse dialog that opens, click the Sample Reports folder.
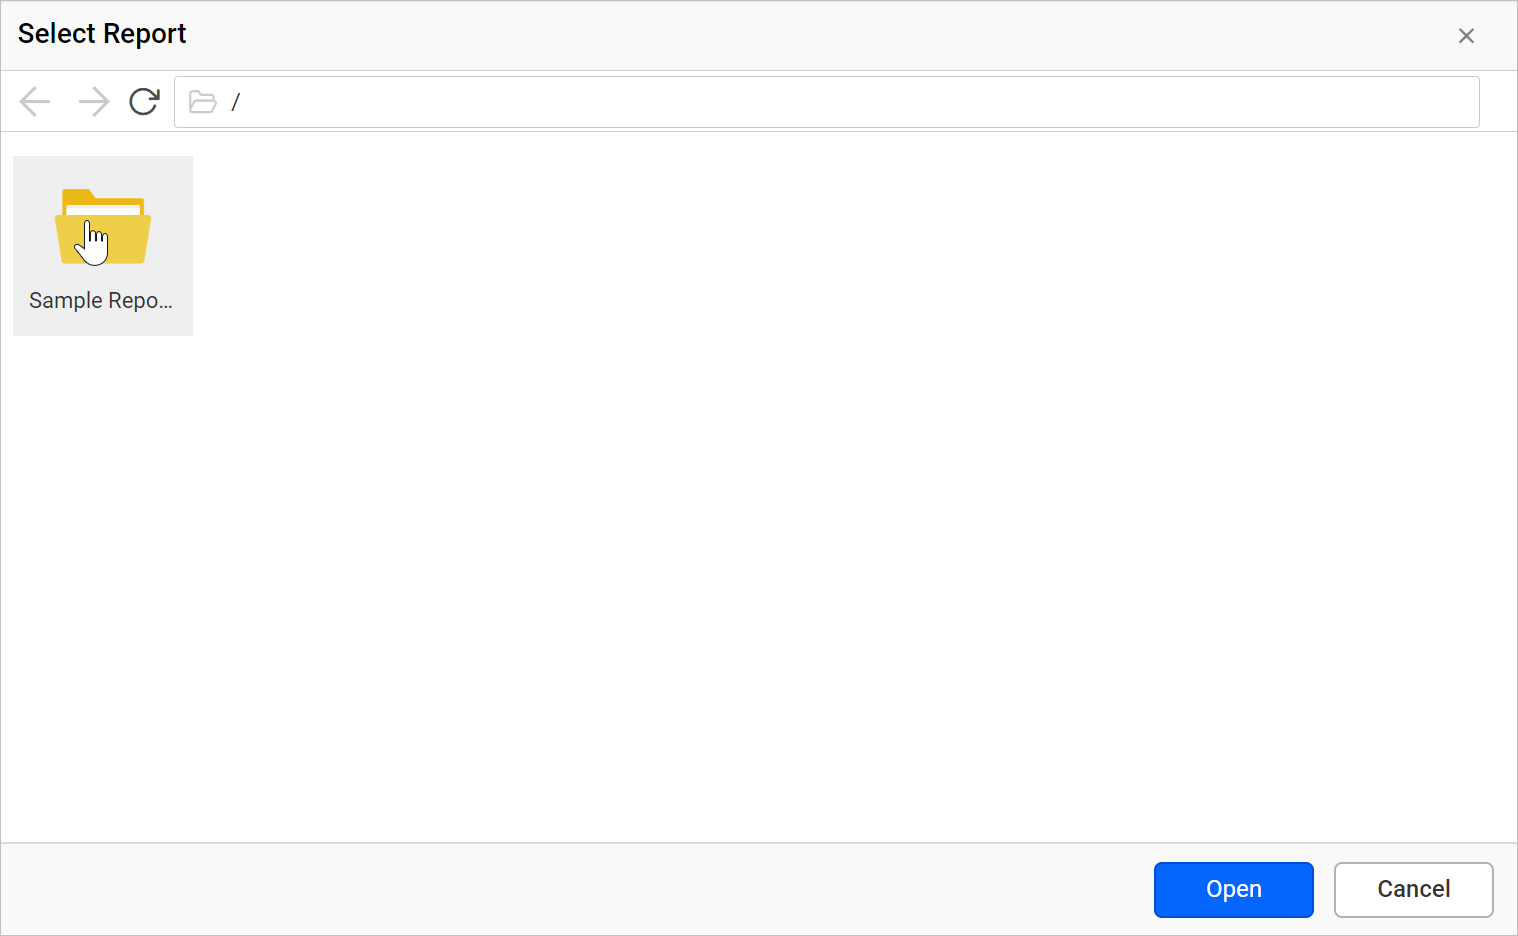
-
Select the already designed subreport and click Open.
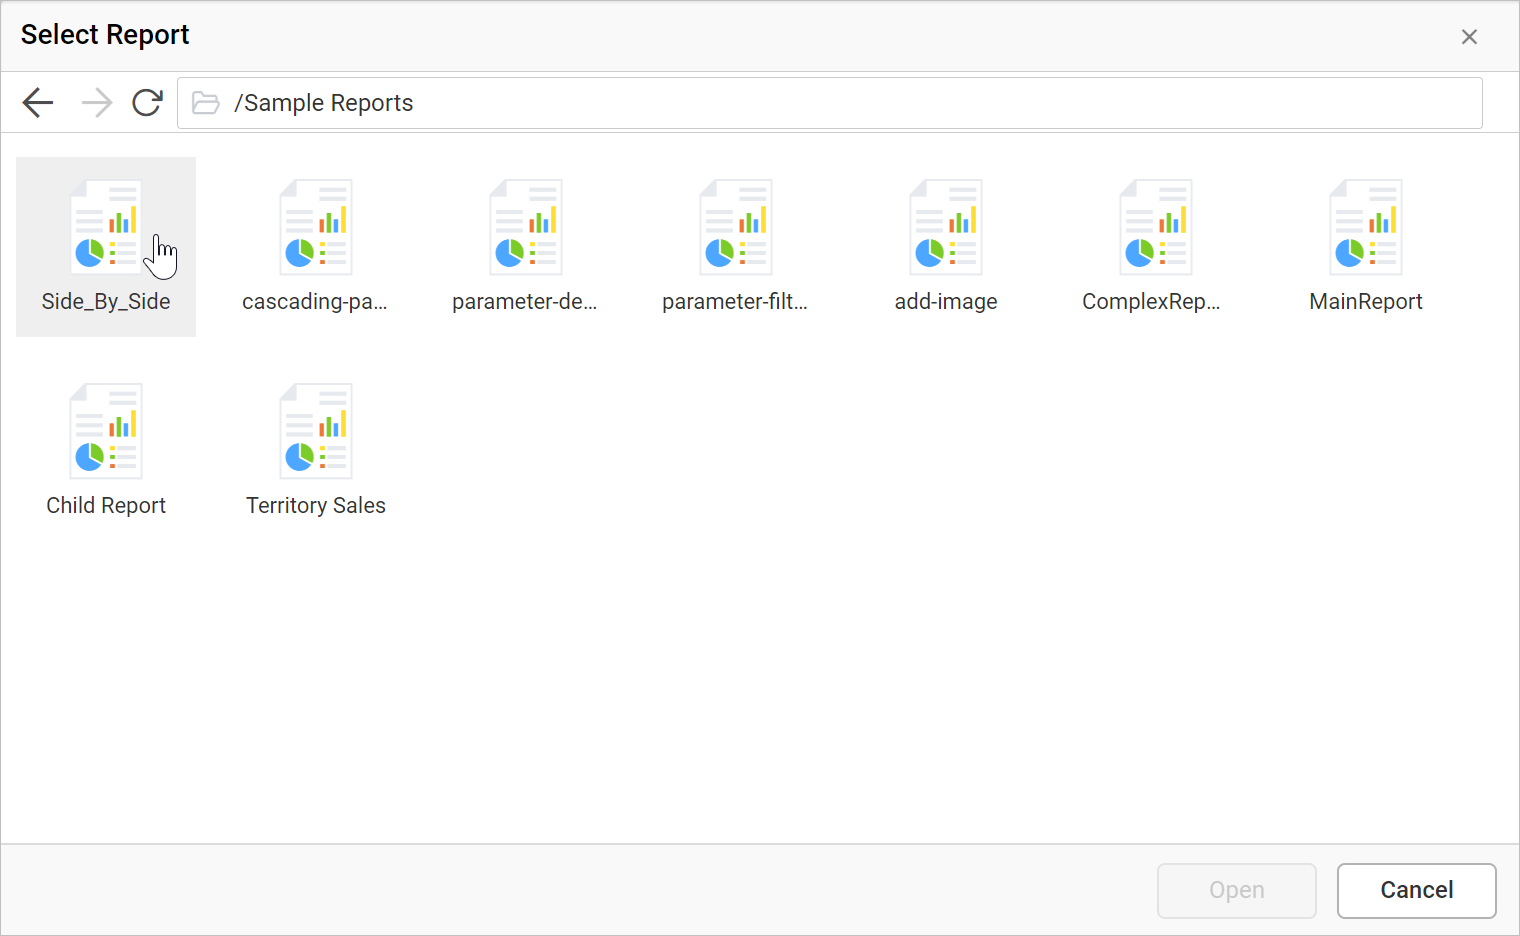
-
Check that the selected report path is linked in the Report option and the subreport item in the design area.
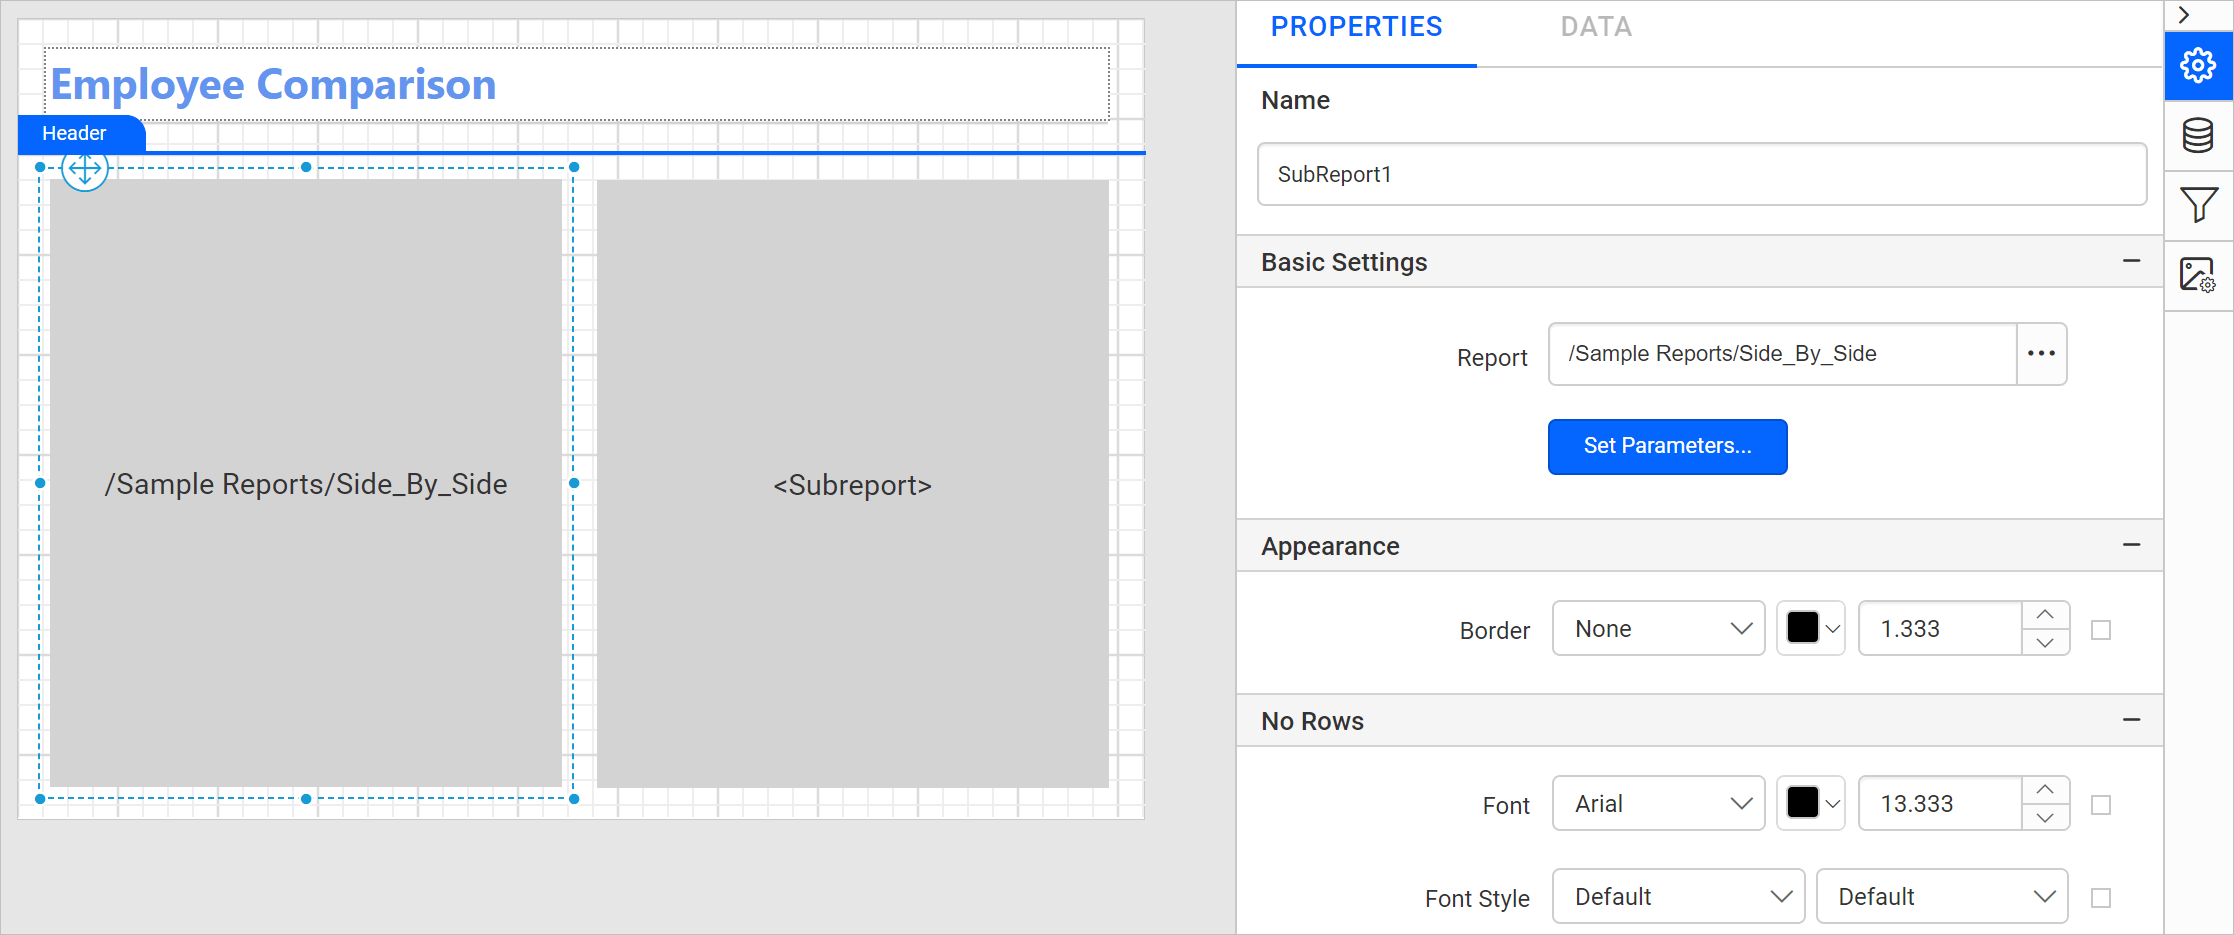
Set the report path for the other subreport item by following the same steps.
How do I set parameter values for the subreport?
You pass parameter values from the main report to the subreport in the Bold Reports® Web Report Designer with the Set Parameters option. Follow these steps:
- Click the Set Parameters button and click the ADD icon.
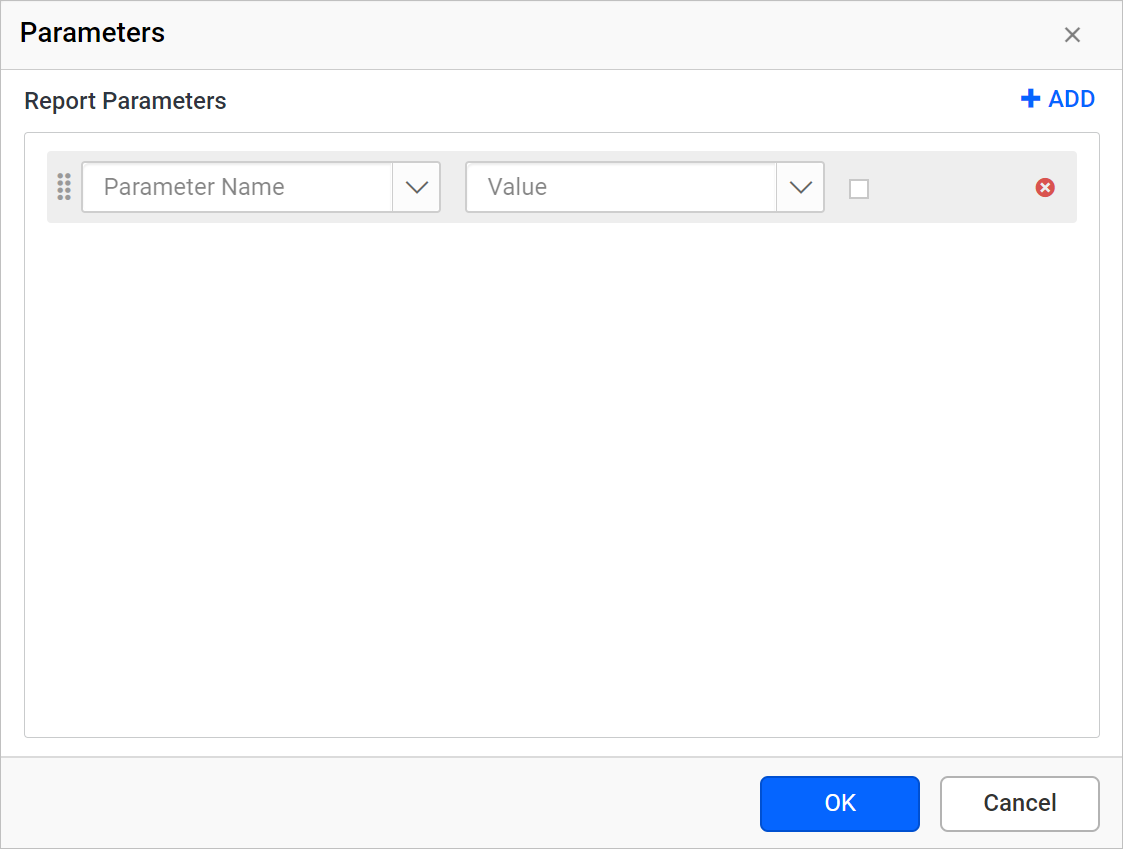
- Choose the parameter name in the
Parameters Namedrop-down, which lists the available parameters in the subreport, and assign values. Here, the expression=Parameters!Employee-A.Valueis assigned to theSalesPersonIDparameter of the subreport.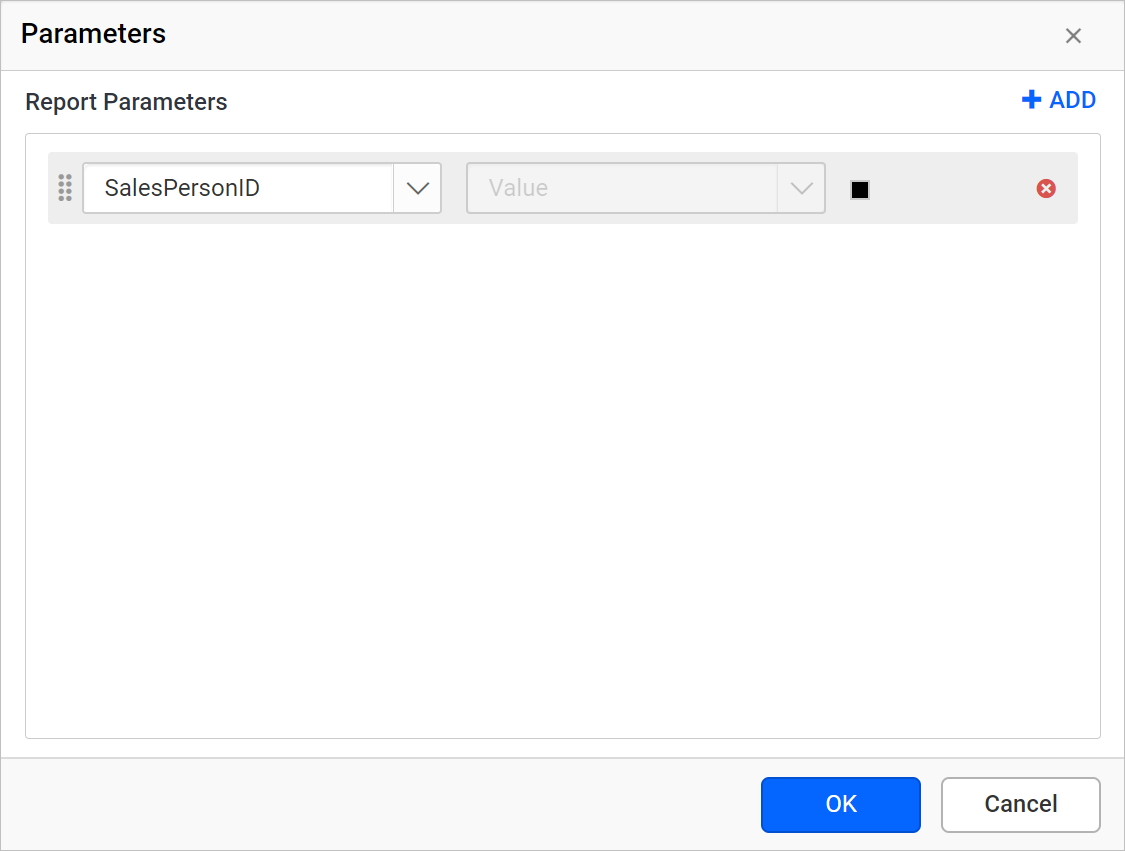
- Set the parameter name and assign values for the other subreport item by following the same steps.
The report path and parameters are now set for both subreport items, as shown in the following image.
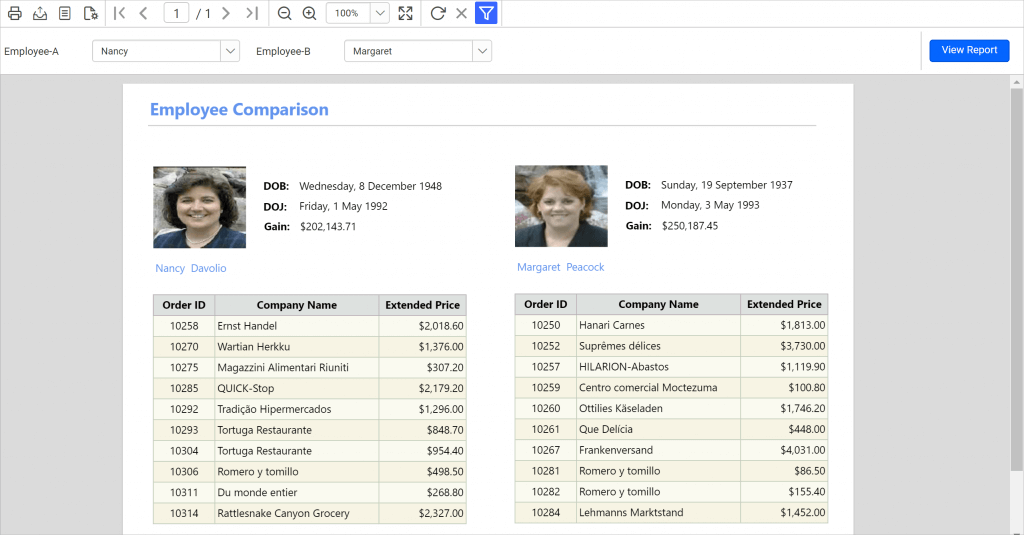
Preview the report, choose the required employee names in the Left Side Employee and Right Side Employee parameter drop-downs, and click view report. The report preview shows the comparison report for the two employees based on the values selected in the parameter drop-downs.
Download the main report design (RDL).
Frequently asked questions
Do I have to create the subreport parameter manually?
No. Based on the @SalesPersonID query parameter in the dataset query, an equivalent report parameter is created automatically in the report.
How does the main report pass a value to the subreport?
The main report passes values through Set Parameters. In this sample, =Parameters!Employee-A.Value is assigned to the SalesPersonID parameter of the subreport.