Design a map using a custom rule in Bold Reports®
You can design a map in the Bold Reports® Web Report Designer with a custom color rule and custom distribution. The example map displays the annual gross domestic product (GDP) growth rate of each country for 2019, like a heat map.
How do I create the data set?
You create the data set for the map in the Bold Reports® Web Report Designer from a JSON file. Follow these steps:
- In the data panel, click
New Data.
- Choose the
JSONconnection type.
- Choose
FileasType.
- Click the upload button, then browse and upload the JSON file in the
File Pathfield.
- Click the
Connectbutton. - In the query builder, the available fields in the JSON file are loaded under the default table name,
Result.
- Drag and drop the
Resulttable and execute.
- Modify the data set
Nameand click Finish.
Note: Download the World GDP growth sample JSON file. This data is downloaded from Data world bank.
How do I add a map to the report design?
The Map report item in the Bold Reports® Web Report Designer is listed under the Data Regions category in the item panel.

To add a Map report item to the report, drag the map from the item panel into the design area.

The map item is rendered in the design area, and the map properties are listed in the properties panel.

By default, map report item renders with world map shapes.
How do I bind analytical and shape data?
You bind analytical and shape data in the Bold Reports® Web Report Designer from the Basic Settings category of the properties panel. Follow these steps:
-
Under the Basic Settings category, choose the data set in the DataSet property.

-
Click the edit icon for the Binding Data property under Basic Settings.

-
Match the analytical and shape data as described in Binding Data. Choose name in the Field Name drop-down and choose the =Fields!Country.Value expression in Binding Expression.

-
Click Update.
How do I customize the map appearance?
You customize the map title, legend, color settings, and other properties in the Bold Reports® Web Report Designer properties panel.
Appearance
Under the Appearance category in the Bold Reports® Web Report Designer, set the border width and color properties as required.

Title
Under the Title category in the Bold Reports® Web Report Designer, set the title text, position, and font properties for the map title. First, enable the Enable Title check box. Then, add the title and position.

Legend
Under the Legend category in the Bold Reports® Web Report Designer, enable the Enable Legend check box. Set the following values:
- Background color as White.
- Position as BottomCenter.
- Legend mode as Interactive.
=Fields!IndicatorName.Valueas the expression for Title.

Shape settings
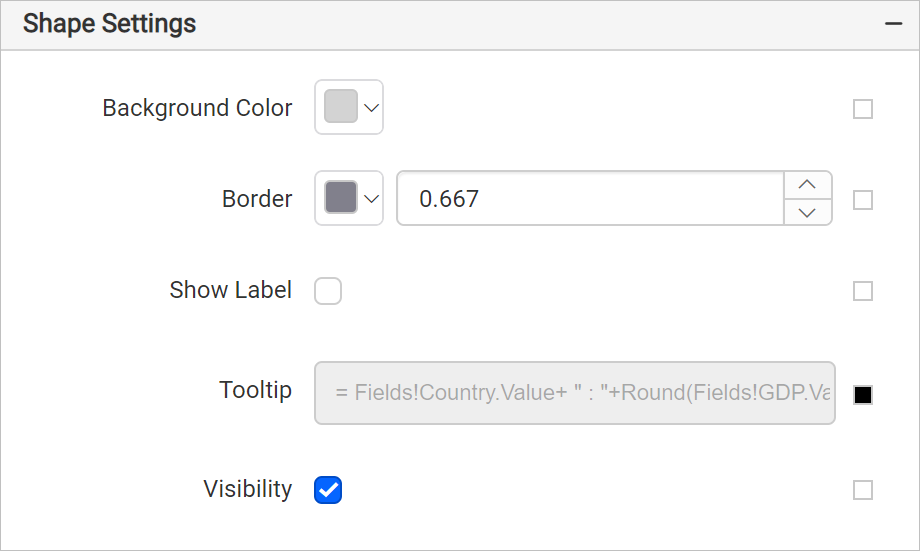
Under the Shape Settings in the Bold Reports® Web Report Designer, set the following values:
- Border color as
#81808cand width as0.667px. - Tooltip as the
= Fields!Country.Value + " : "+ Round(Fields!GDP.Value, 3)expression.
Shape color rule
Under the Shape color rule category in the Bold Reports® Web Report Designer, enable the Enable Color Rule check box. Then, set the following values:
- Choose Sum(GDP) in Data Value.
- Choose Custom as the Type. Following the Custom colors section, set these color codes in the custom colors panel: #cfedfb, #aadee8, #9cd2ed, #70bdff, and #4d739e.
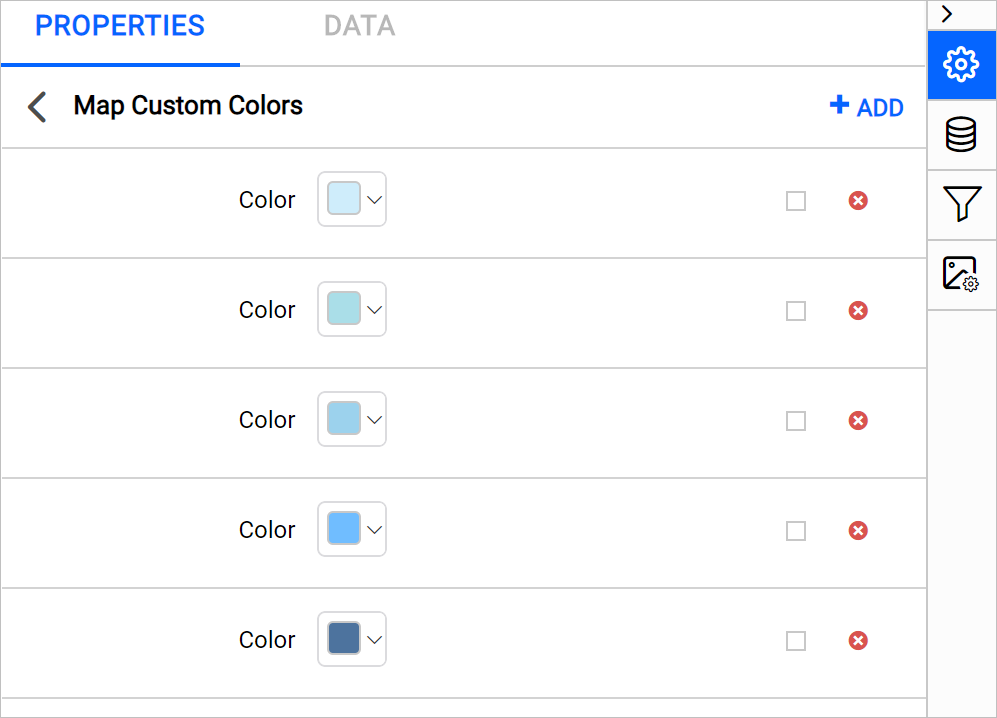
- Choose Custom for Distribution type. Indicate your own number of data ranges to decide the distribution of values.
- Following the Custom distribution section, define the custom range as follows:

The shape color rule configuration looks like the following image.

The colors are now applied to the map shapes, but with sample data.
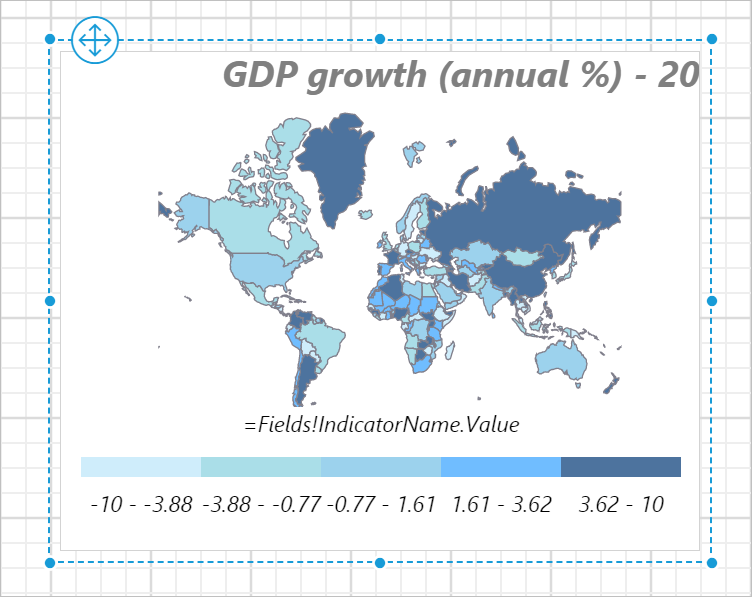
To see the actual data on the map surface, preview the report. Before that, resize the width and height of the map so you can view the information clearly in preview.

Preview report
You can preview the report at design time using the built-in Bold Reports® Viewer to make sure the report design is as expected. In preview mode, hover over each shape on the map surface to see the country name and GDP growth rate. The following snapshot shows the color distribution applied based on the GDP growth rate of countries.

Download the custom rule map report design (RDL).