Add Grouping and Totals
The following steps guides you to design ssrs rdl report to add grouping and totals in tablix data region.
Prefer watching over reading? Check out this video for adding grouping and totals in a tablix data region:
Create dataset
To present data in the tabular format, create a dataset and bind data to the tablix data region. In this designing section, the following dataset query is used for dataset creation.
SELECT Top 50  PC.Name AS ProdCat, PS.Name AS SubCat, DATEPART(yy, SOH.OrderDate) AS OrderYear, 'Q' + DATENAME(qq, SOH.OrderDate) AS OrderQtr,SUM(SOD.UnitPrice * SOD.OrderQty) AS Sales
FROM Production.ProductSubcategory PS INNER JOIN
Sales.SalesOrderHeader SOH INNER JOIN
Sales.SalesOrderDetail SOD ON SOH.SalesOrderID = SOD.SalesOrderID INNER JOIN
Production.Product P ON SOD.ProductID = P.ProductID ON PS.ProductSubcategoryID = P.ProductSubcategoryID INNER JOIN
Production.ProductCategory PC ON PS.ProductCategoryID = PC.ProductCategoryID
WHERE (SOH.OrderDate BETWEEN '1/1/2002' AND '12/31/2003')
GROUP BY DATEPART(yy, SOH.OrderDate), PC.Name, PS.Name, 'Q' + DATENAME(qq, SOH.OrderDate), PS.ProductSubcategoryID
Refer Create Data section and create dataset using the above query.
AdventuresWorksdatabase is used here.
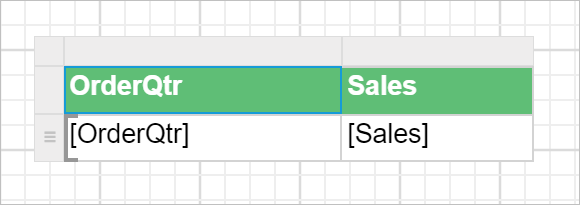
Simple table design
Create a simple table report design by following the steps provided in Table Design section.
Add group data
Parent row group
To add a first row group in the basic tablix structure follow the below steps.
- Select the tablix data region in the design area, now the
Grouping Panelwill be enabled in the design view.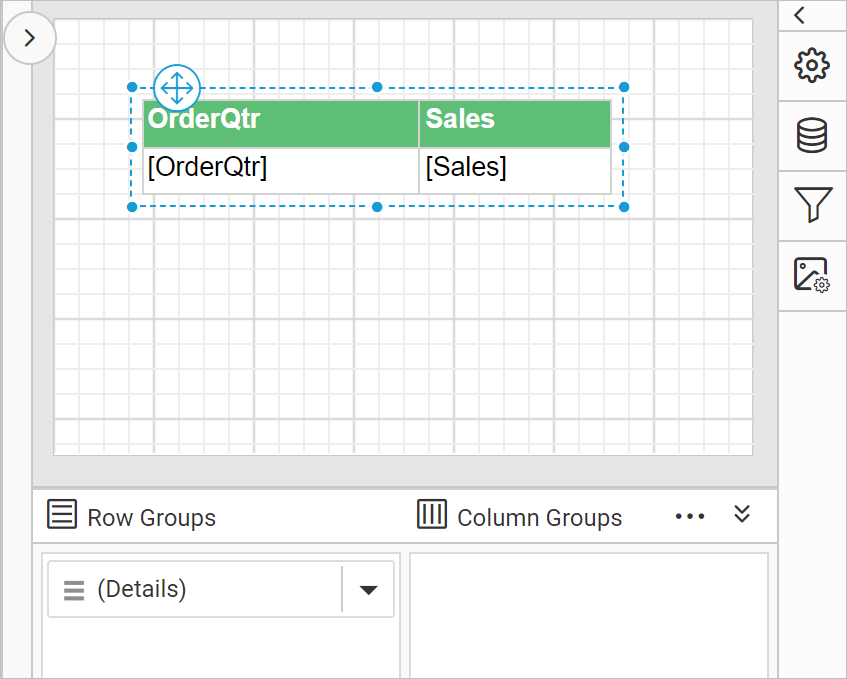
To add first row group in the basic tablix structure, use the group menu in grouping panel.
- To add a group, go to
Row Groupspane in grouping panel and open the context menu on theDetailsgroup field.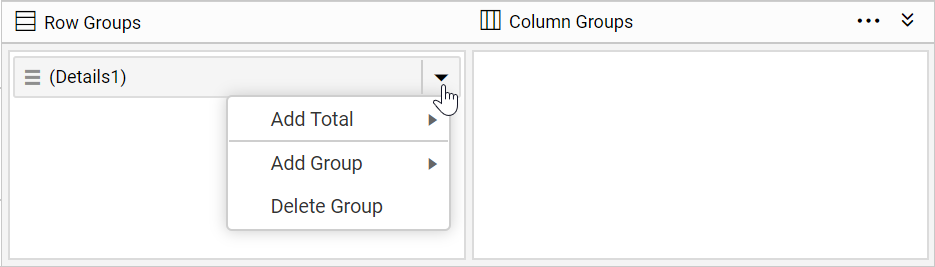
- From the context menu, click on
Parent Group...option underAdd Groupcategory.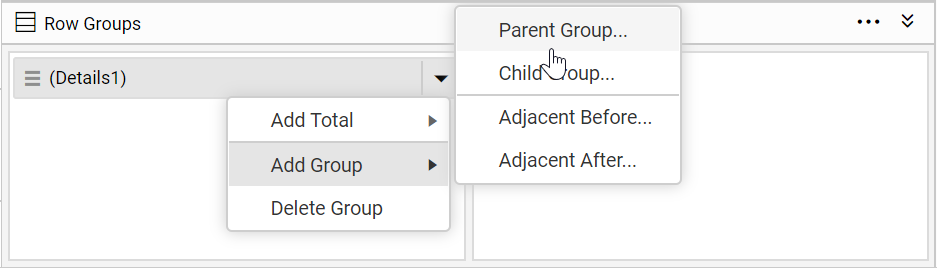
- Once you click on the
Parent Groupoption, aTablix Groupdialog will be opened to configure the grouping.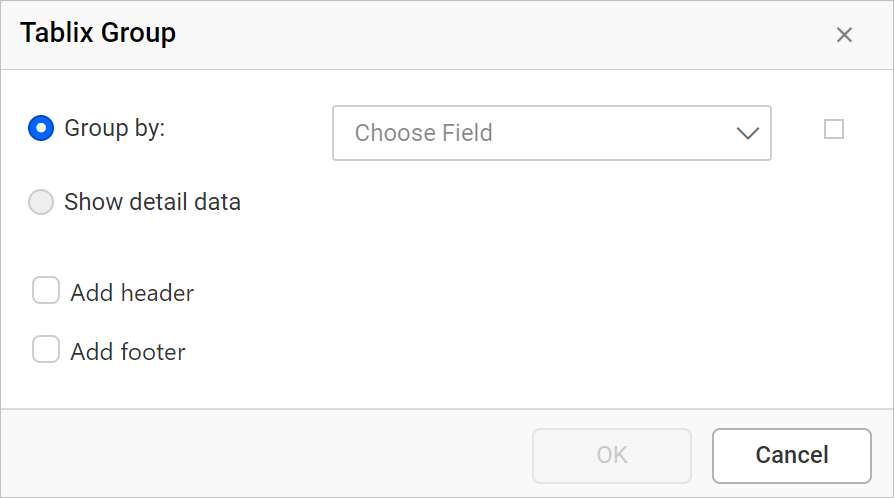
- Here,
Product Categoryfield is chosen as parent group in tablix data region. Click on theOKbutton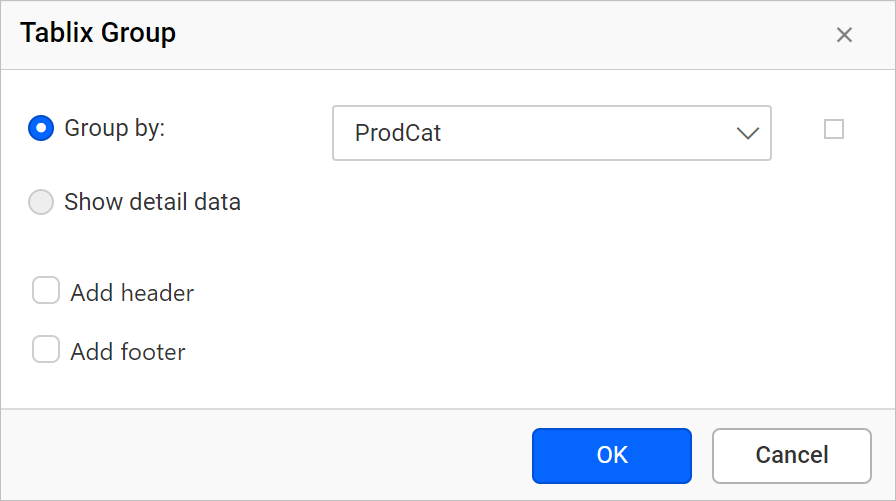
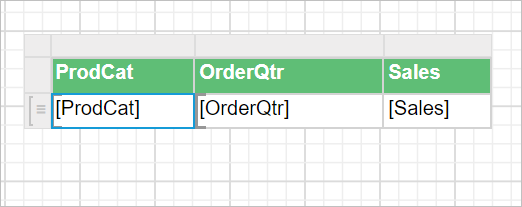
Now, a new column will be added to the right side of the detail group in tablix data region and a new group member will be added above the Detail group of Row Groups pane in grouping panel hierarchical view.
Child row group
- To add a child group, click on the
Child Group...option underAdd Groupcategory.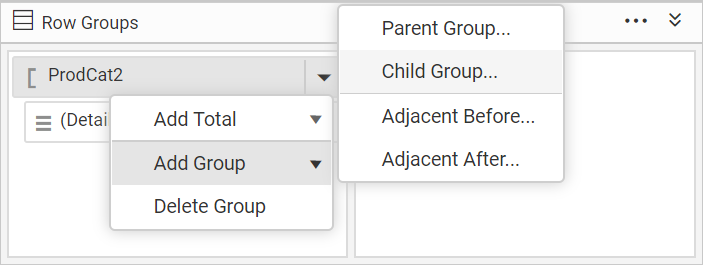
- Now,
Tablix Groupdialog will open like below.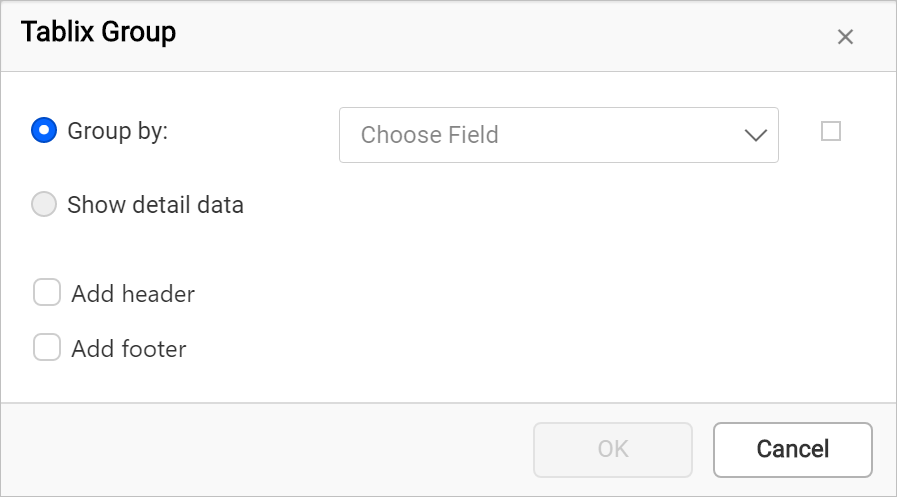
- Choose field in the group dialog and click
OKbutton.
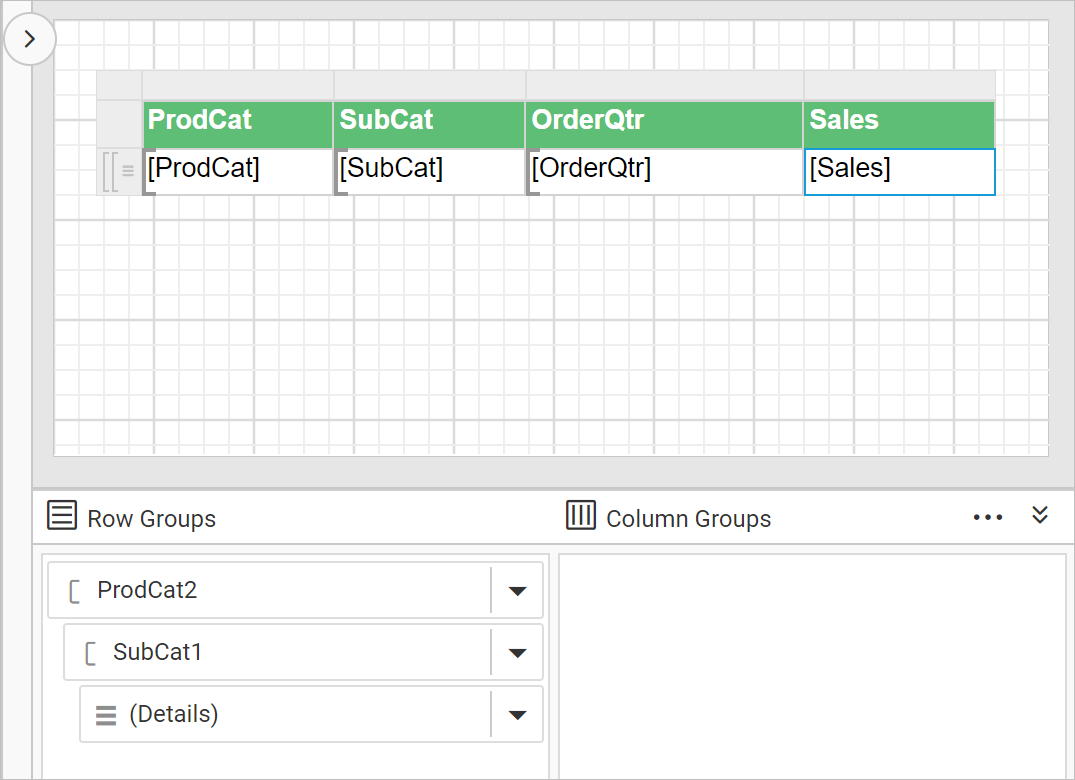
Now, a new column will be added to the right side of the Product Category row group in tablix data region and a new field will be added below of the Product Category group in hierarchical view of Row Groups pane in grouping panel.
Add Totals
Add total yearly sales of a product
In the below steps the total field is created to calculate the sum of sales of each sub category products.
- Right-click in the cell which contains
[Sales]expression, and click on theAdd Totalin the cell menu.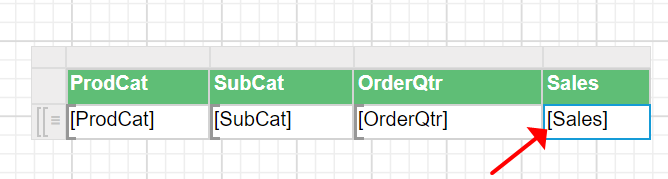
- Now, new row will be added inside of the
ProdCatgroup in the data region as shown below.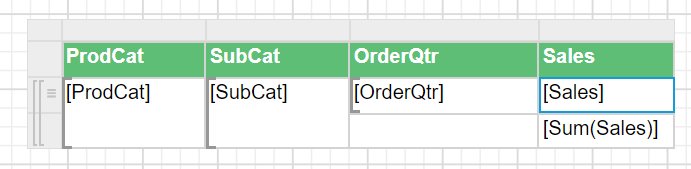
Add totals yearly sales of product category
Now to calculate the sum of yearly sales of each product category follow the below steps.
- Right-click in the third row, last cell of the data region that contains
[Sum(Sales)]expression, and click on theAdd Totalin the cell menu.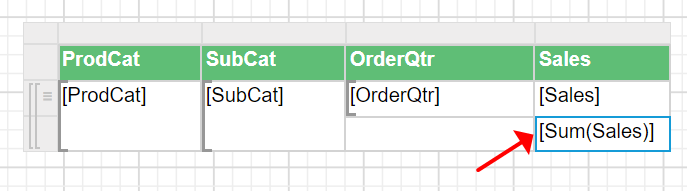
- Now, another new row will be added inside of the
ProdCatgroup in the data region as shown below.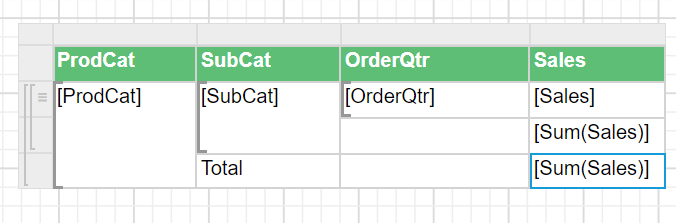
Add the grand total to the report
Now to calculate the grand total of over all product sales follow the below steps.
- Right-click in the fourth row, last cell of the data region that contains
[Sum(Sales)], and click on theAdd Totalin the cell menu.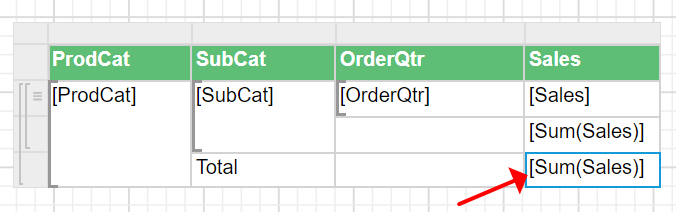
- Now, another new row will be added outside of the
ProdCatgroup in the data region as shown below.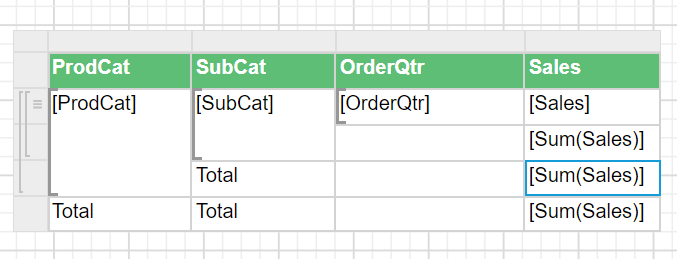
Edit cell content
Modify the each total representation text as shown below.
- Edit the third row, third column cell which contains
Totaltext and set the following expression= "Total yearly sales of " & Fields!SubCat.Valuein the expression builder.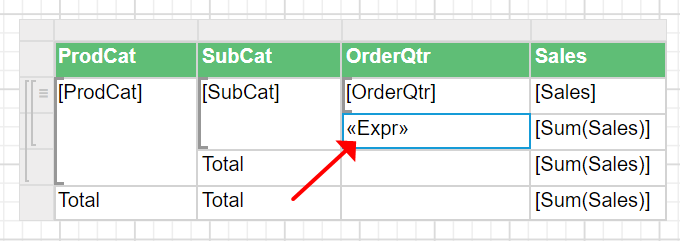
- Edit the fourth row, second column cell which contains
Totaltext and set the following expression= "Total yearly sales of " & Fields!ProdCat.Valuein the expression builder.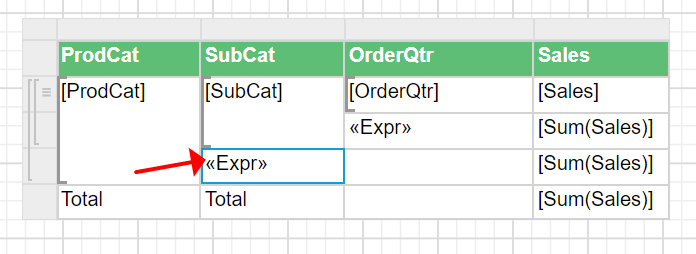
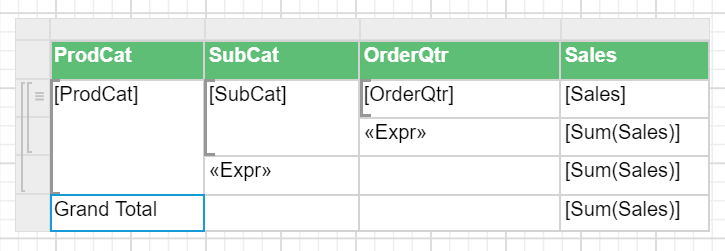
- Remove the
Totaltext value from the fifth row, second column cell.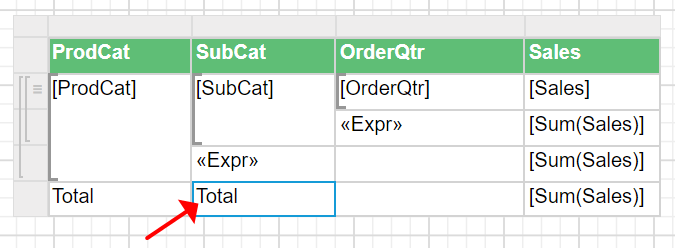
- Edit the fifth row, first cell content as
Grand Total. Now the table design will look like below.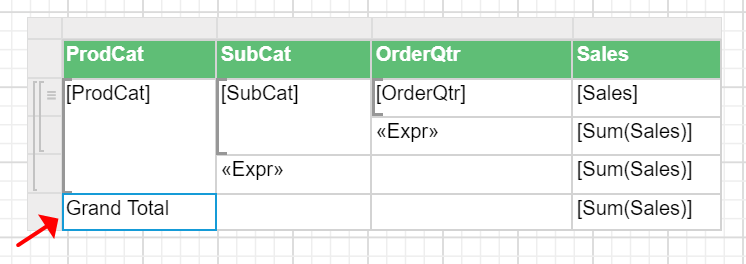
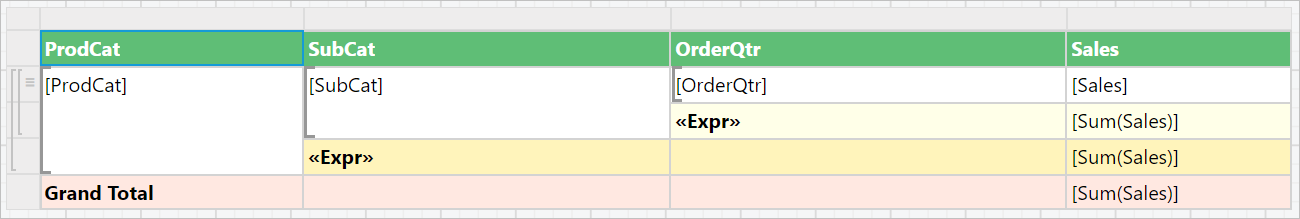
Now, the final design will look like below:
Format total row
In the below design Background color of the total column is set with three different colors . This will differentiate the totals at details level, and product category Level. Set the font weight of the expression fields as Bold to improvise the table design. Also the background color of the tablix header row is changed to improvise the report presentation.
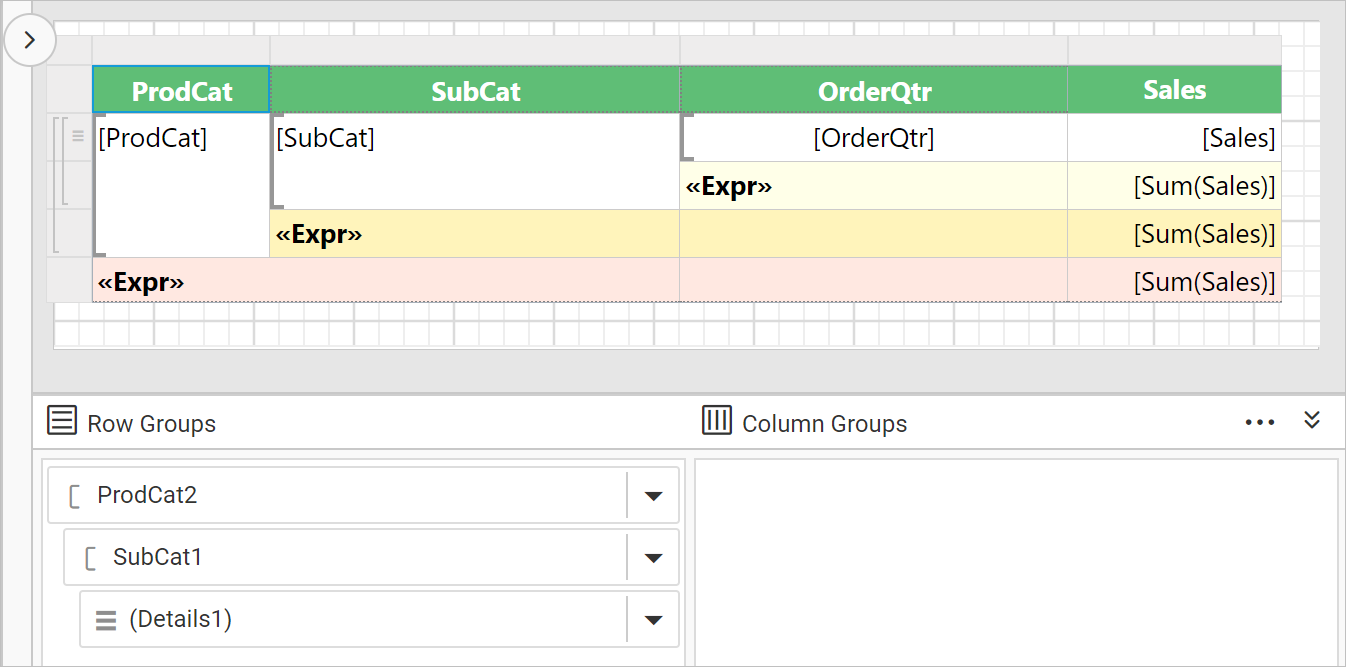
Design and preview
The final report design will look like below:
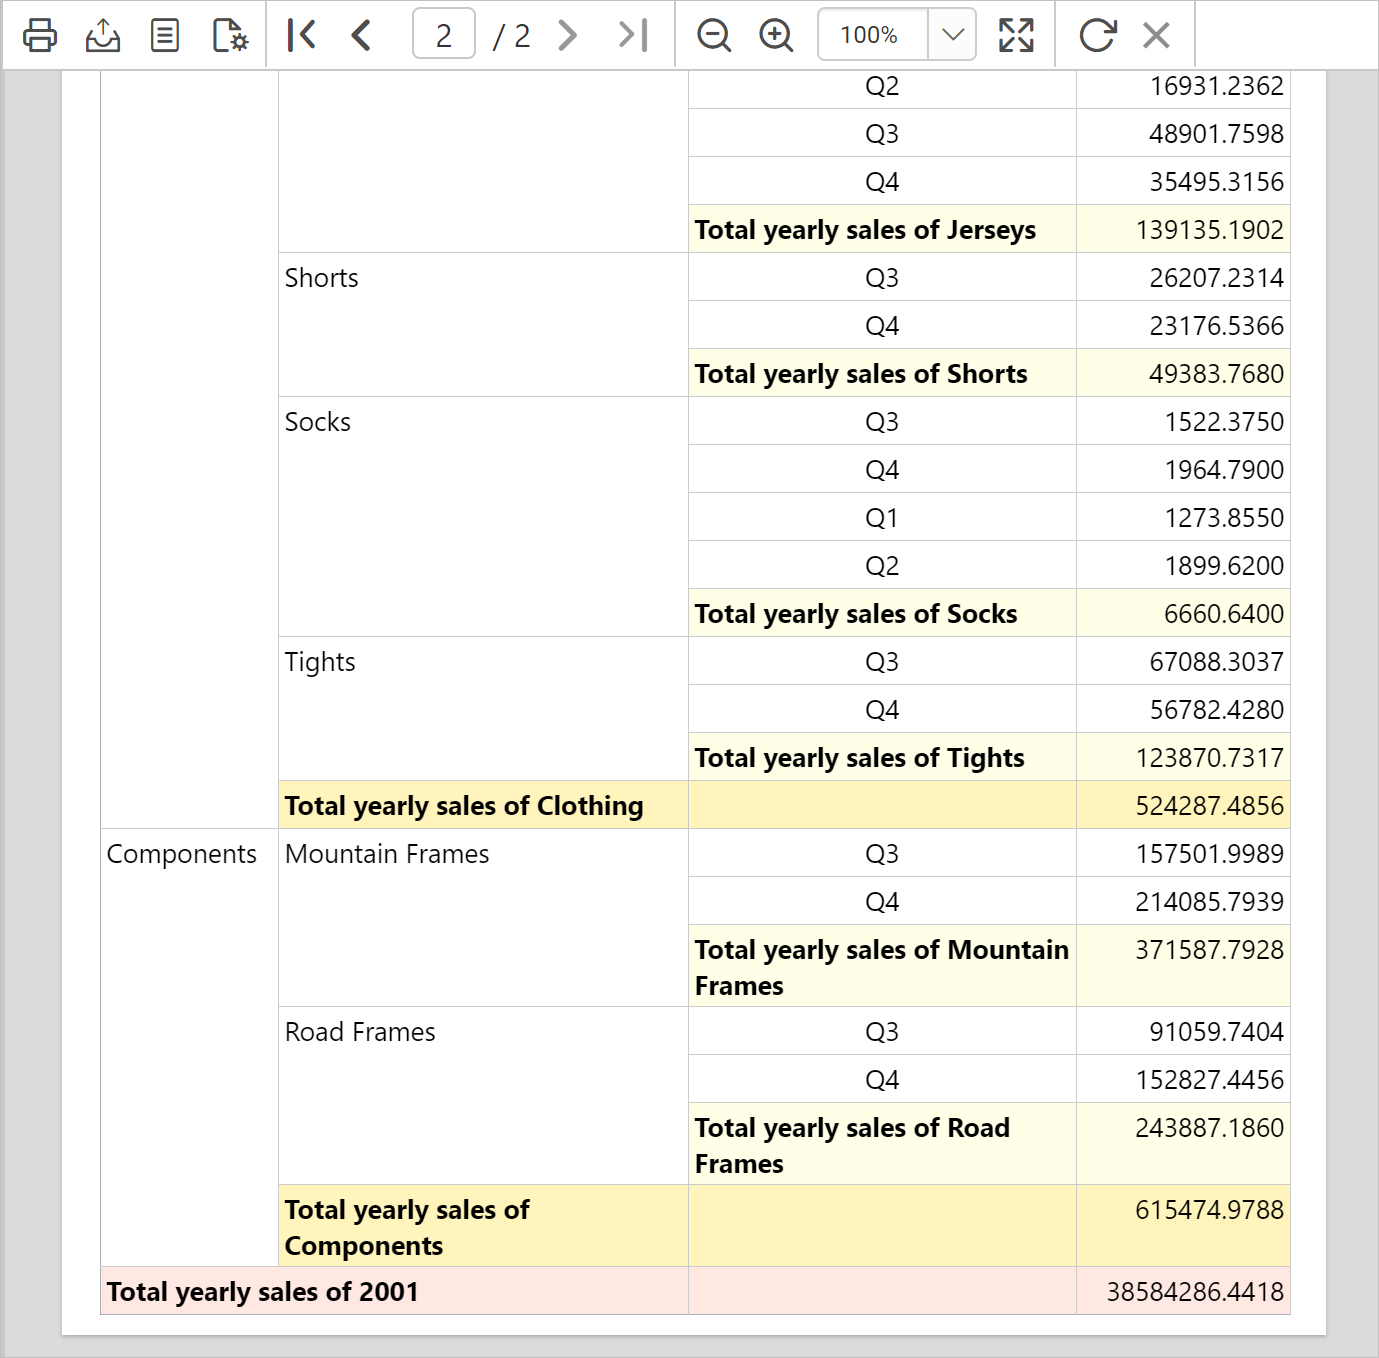
On report preview, the total yearly sales of each product, product category and grand totals at details group level will be displayed like below.
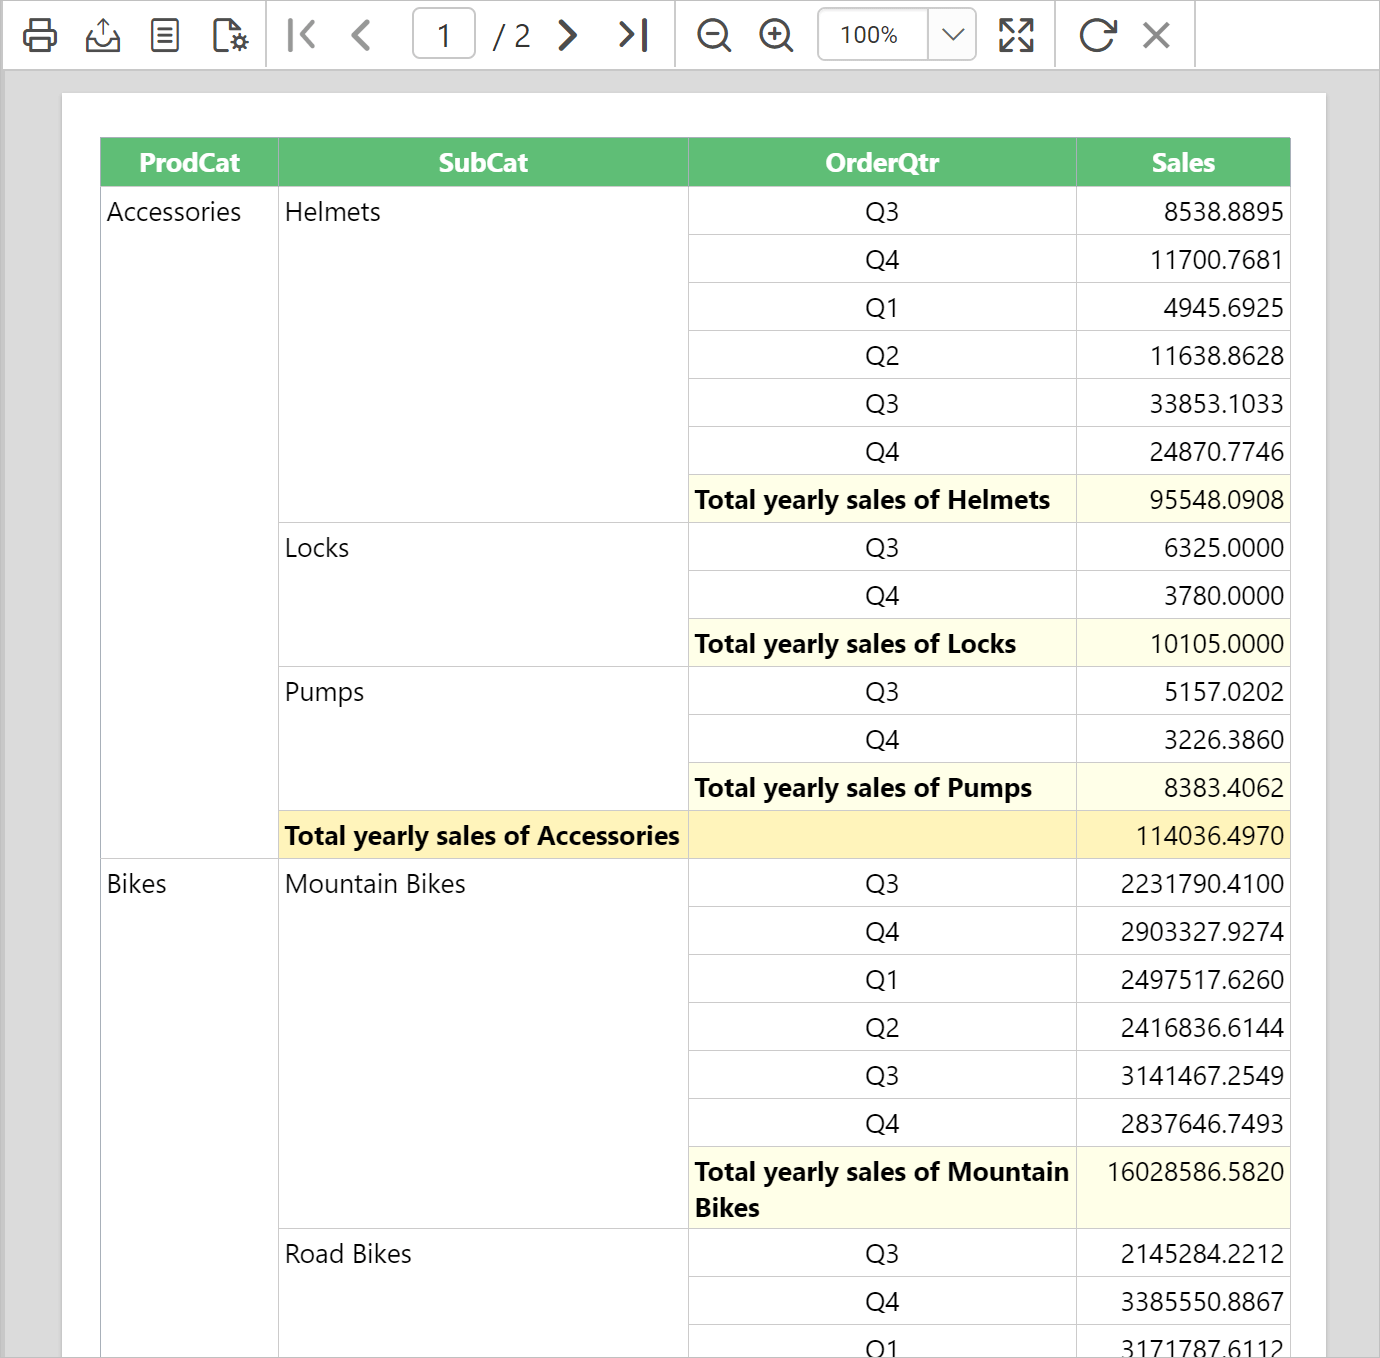
Navigate to the last page of the report in preview. The grand total details will be displayed at the end of the report like below.
Download the above report design from link.