Add filters to tablix data region
Filters can be used to filter data in the tablix data region or a data region group to include or exclude specific values from display or to provide a different view of the dataset in multiple data regions. When processing the report, the filters applied in the report parts are processed first on the dataset, and then on the data region, and then on groups.
Set filter on tablix data region
- Select tablix data region in the design area.
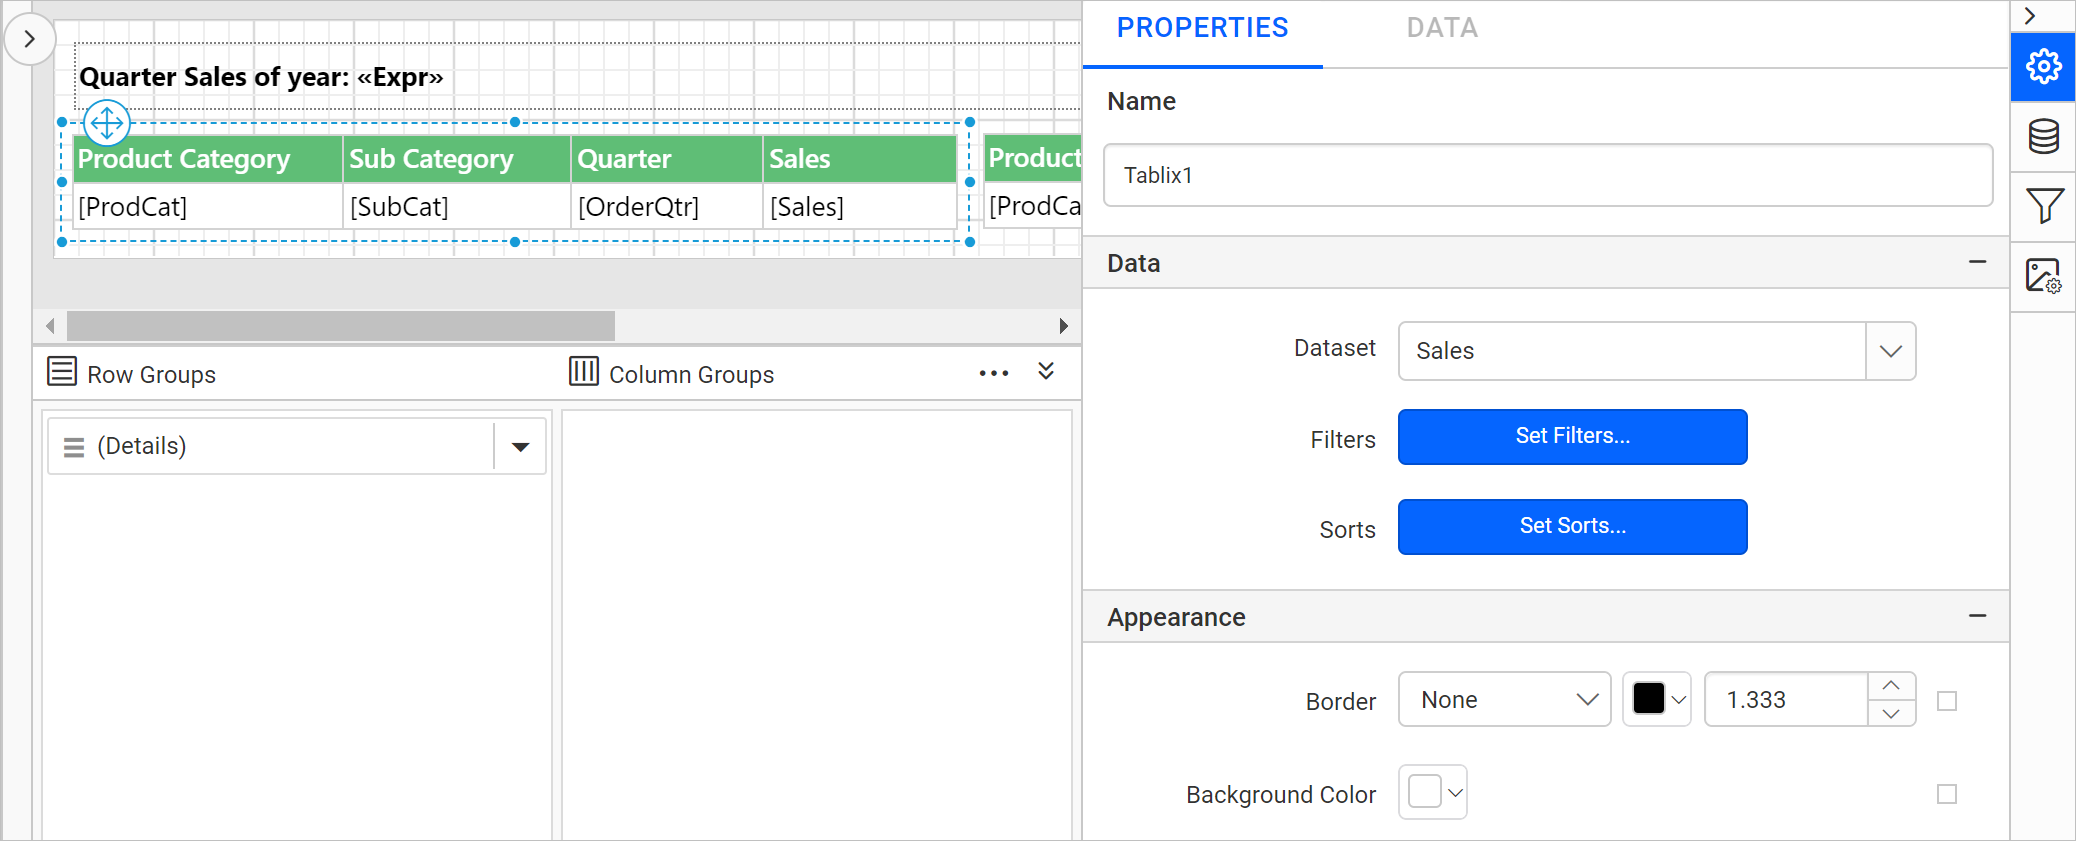
- In the properties panel, click on the
Set Filters...button. Now, the filter dialog will be opened like below.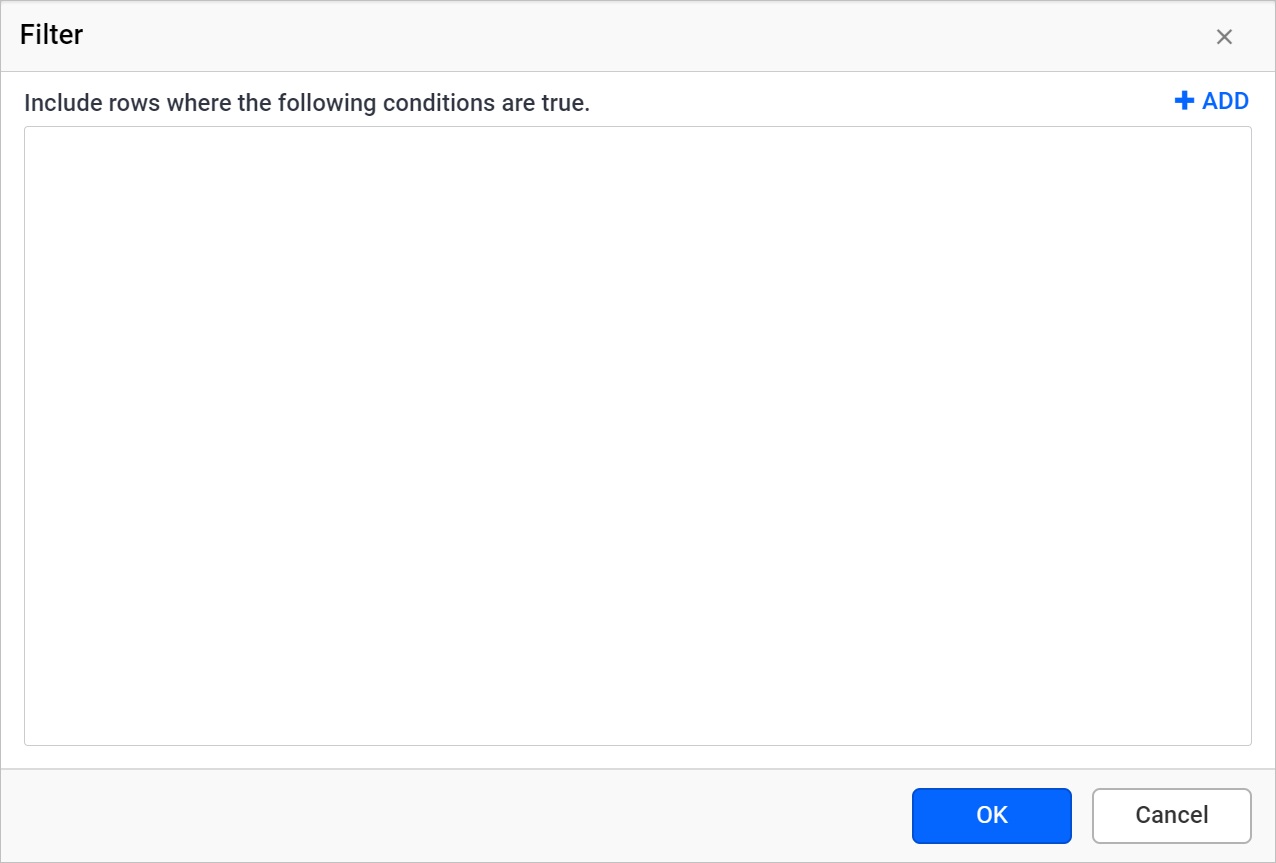
- Refer Filter Data section and create required filter expression in the filter dialog and click
OK.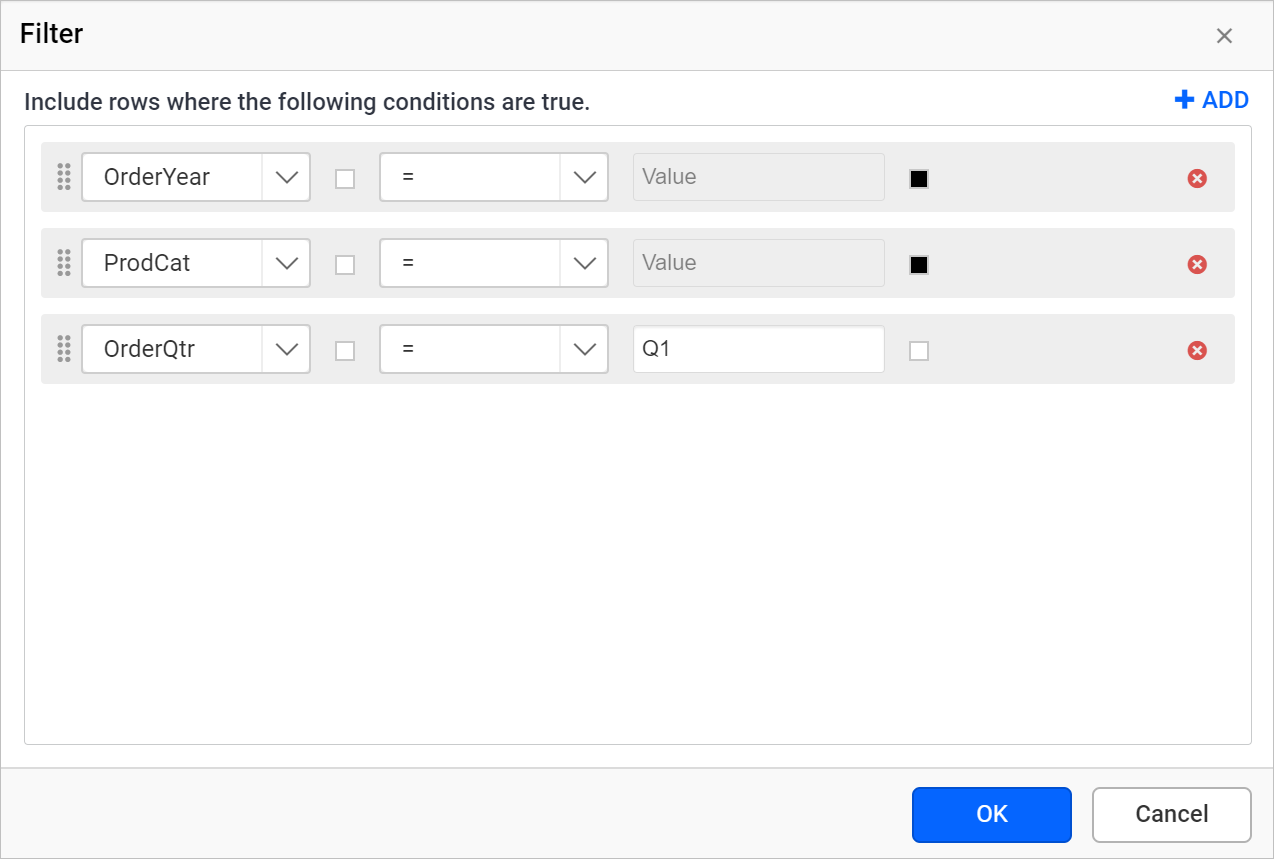
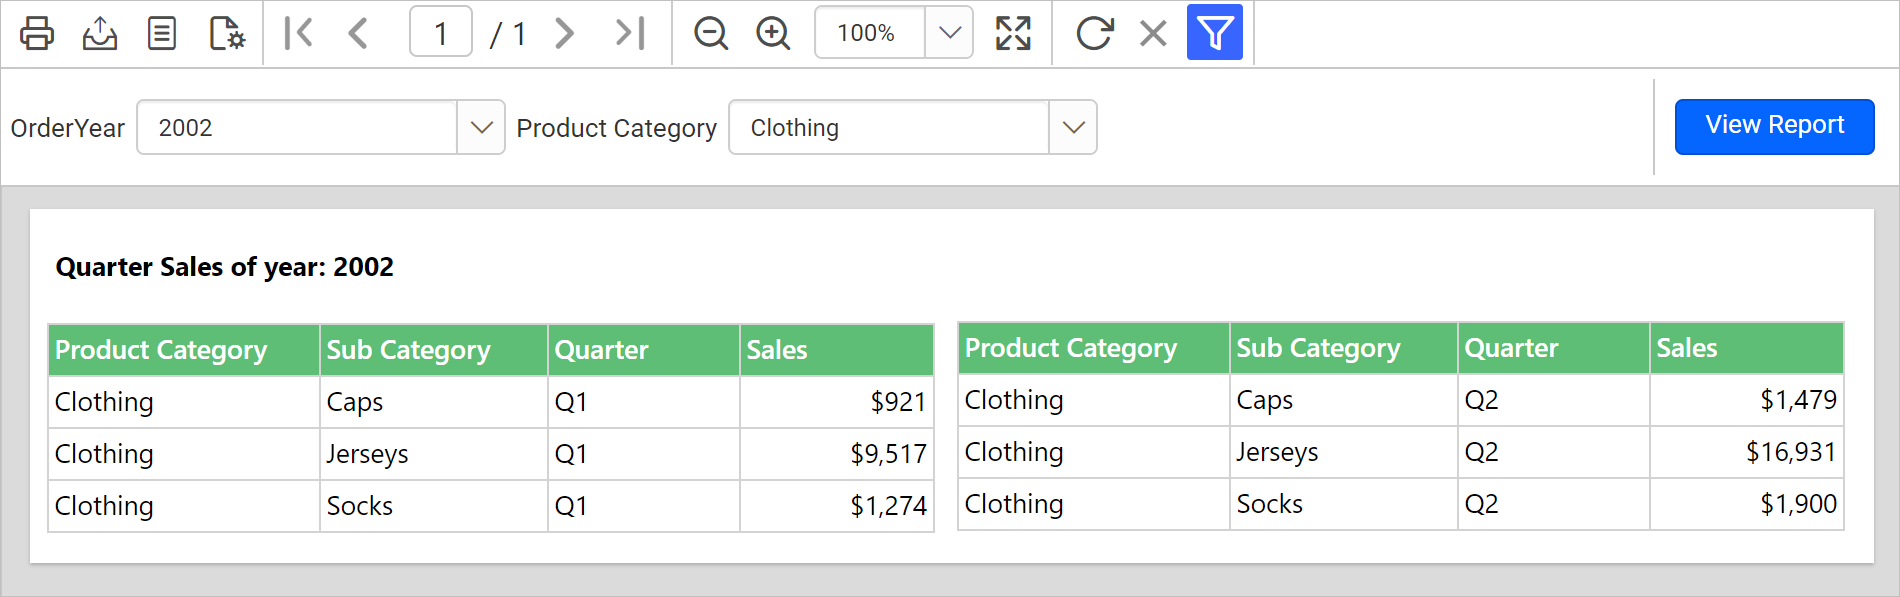
In the above image, three filter equations are created to filter the data in the data region based on OrderYear, Product Category, and OrderQtr data fields. In the below design, two different tablix data regions are designed using single dataset to display the quarter sales Q1 and Q2 against a year.
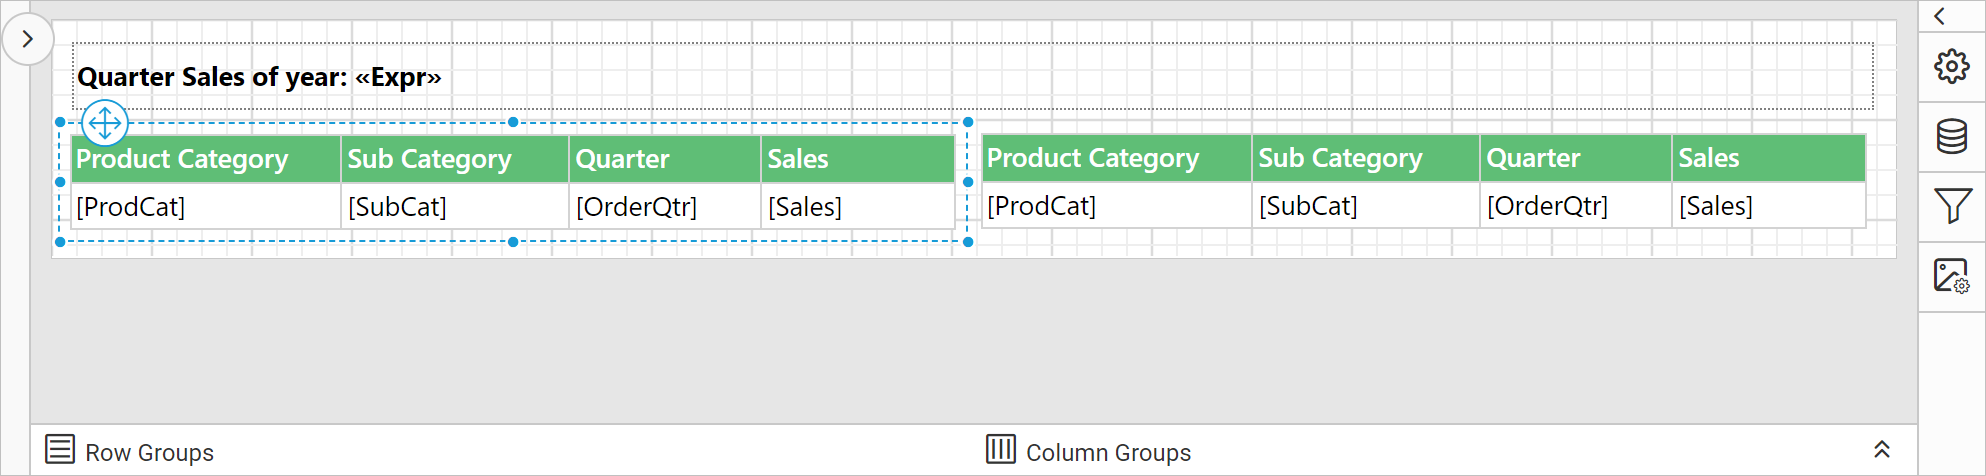
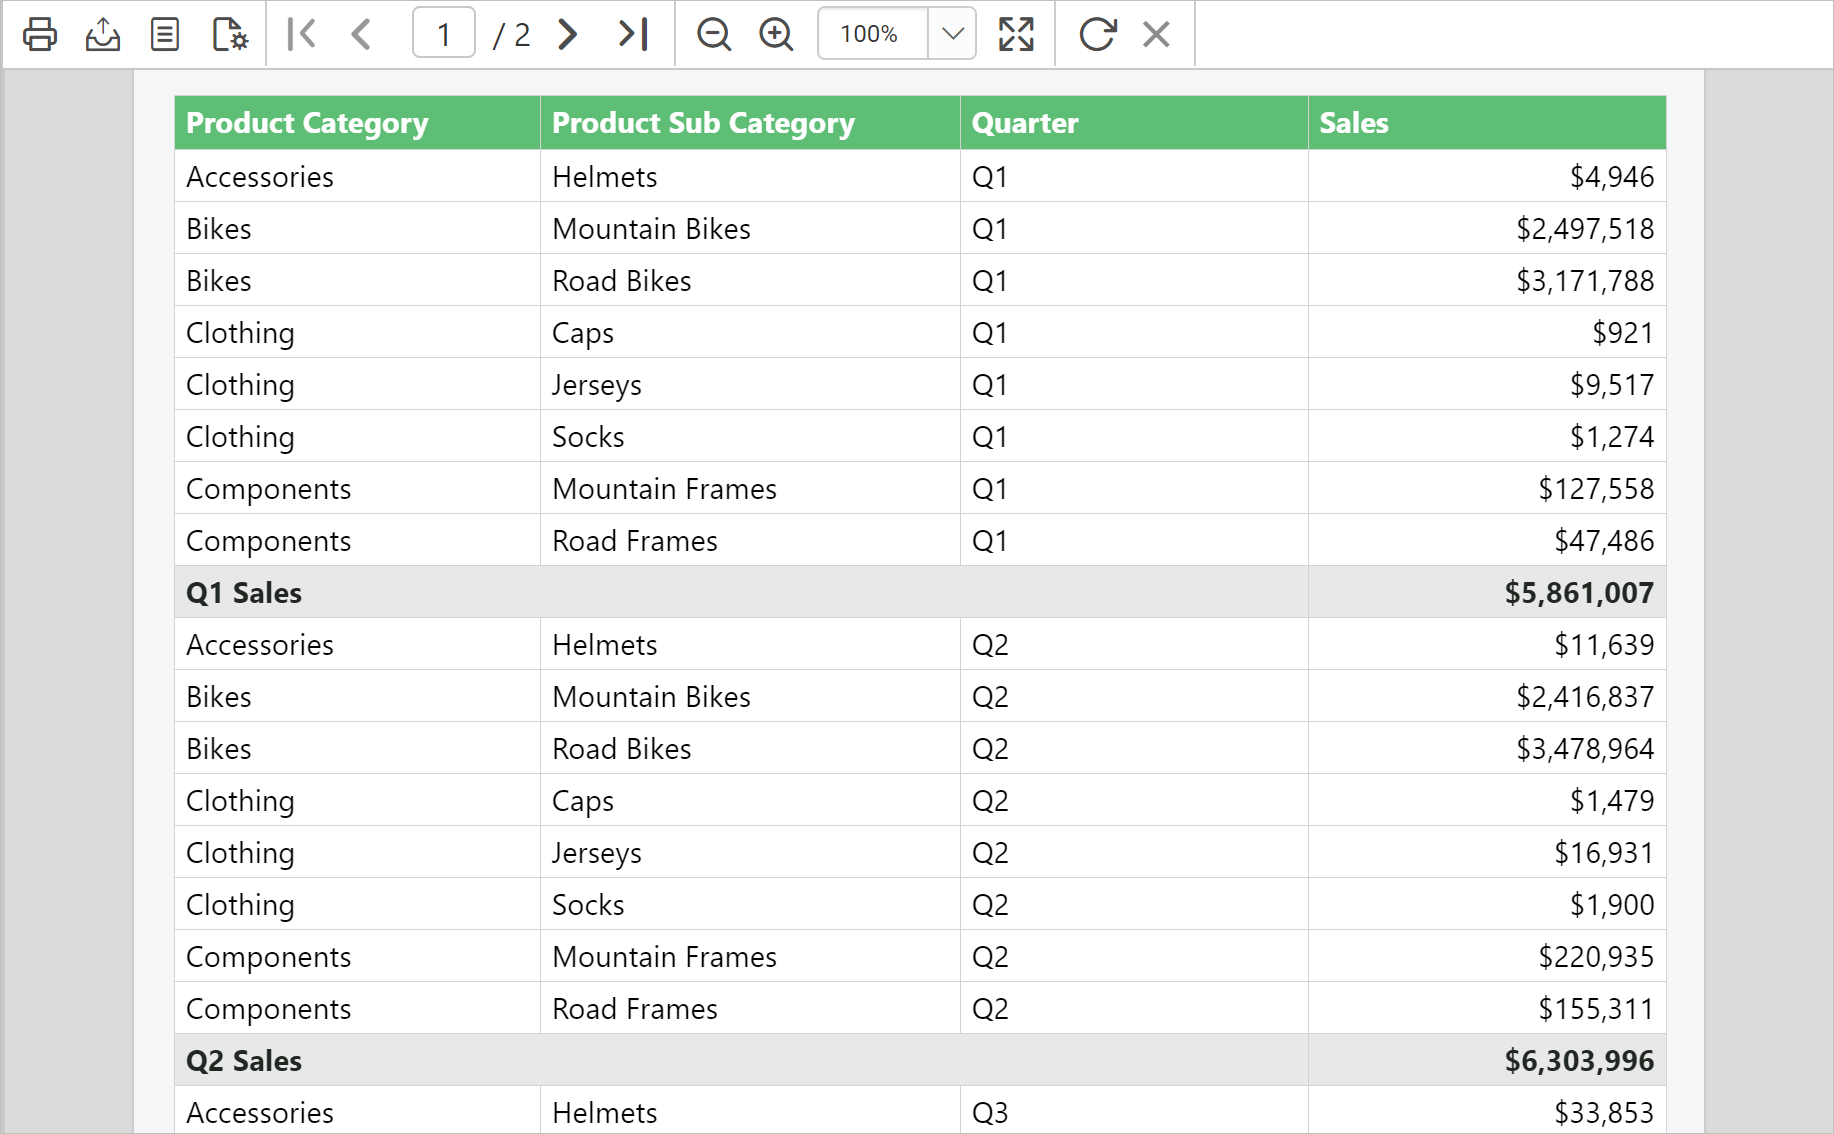
On report preview, using the OrderYear and ProductCategory report parameters, the sales of Q1 and Q2 is displayed in the tablix region based on applied filters.
Download the above report design from link.
Set filter on a tablix group
- Click on the surface of the tablix data region to open grouping panel.
- Click on the required group tablix member in the
Row GroupsorColumn Groupspane, now the respective tablix member properties will be listed in the properties panel.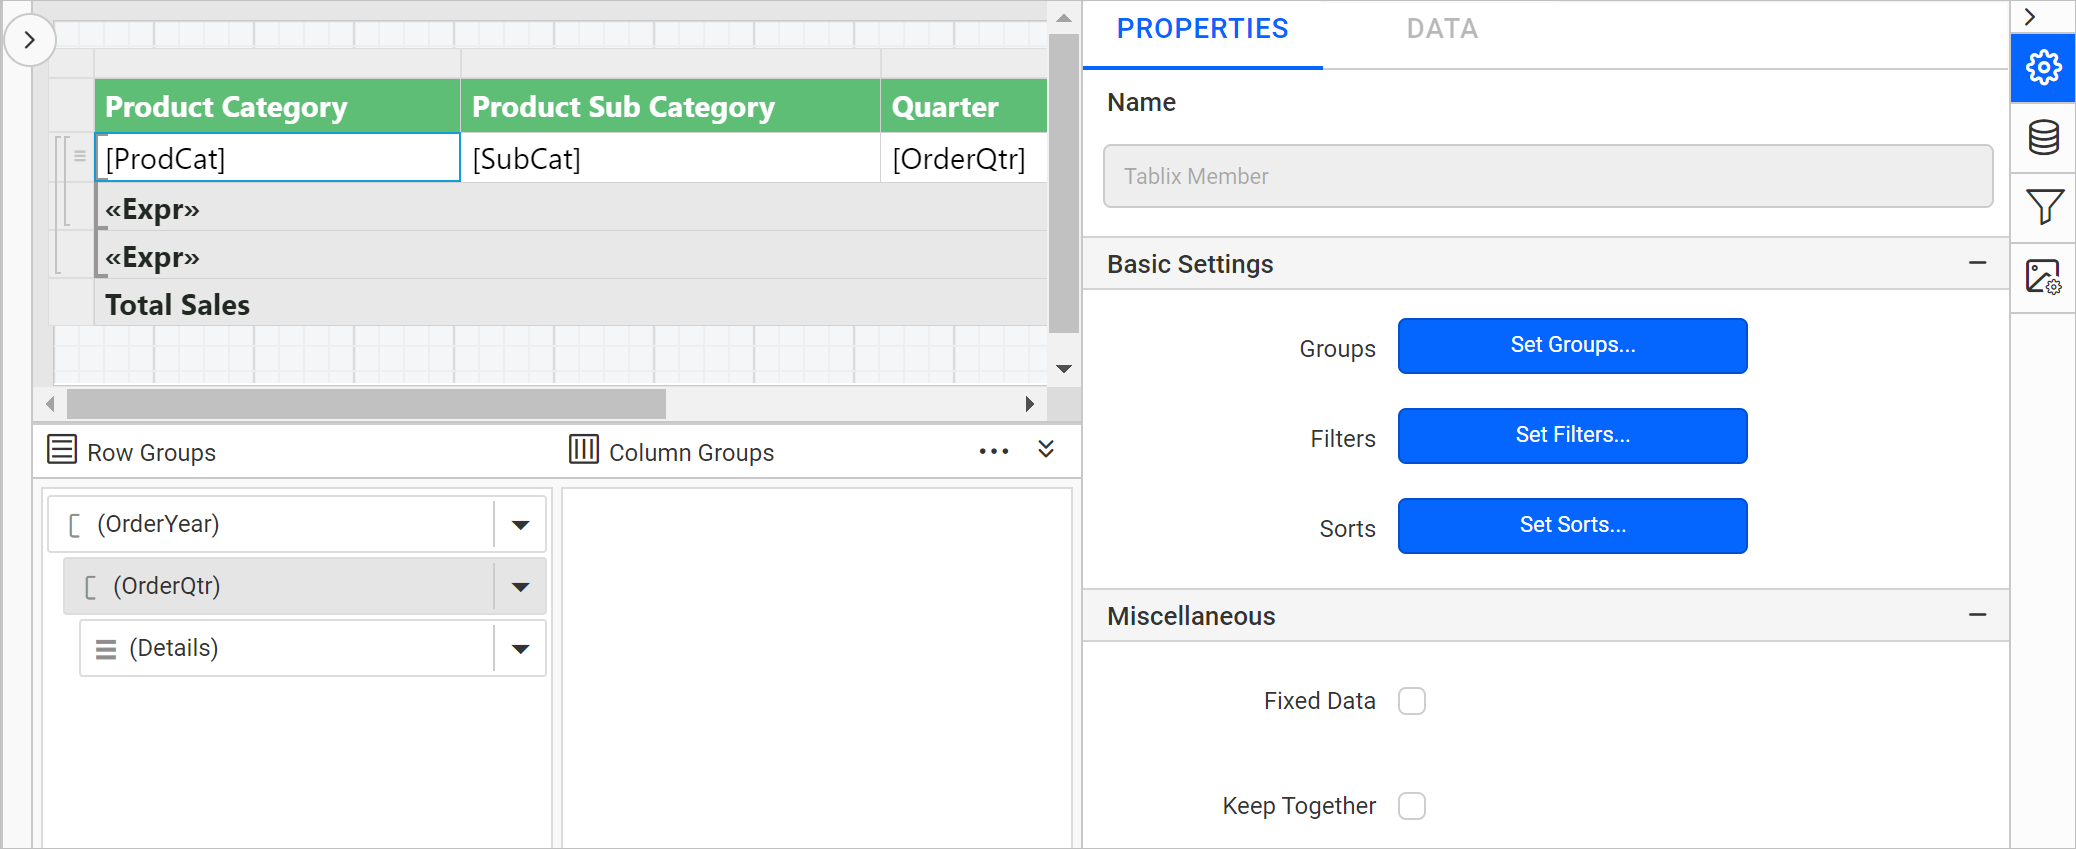
- In the properties panel, click on the
Set Filters...button. Now, the filter dialog will be opened like below. - Refer Filter Data section and create required filter expression in the filter dialog and click
OK.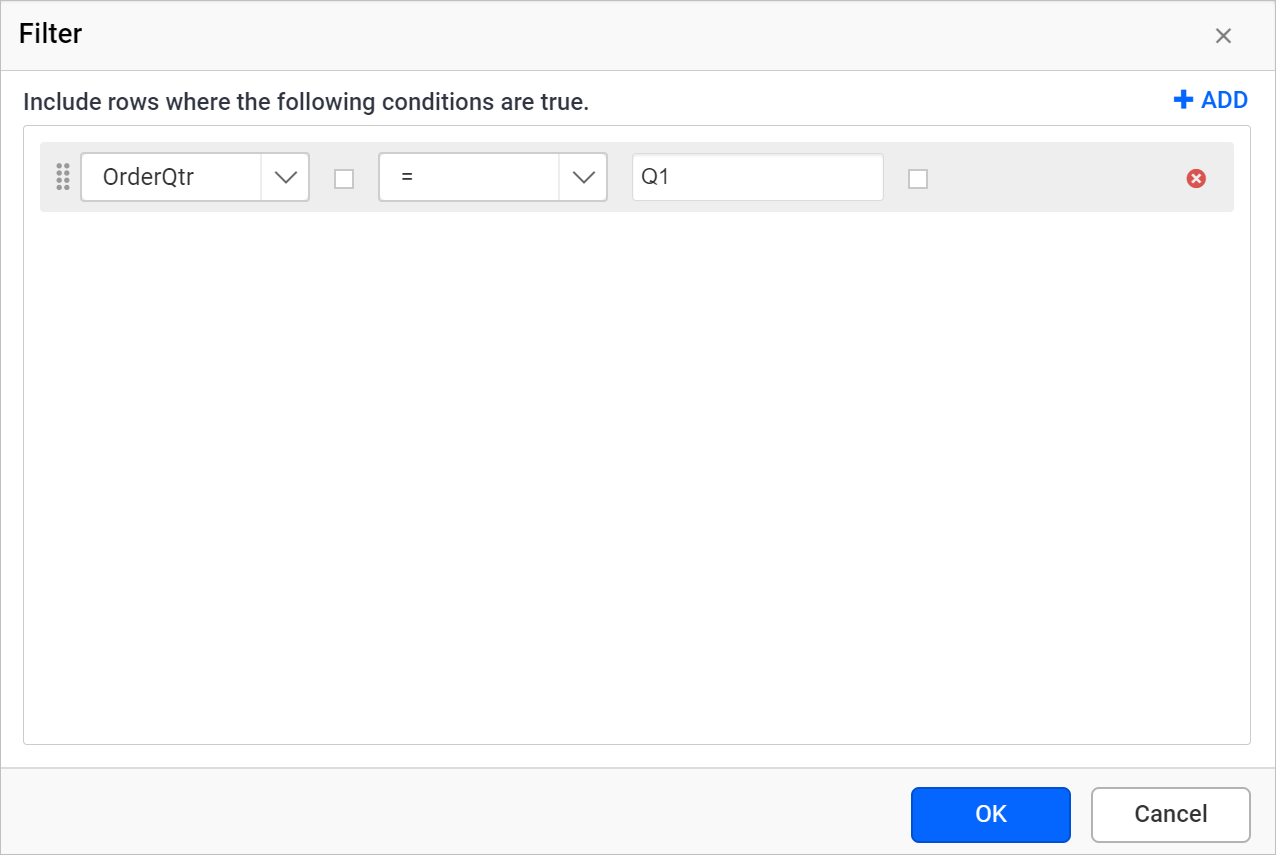
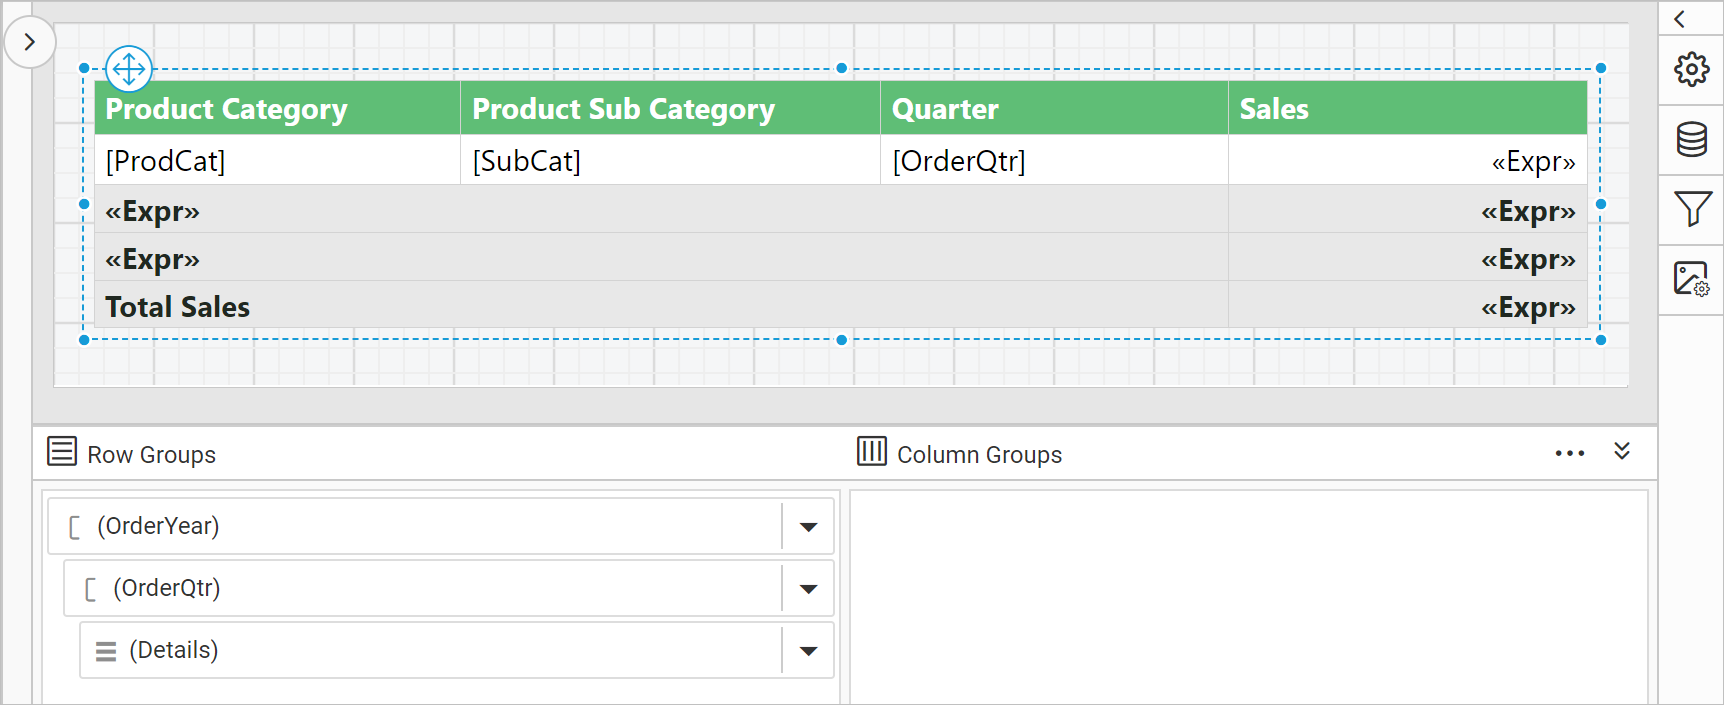
Before applying filter to the row group, on report preview the report displays sales of each quarters and its total.
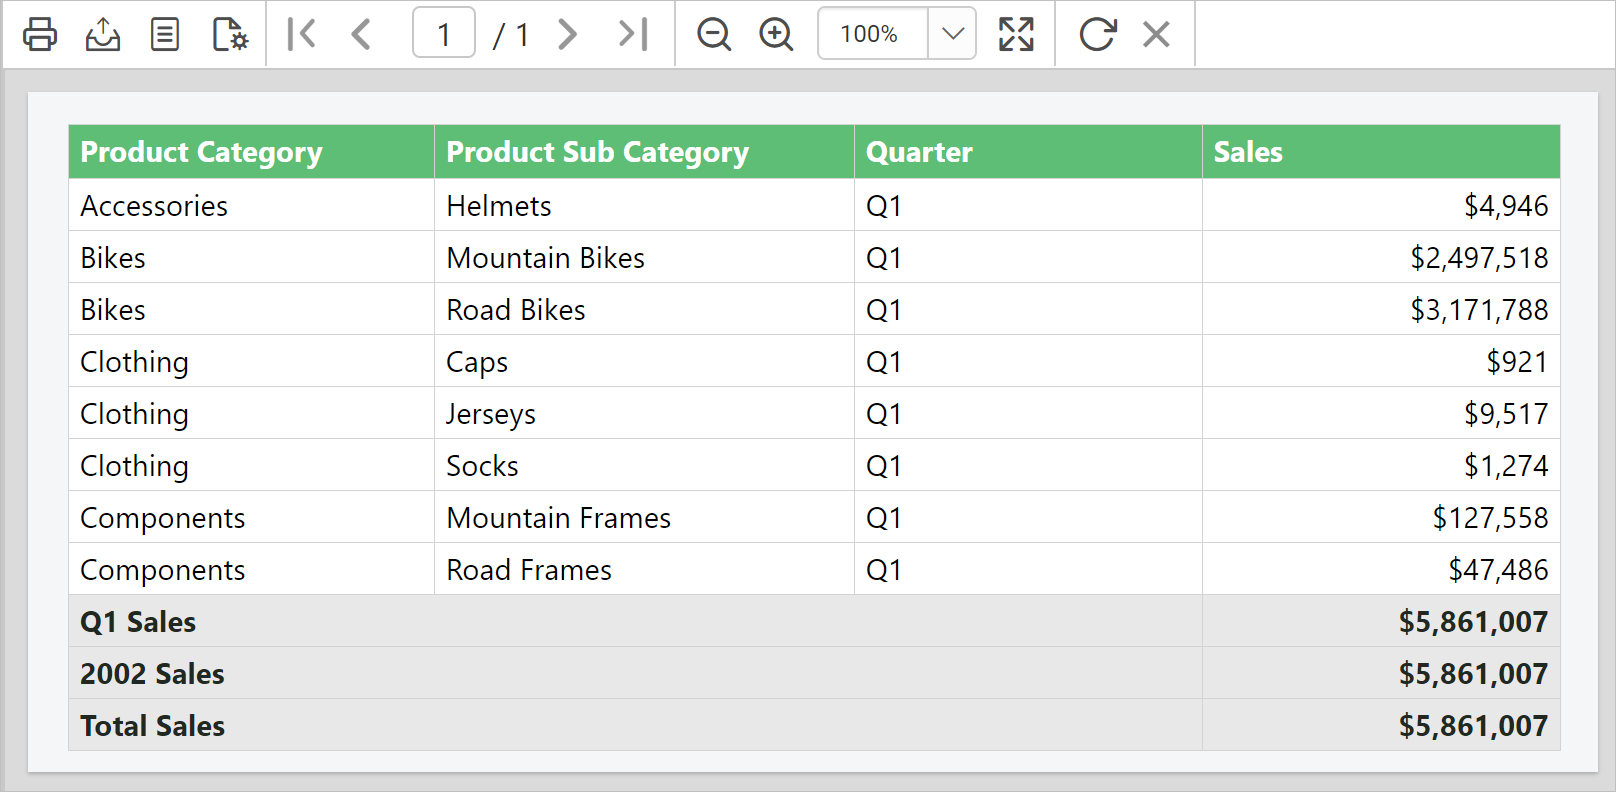
After applying filters for the respective row group, the total sales of Q1 and its total is displayed.
Here, the filter is applied on a row group group for demonstration. Similarly, you can apply filters on column groups and detail groups.
Download the above report design from link.