Add filters to chart data region
Filters can be used to filter data in the chart data region to include or exclude specific values from display or to provide a different view of the dataset in multiple data regions. When processing the report, the filters applied in the report parts are processed first on the dataset, and then on the data region, and then on groups.
Prefer watching over reading? Check out this video for applying filters to chart data region:
Set filter on a chart category group
- Select chart data region in the design area.
- Switch to
DATAtab,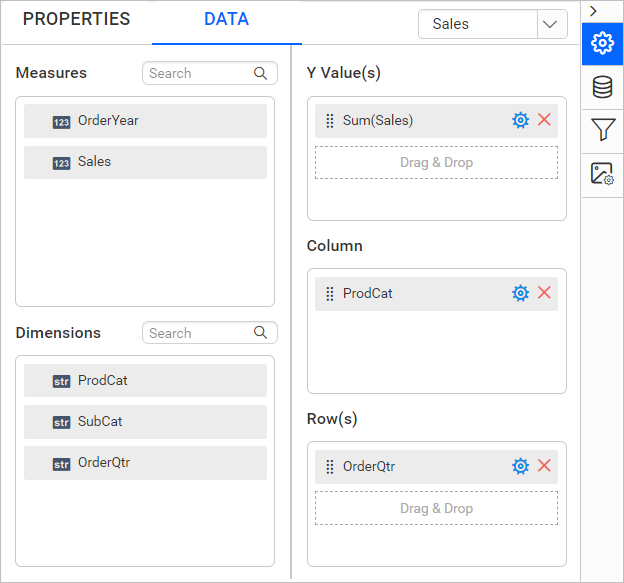
- In the
DATAassign panel, under the column section click on theSettingsicon.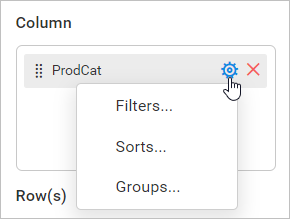
- Now, click on the
Filters...option in the menu. Now, the filter dialog will be opened like below.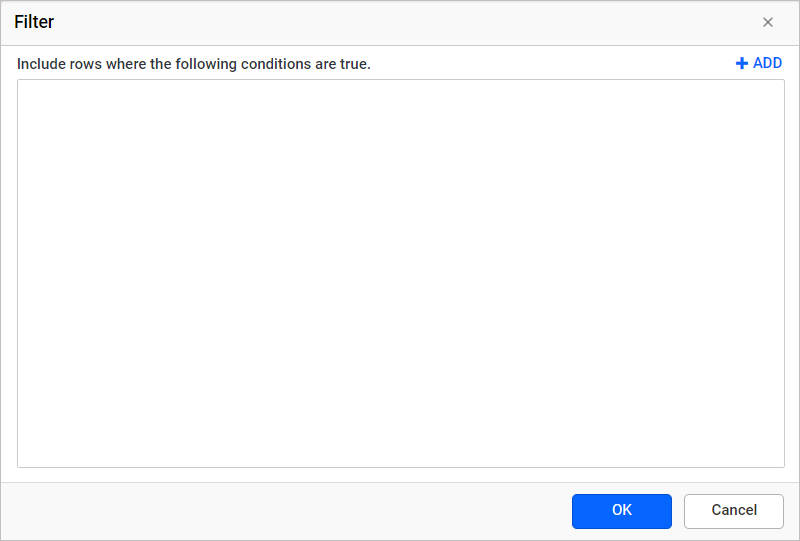
- Refer Filter Data section and create required filter expression in the filter dialog and click
OK.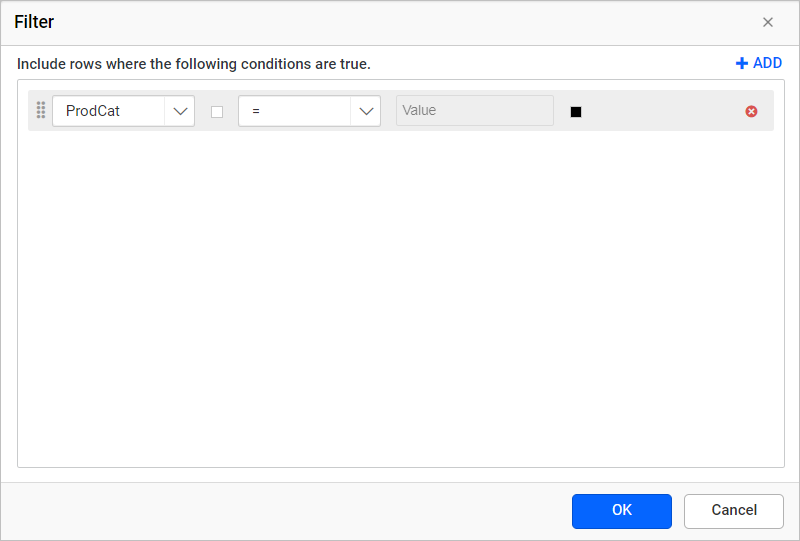
In the above image, the filter equation is created to filter the data in the data region based on Product Category data field.
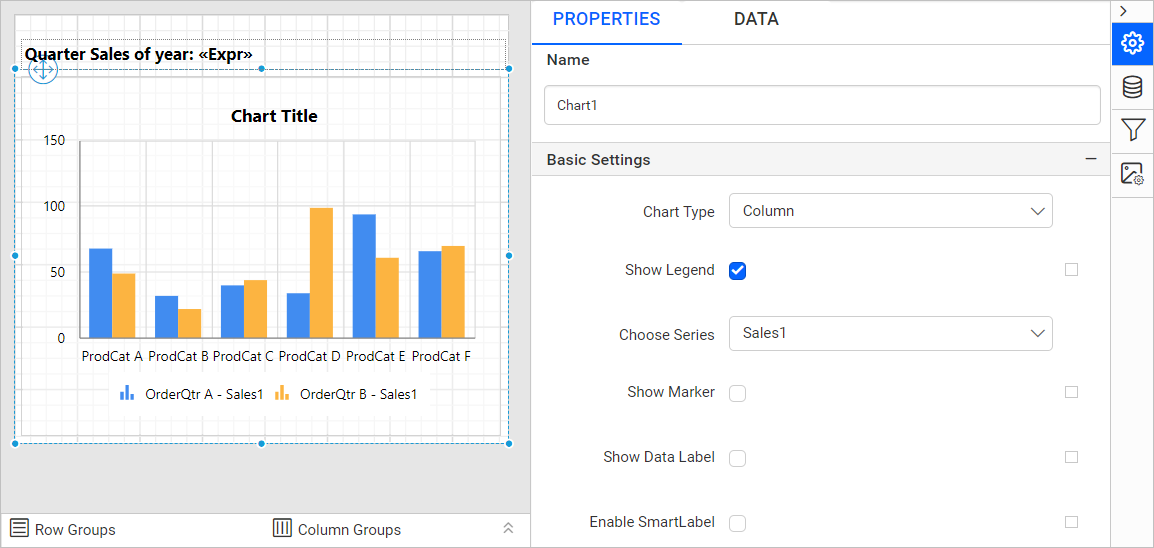
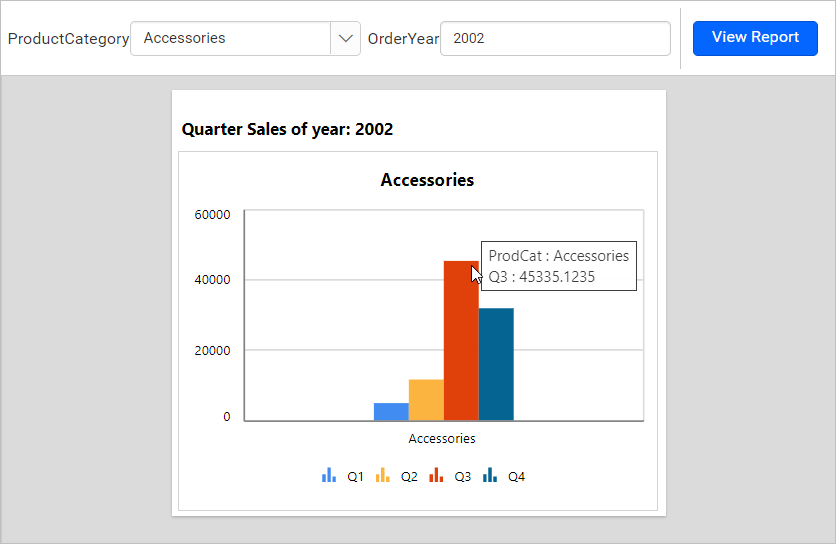
On report preview, using the OrderYear and ProductCategory report parameters, the sales of Q1, Q2, Q3 and Q4 is displayed in the chart data region based on applied filters.
Similarly, you can set filters on a chart series group.
Download the above report design from the link