How to configure custom map shapes
In on-premise server, we can configure the custom shape data to visualize it on map report item. To add custom shape data into on-premise application and use it report designer follow the below steps.
Place custom shape data file in installed location
In on-premise application, build-in shape data files are located at,
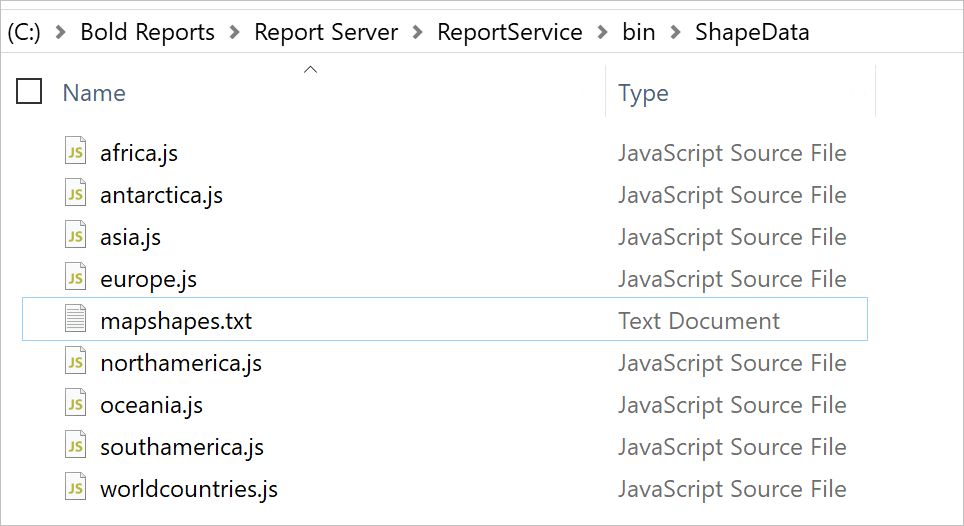
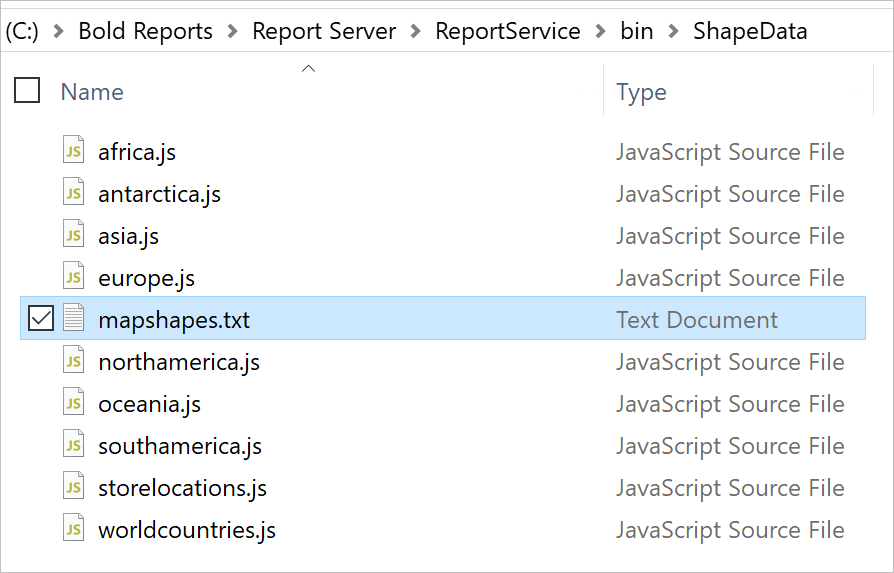
Version below 3.1
{Installed_location}\Bold Reports\Report Server\ReportService\bin\ShapeData.
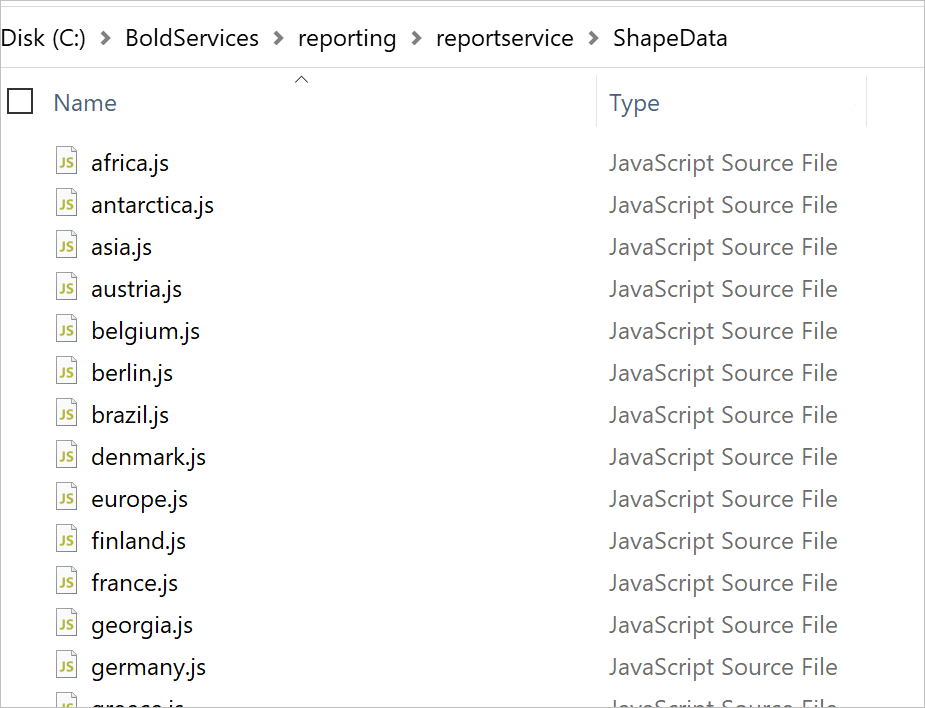
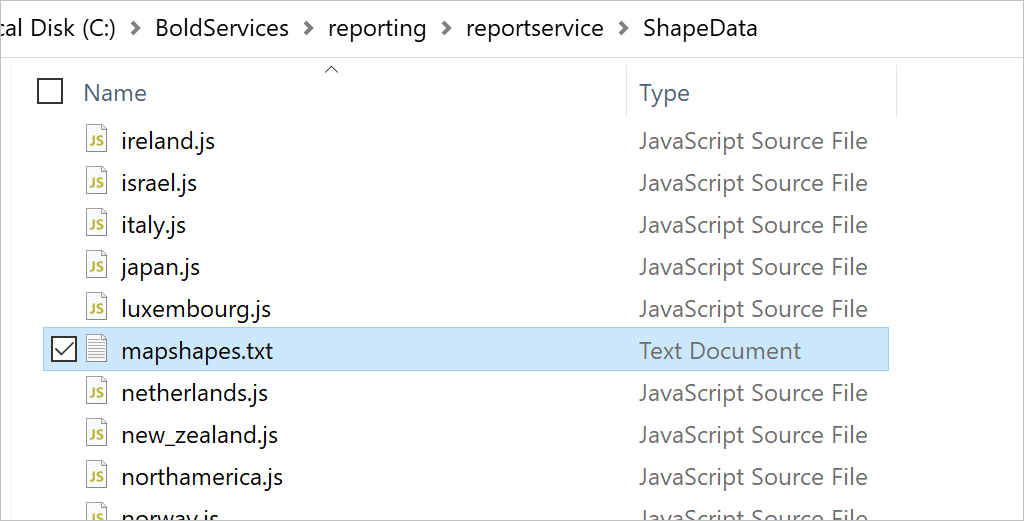
Version above 3.1
{Installed_location}\BoldServices\reporting\reportservice\ShapeData.
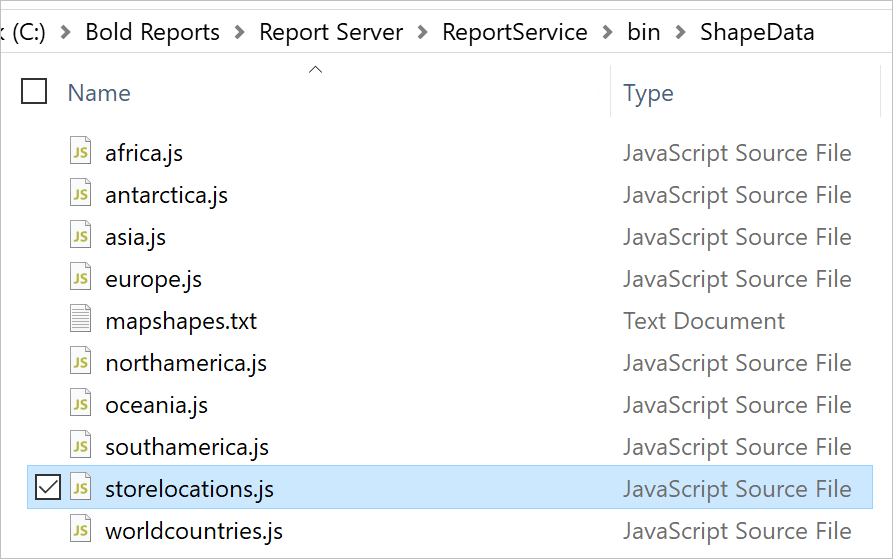
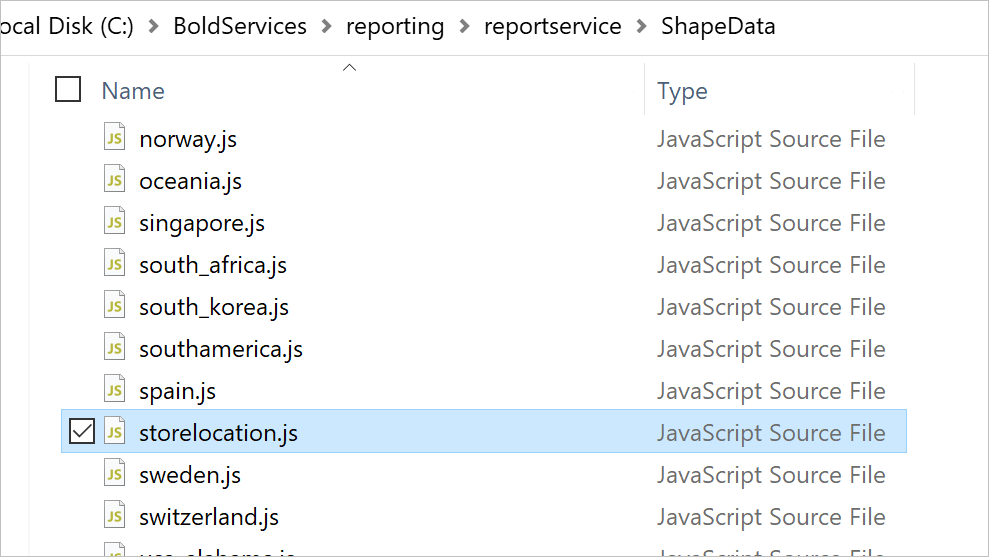
Copy your shape data file and paste at this location. For example, storelocations.js
Version below 3.1
Version above 3.1
Add file entry
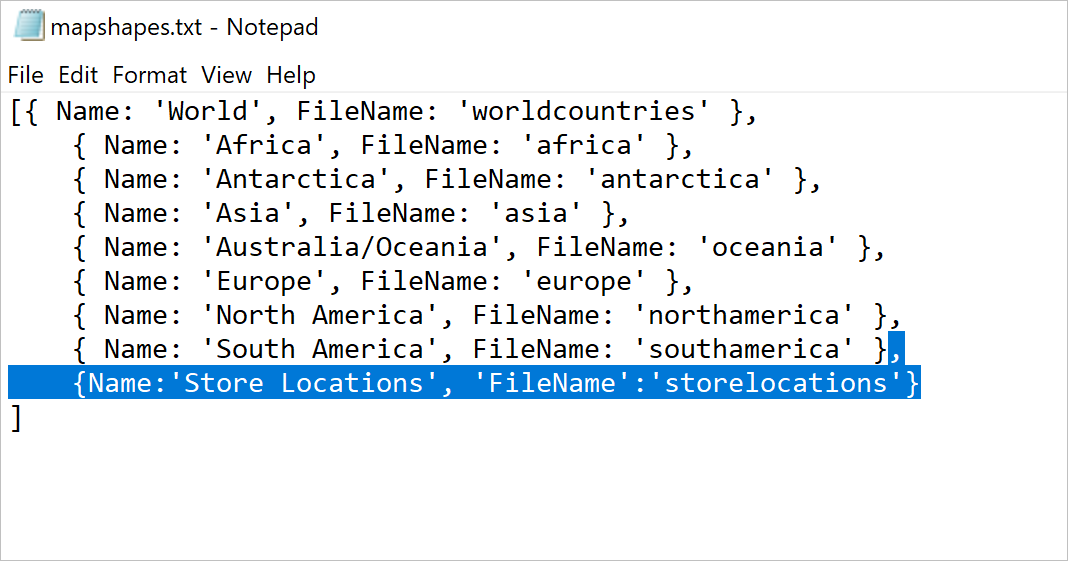
Once you paste the file in mentioned location, open mapshapes.txt file which is available in same location.
Version below 3.1
Version above 3.1
Add the entry of your file name and display name as shown below and save the file,
Visualize shape data on map
- Launch the on-premise application and create a new report.
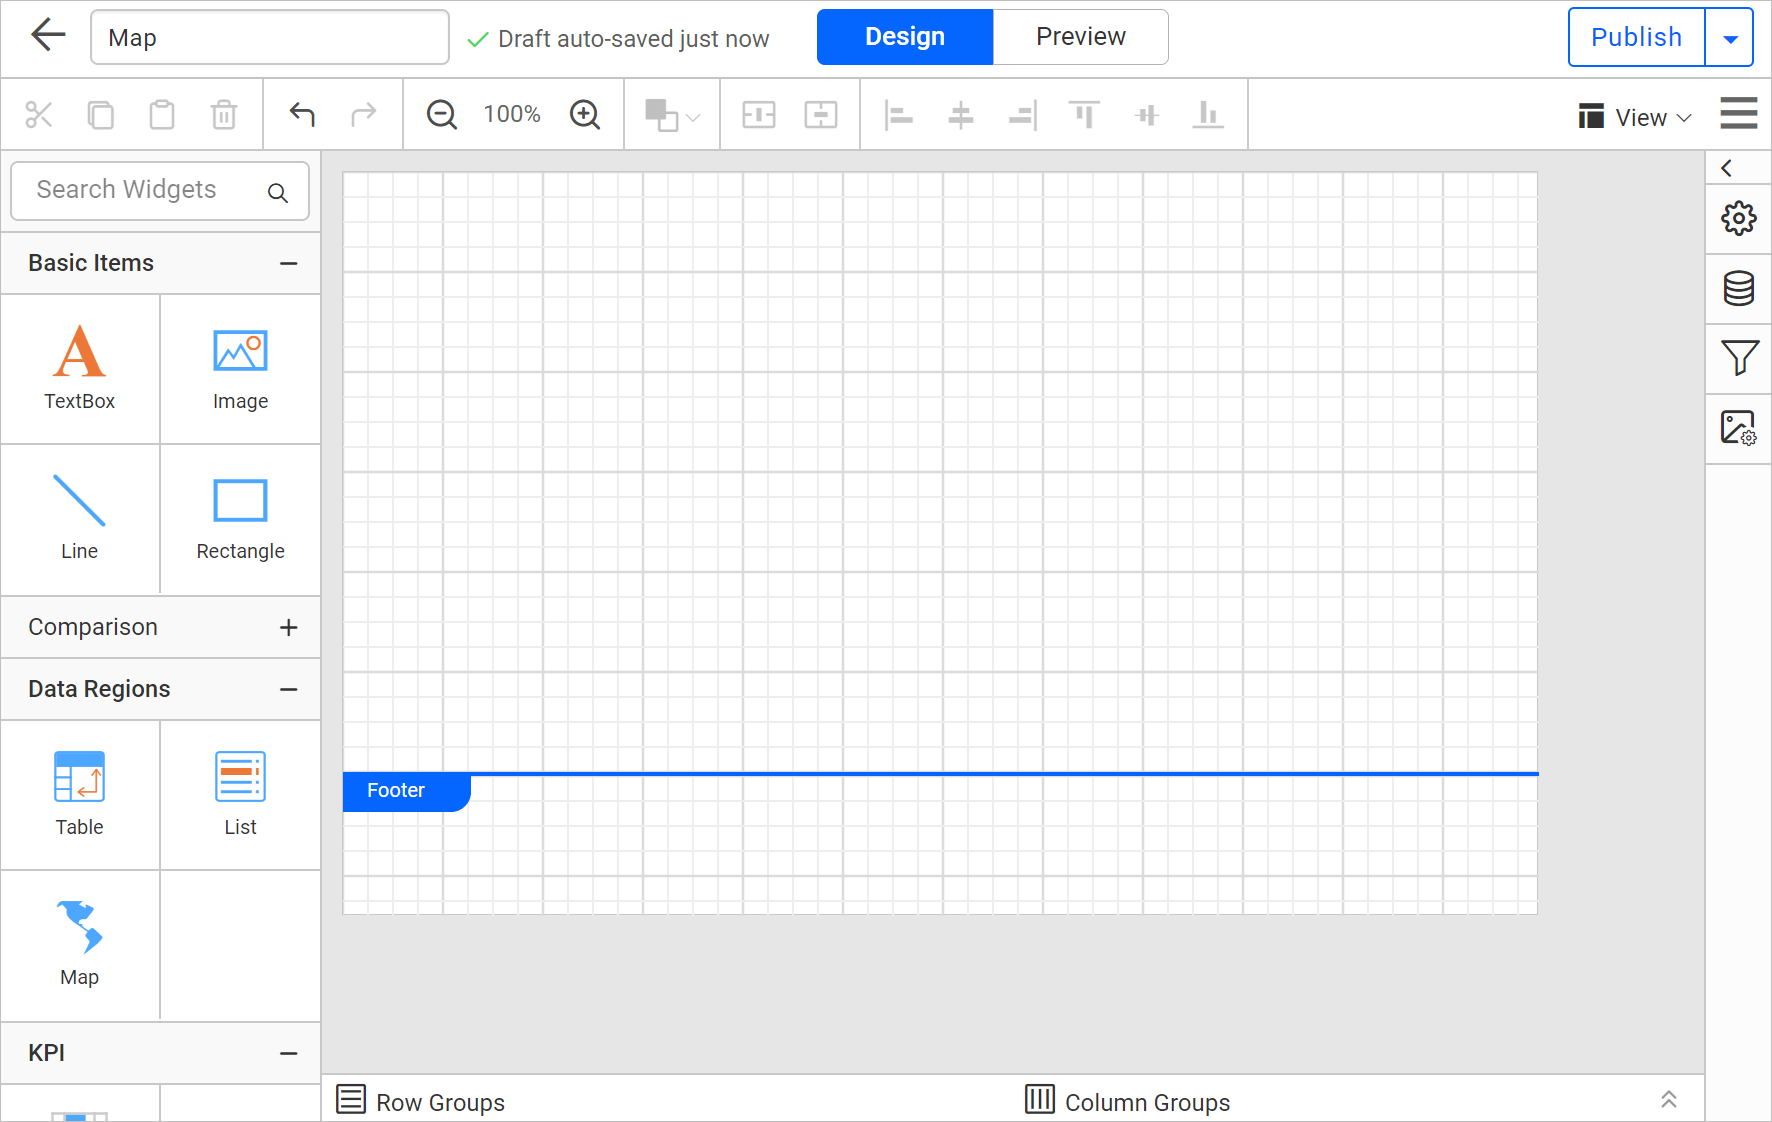
- Drag a map into design area from item panel.
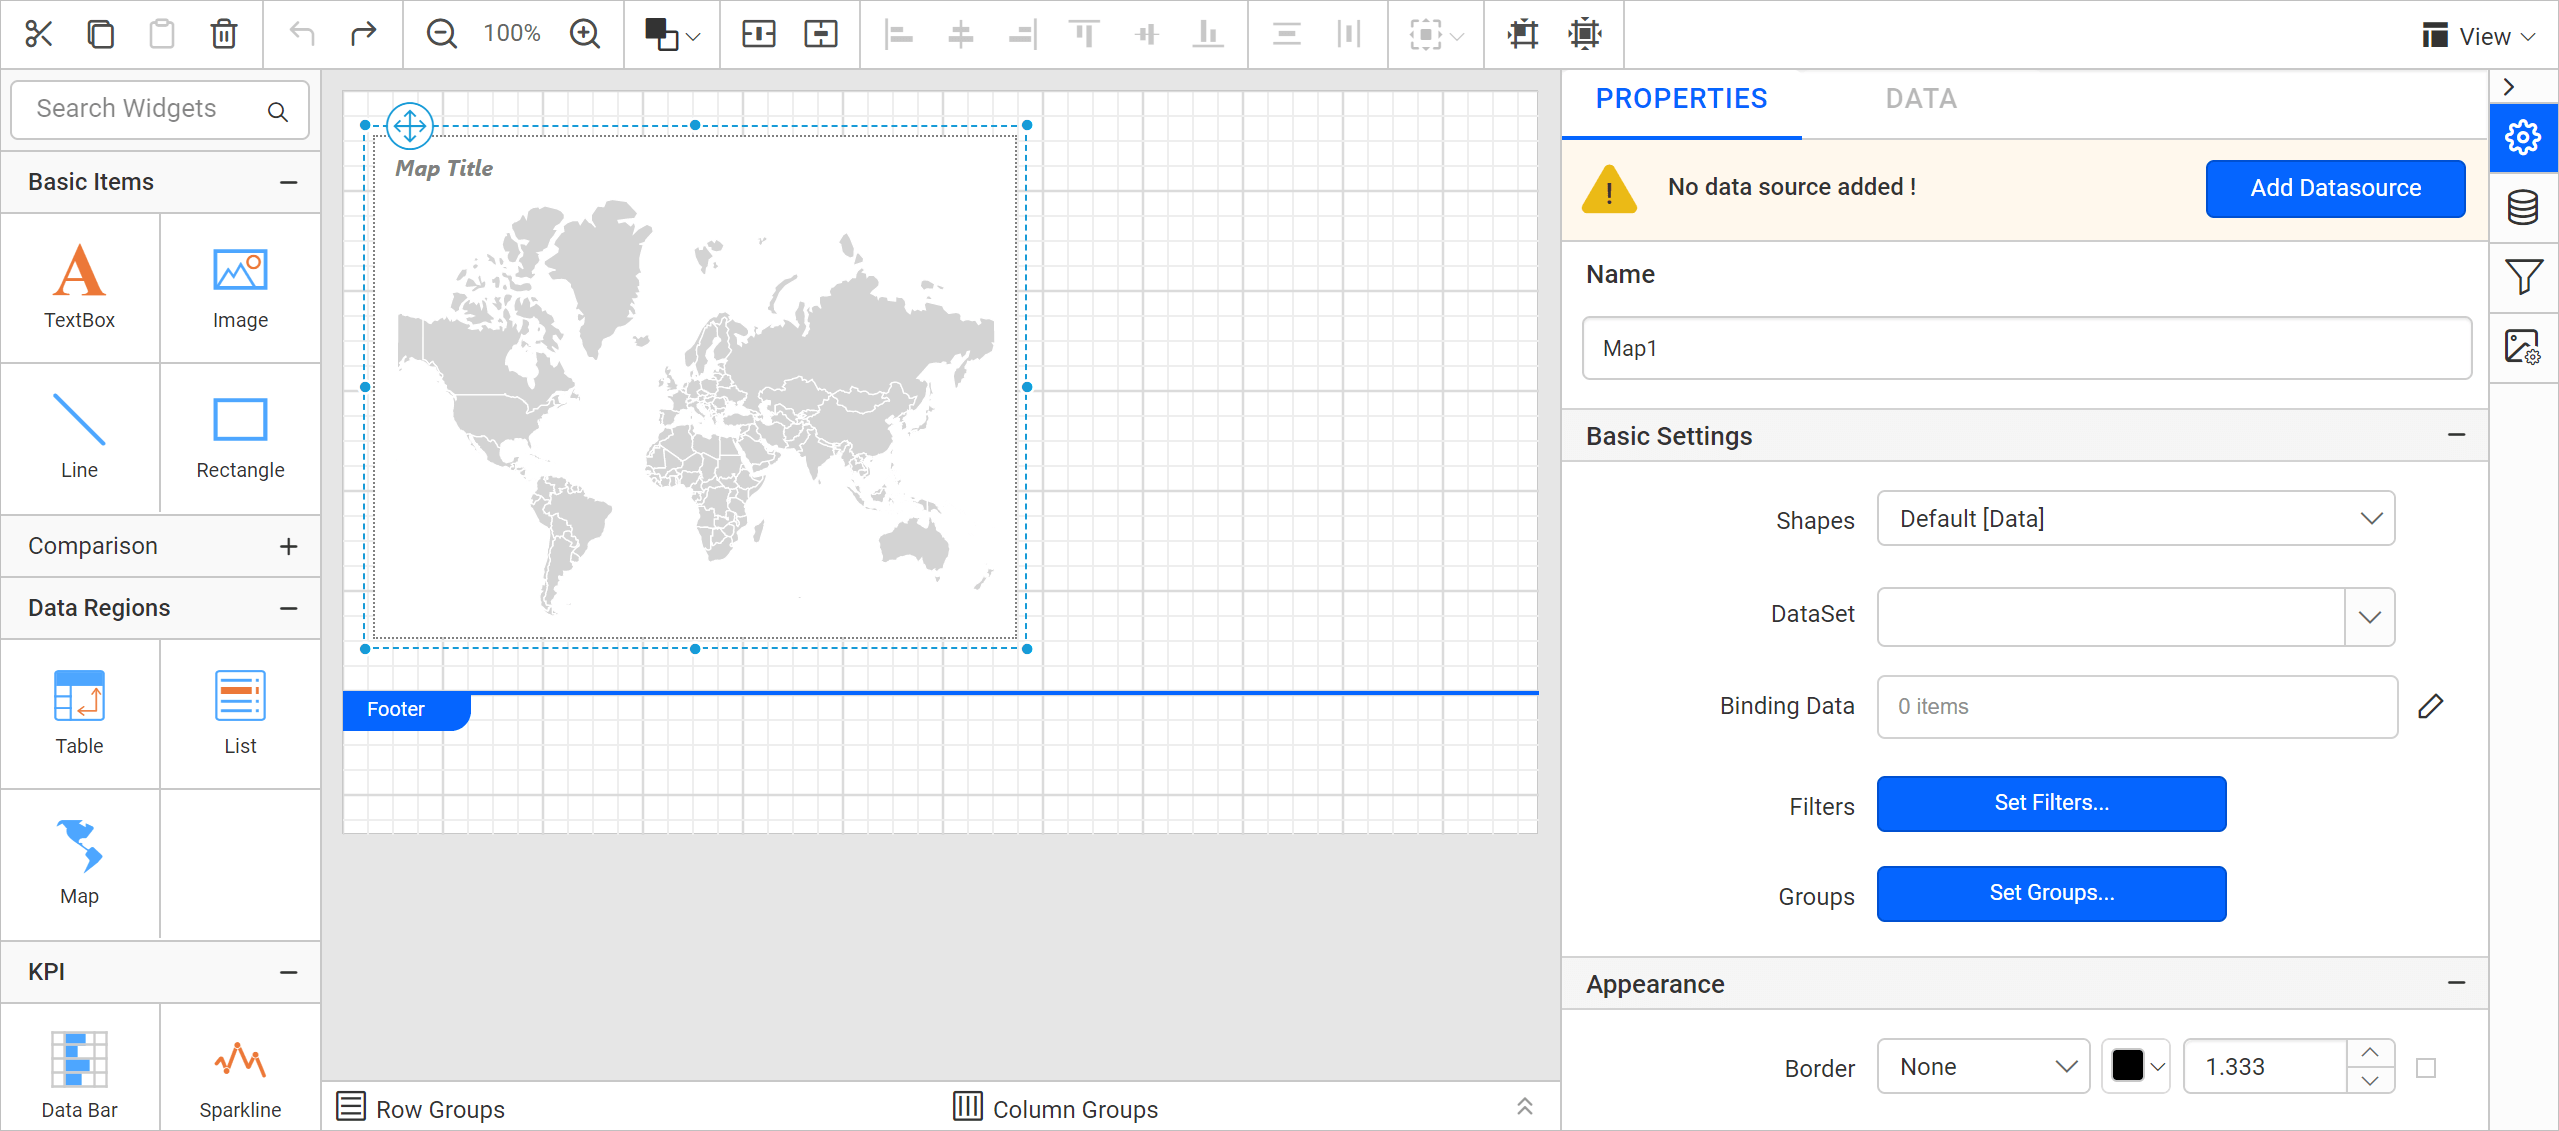
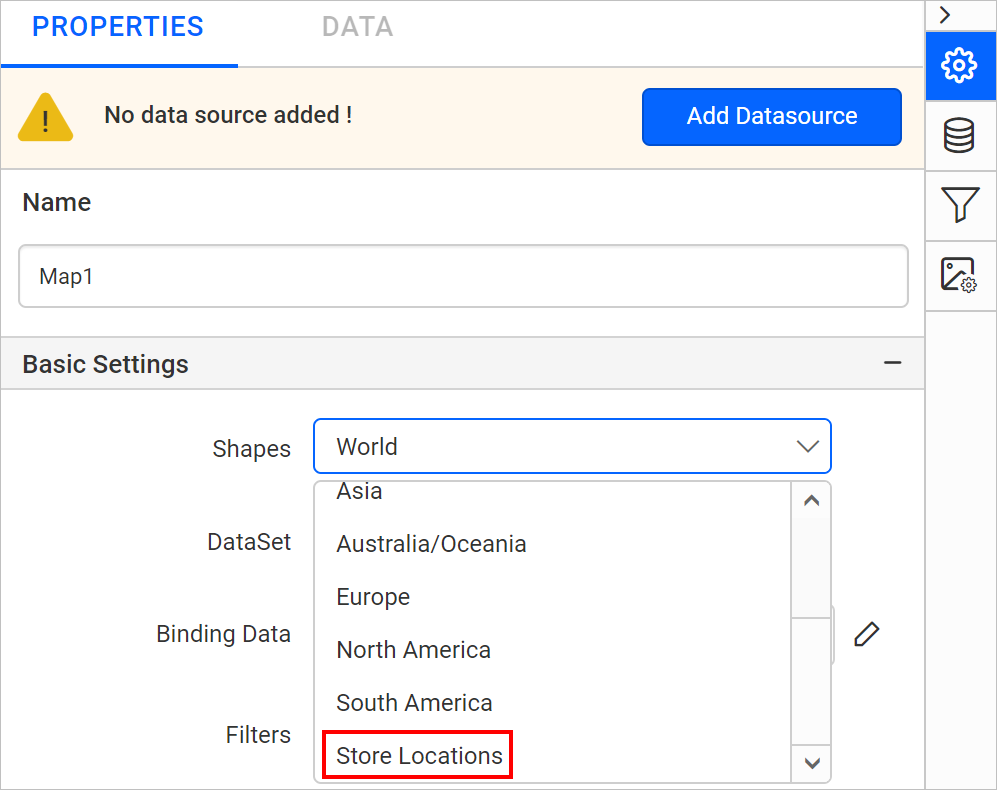
- The newly added shape data entry will be listed in the Shapes property drop-down under Basic Settings category.
Refer Design a rdl report using map section to visualize shape data and analytical data using map report item.