Azure Application Insights Integration in Bold Reports®
Integrating Azure Application Insights with Bold Reports® allows you to leverage the powerful analytics and telemetry capabilities of Azure Application Insights within your Bold Reports® environment. This integration can provide valuable insights into your report’s performance, usage, and other metrics, helping you optimize your reporting processes and make more informed decisions.
Prerequisites
-
An Azure account
-
Install Bold Reports® On-Premise and login with an administrator account.
Instructions for setting up Azure Application Insights in Bold Reports®
-
Log in to the Azure portal.
-
Click on
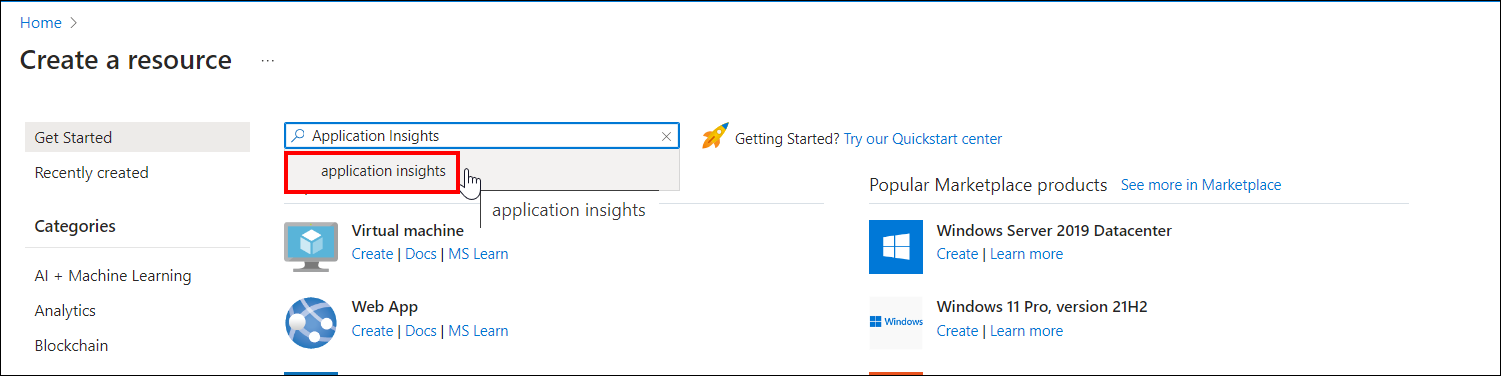
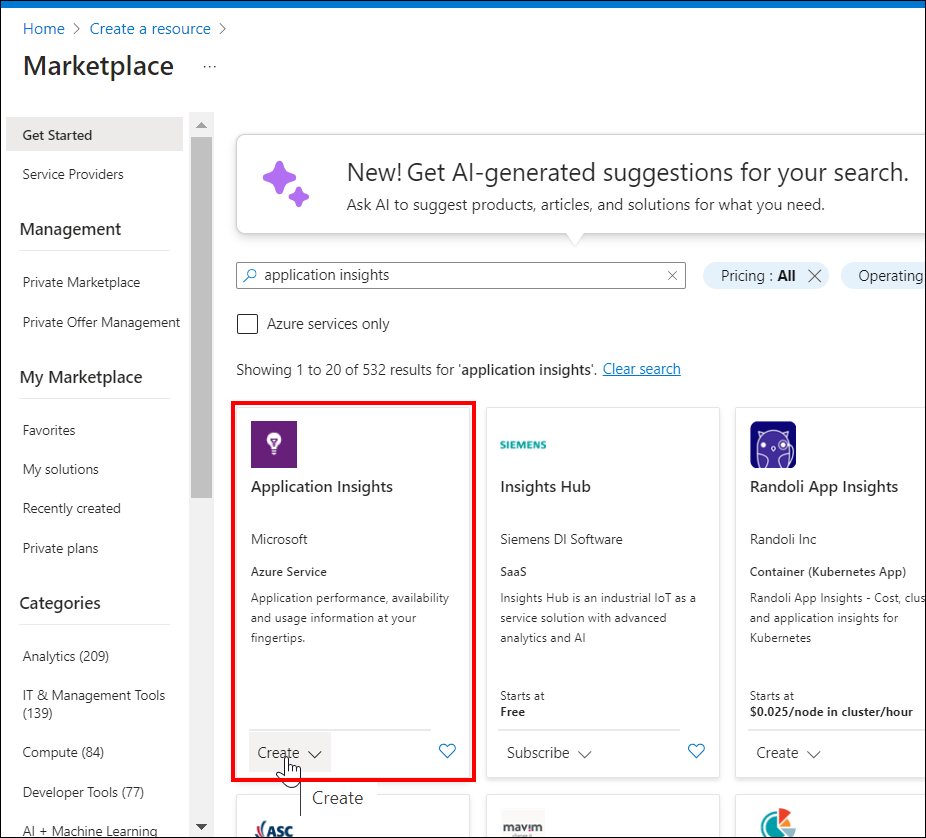
Create a resource, search forApplication Insightsas follows and then clickCreate.
-
Fill in the necessary information and the click
Review + create.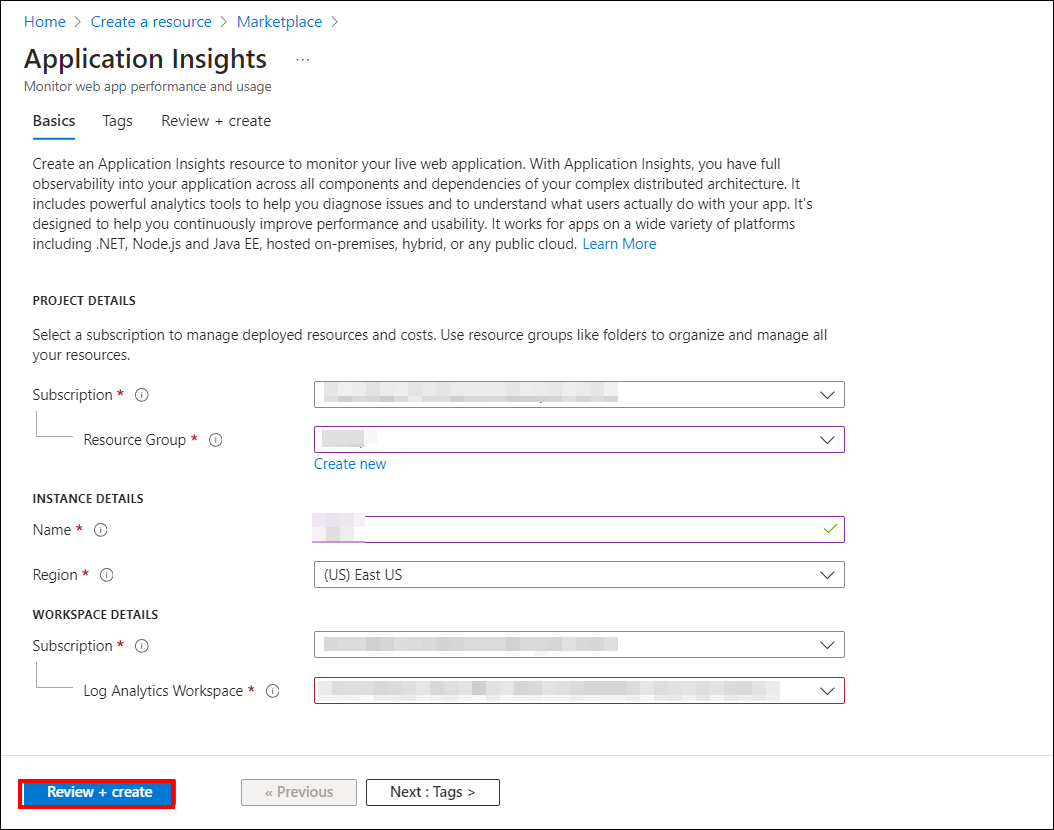
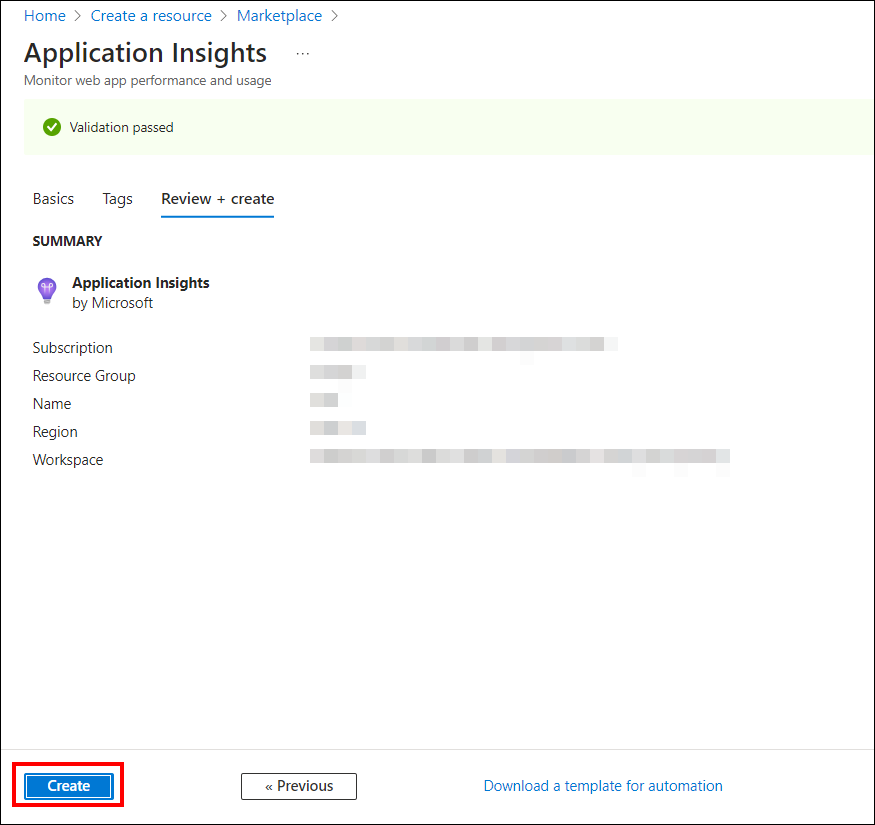
Subscription: This should be associated with the Azure subscription.
Resource group: Choose
Create newand enter the name of the new resource group, or select an existing resource group.Name: Enter a name for the resource.
Region: Select your preferred region.
-
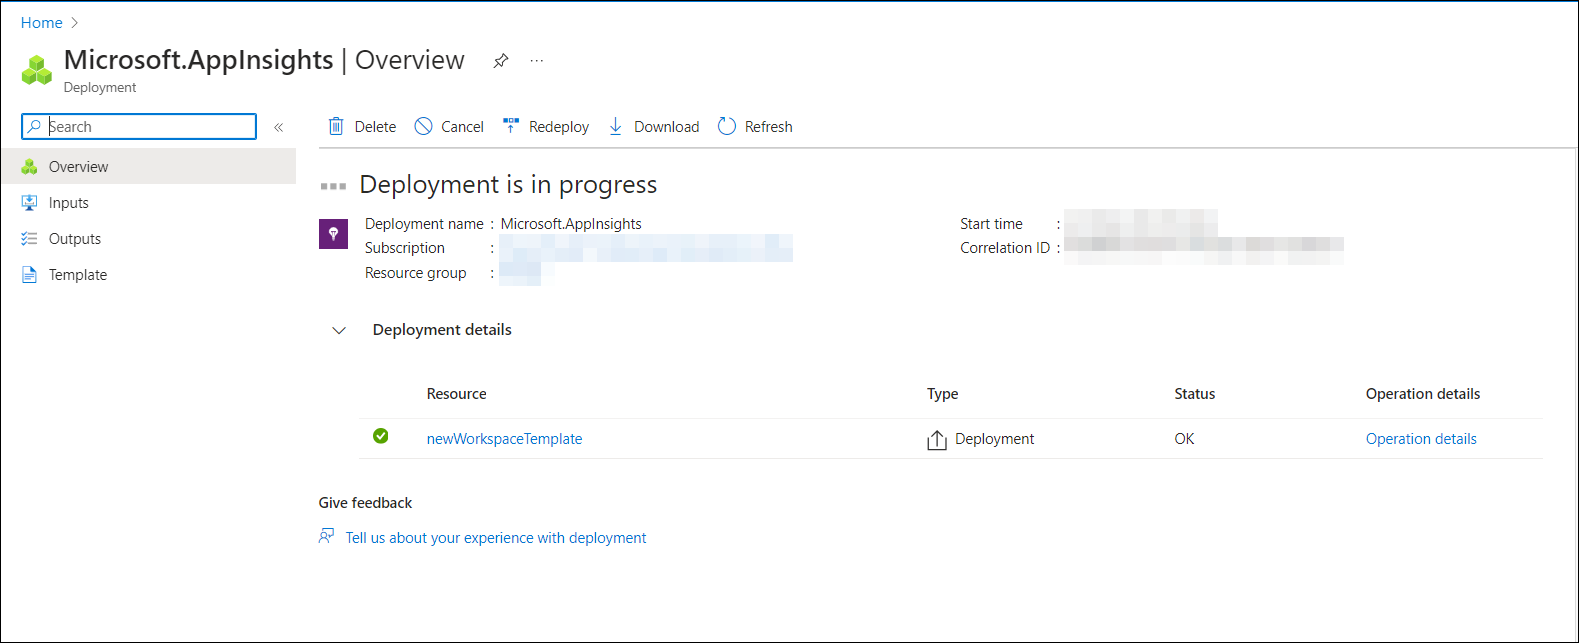
The deployment of the Application Insights will begin, and you can track the progress of the deployment here.
-
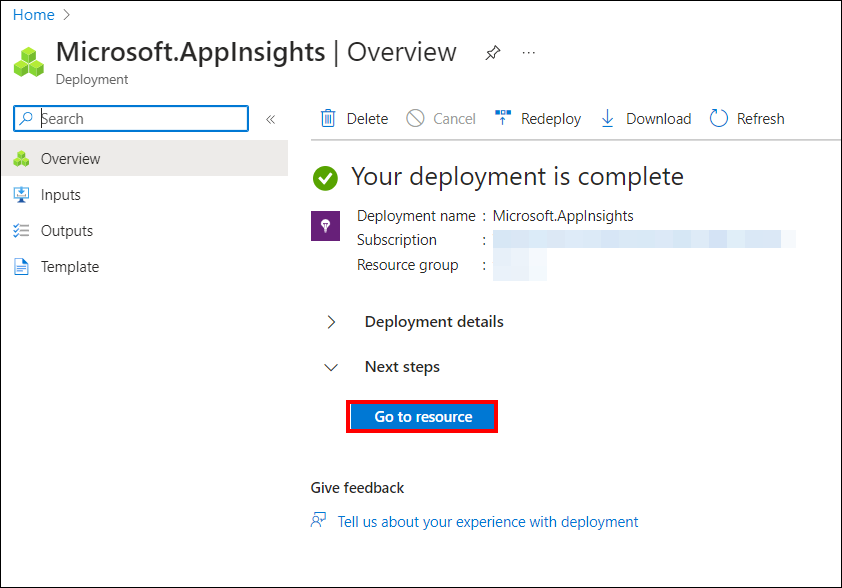
After successful deployment, navigate to the respective resource.
-
Copy the
Connection Stringin the Overview section.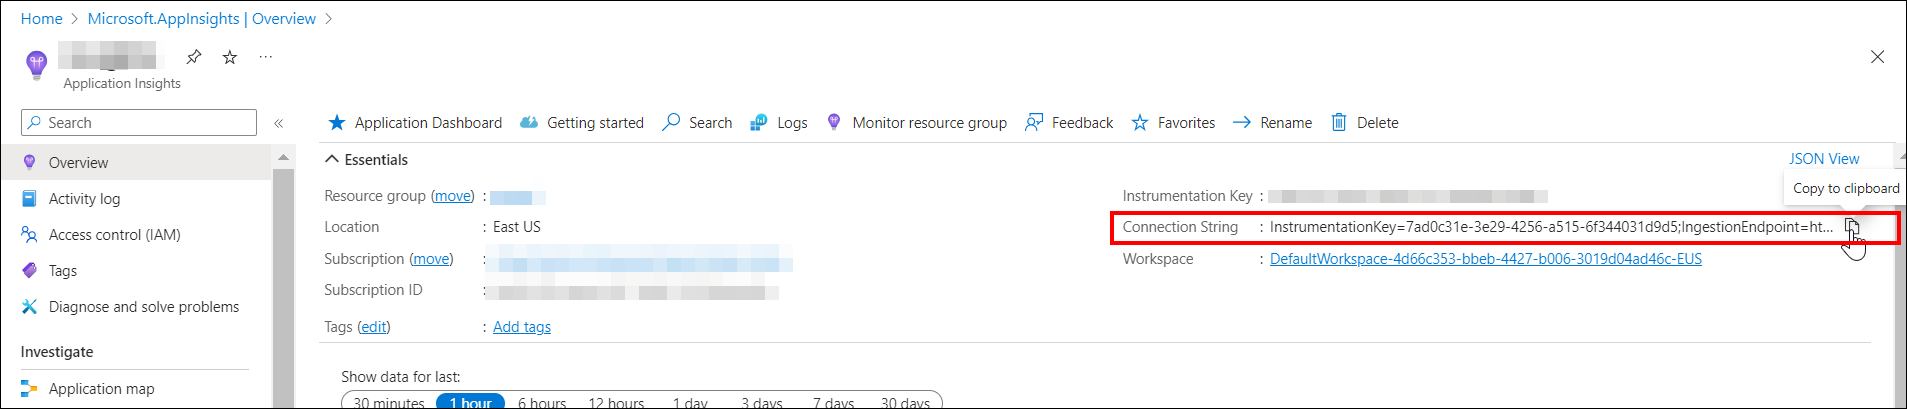
-
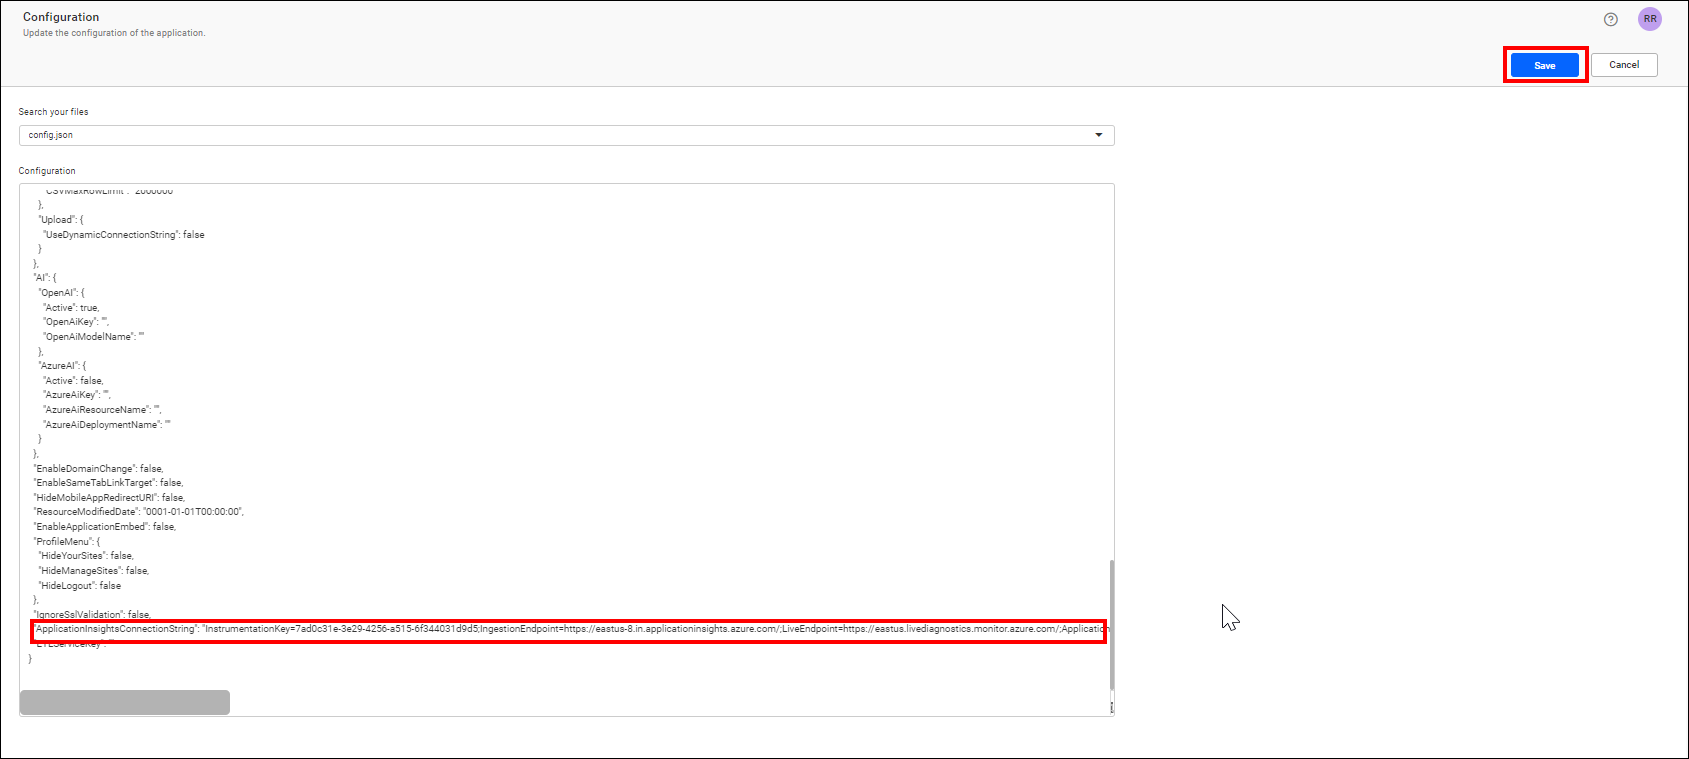
Paste the copied connection string into
ApplicationInsightsConnectionStringlocated atSettings -> Configuration -> reporting/config.json, and save the changes as shown in the screenshots below.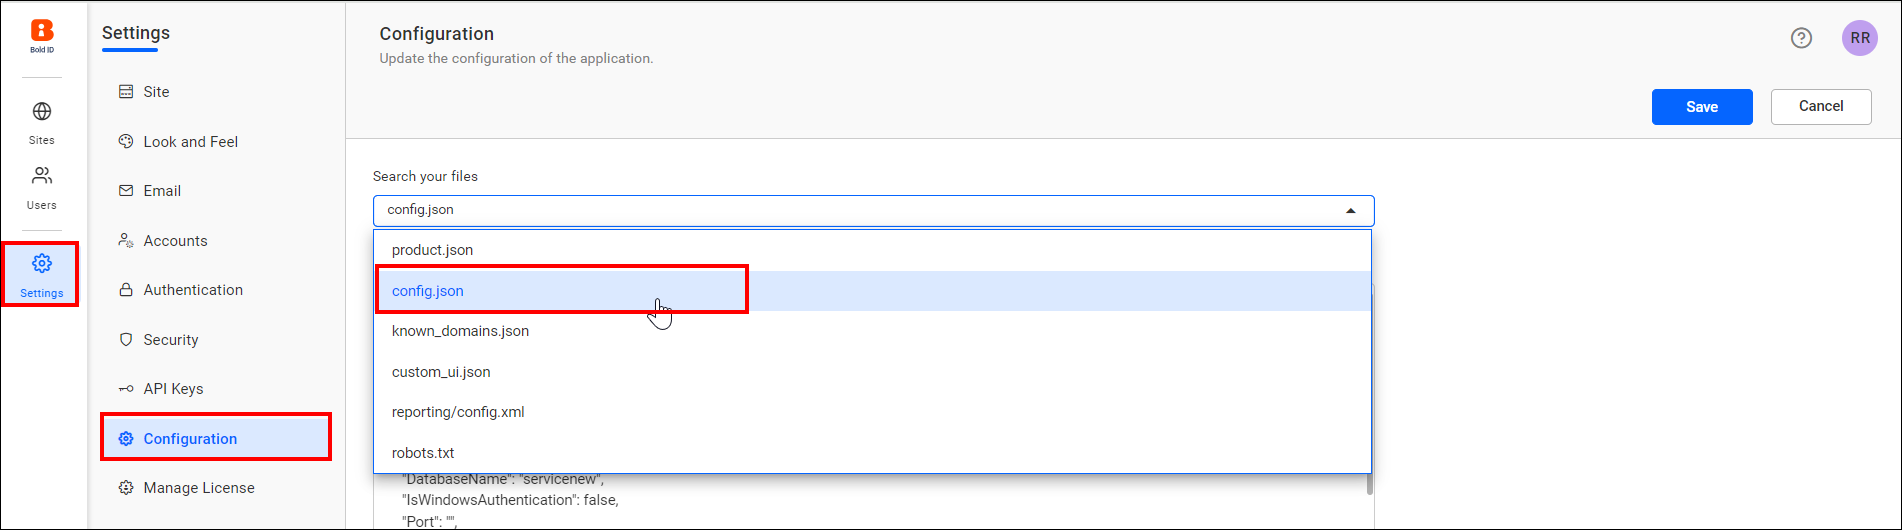
-
Then, restart the Bold Reports® Enterprise application.
Now, Application Insights is integrated with the Bold Reports® On-Premise application. You can confirm this by viewing the Live metrics in Application Insights.
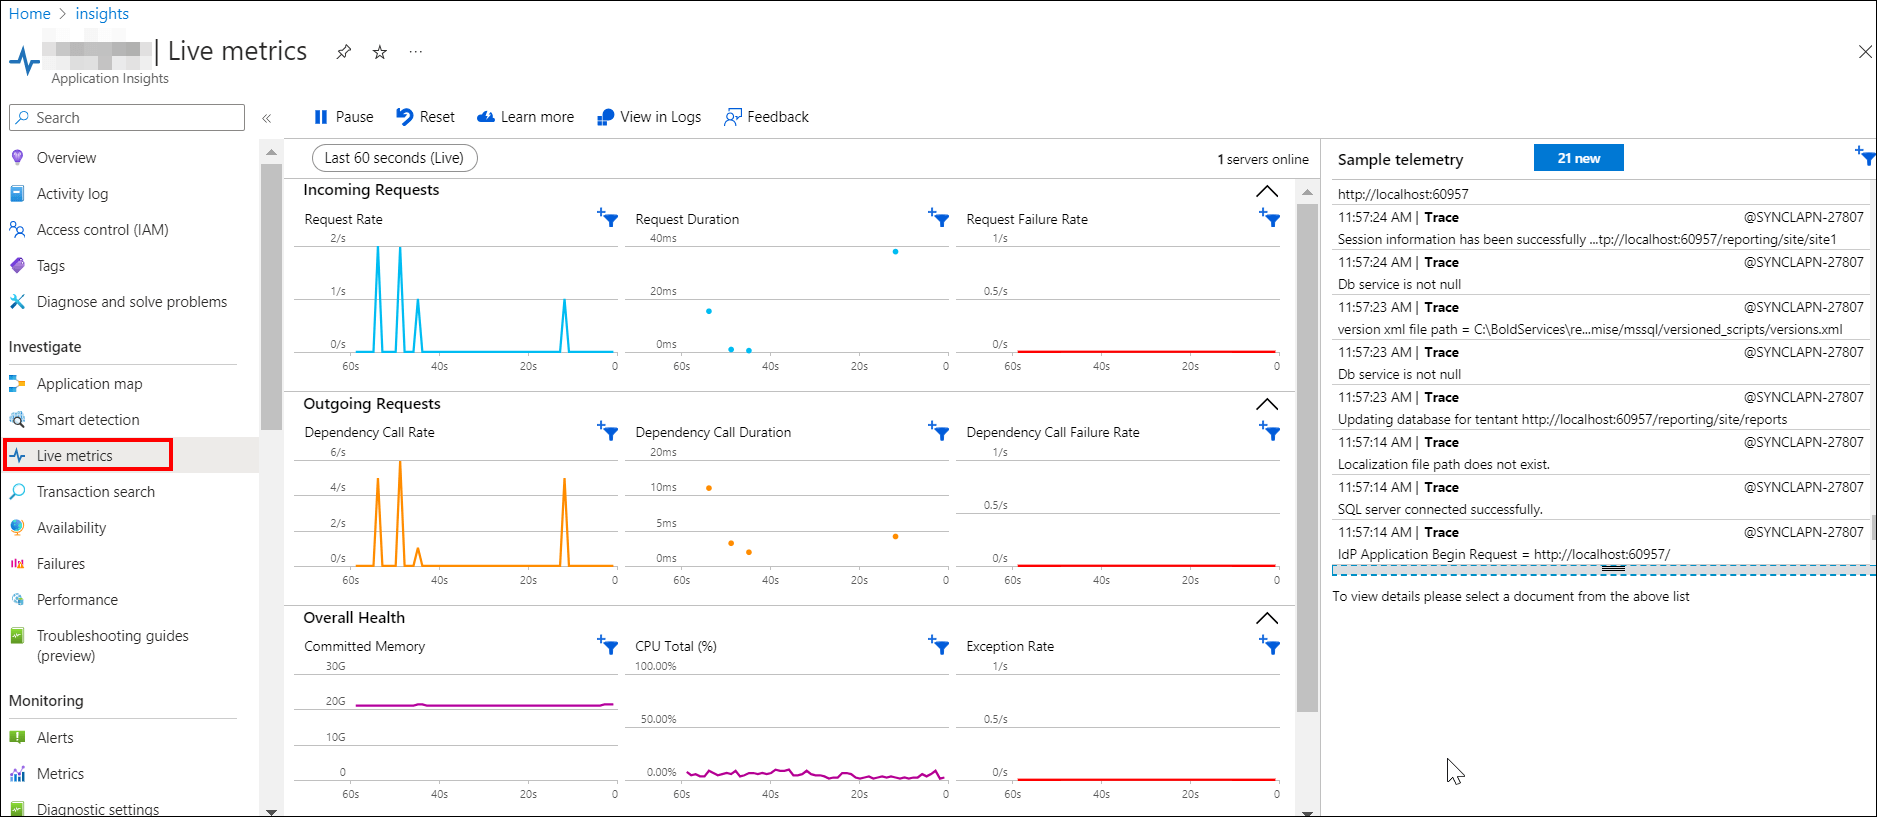
Application Insights integrates with Azure Log Analytics, allowing you to query and analyze log data for deeper insights.
Monitoring Logs in Application Insights
-
After successful integration, go to the
Overviewpage.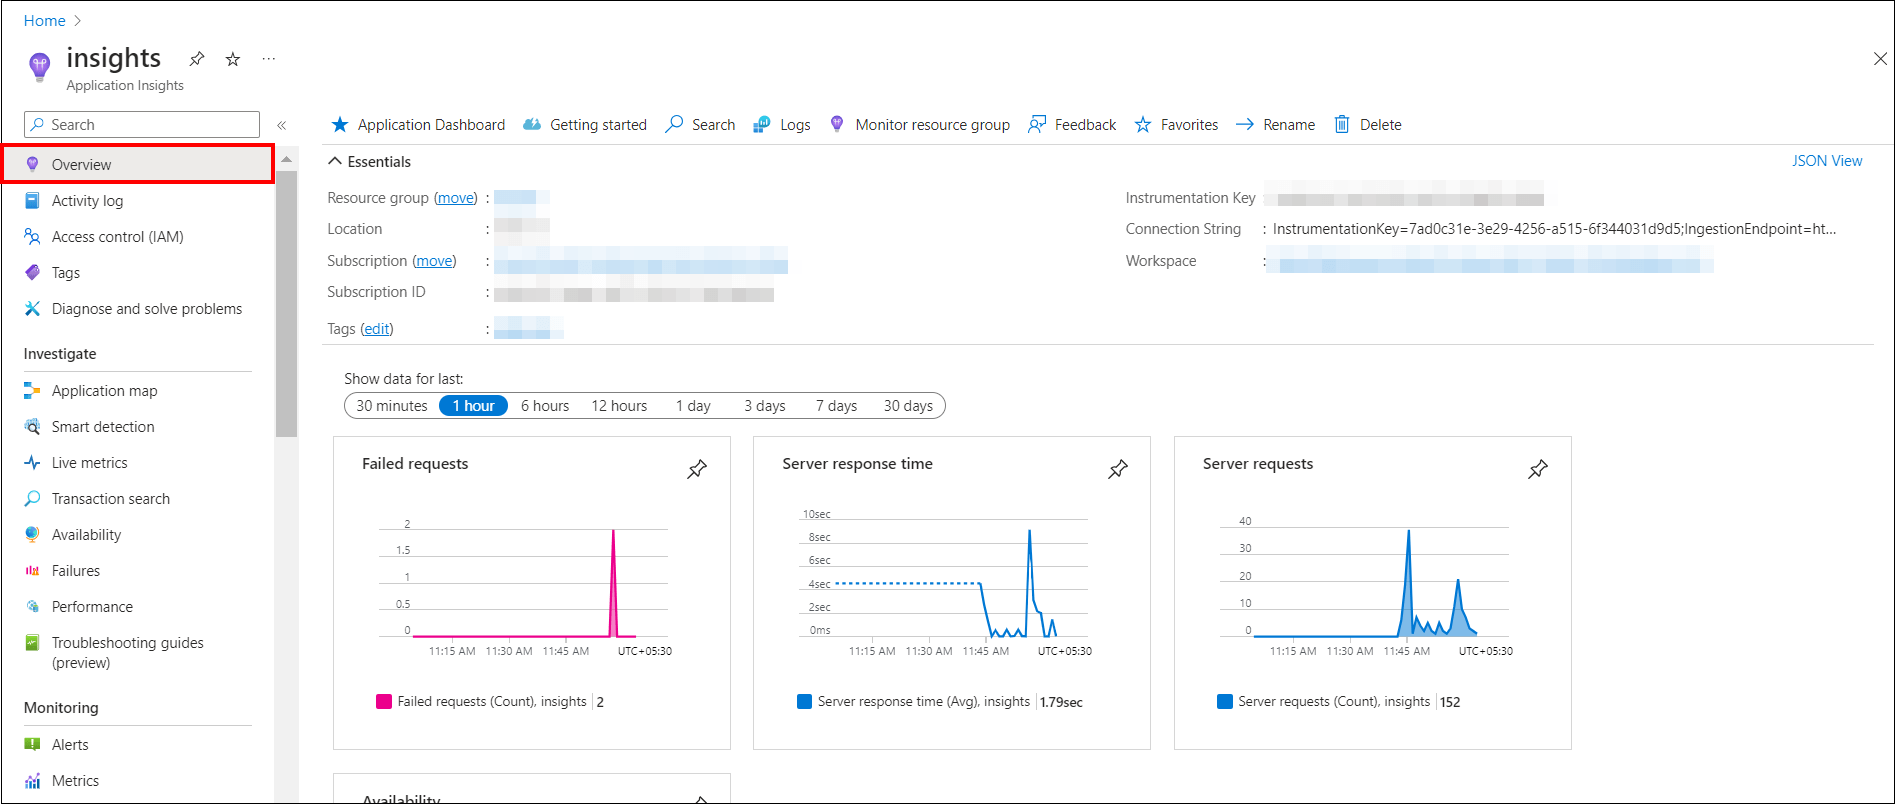
-
Click
Searchand input the necessary log content to locate the logs you require.
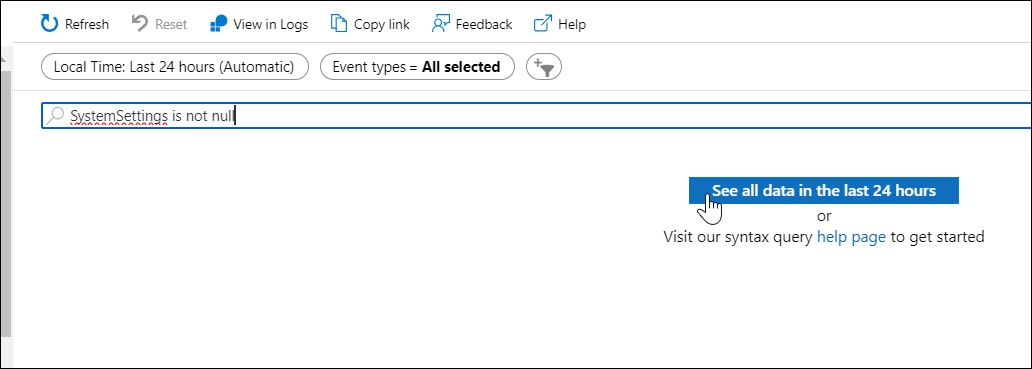
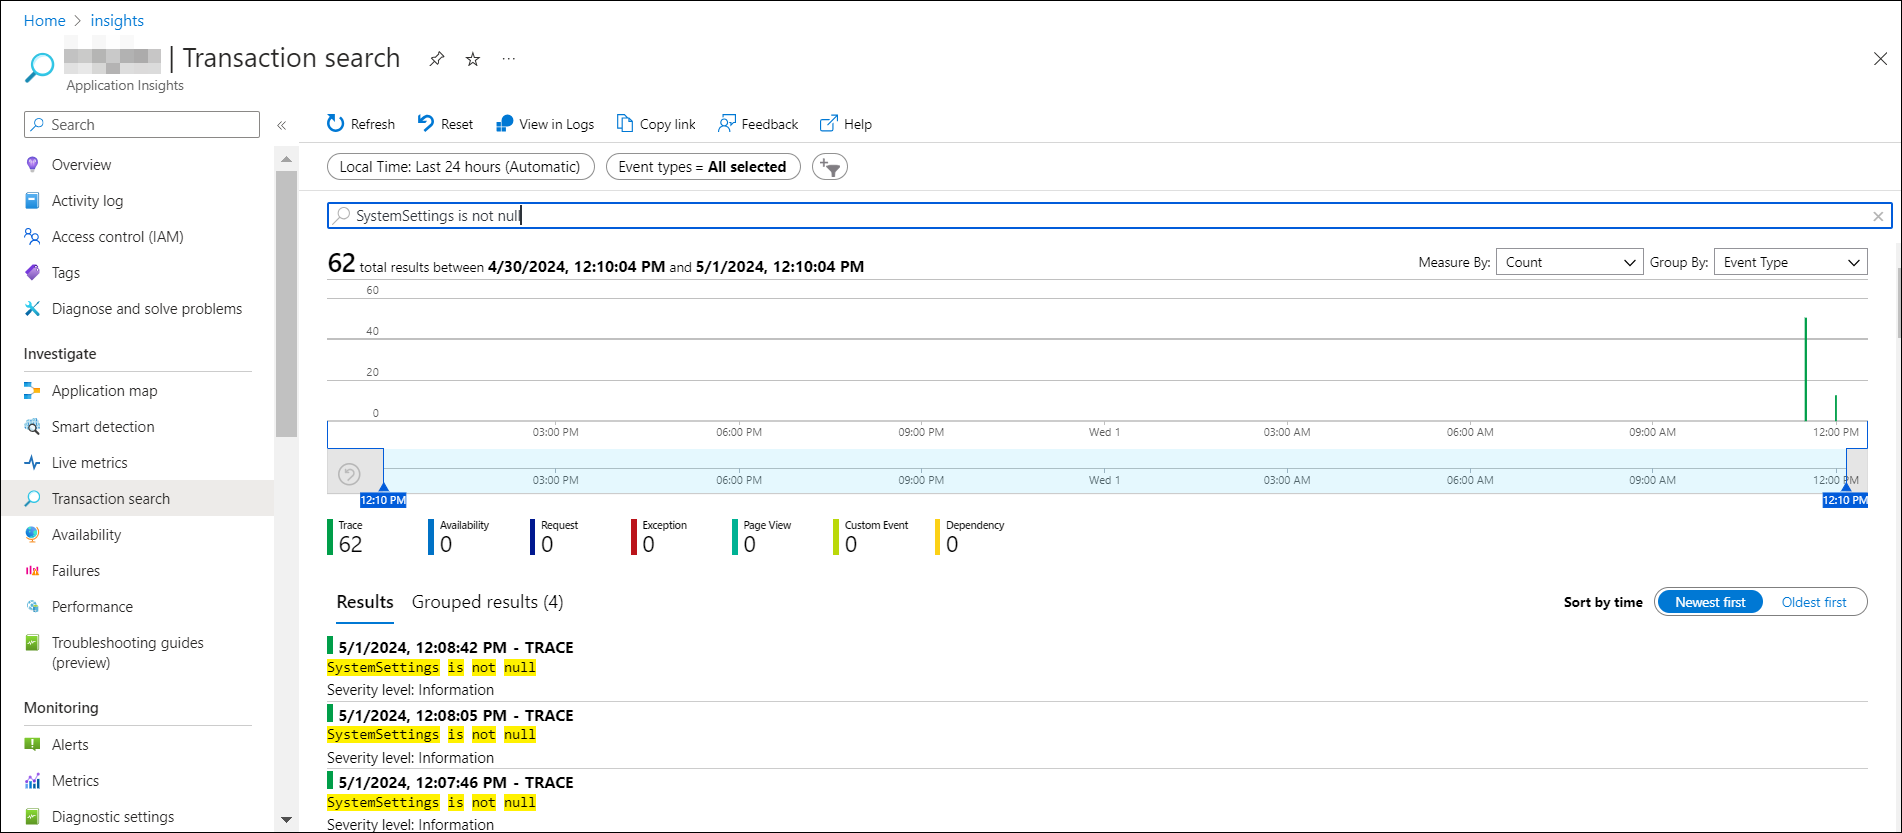
Quering in application insights
Navigate to the Logs menu, then Run the necessary query to retrieve the logs you need.
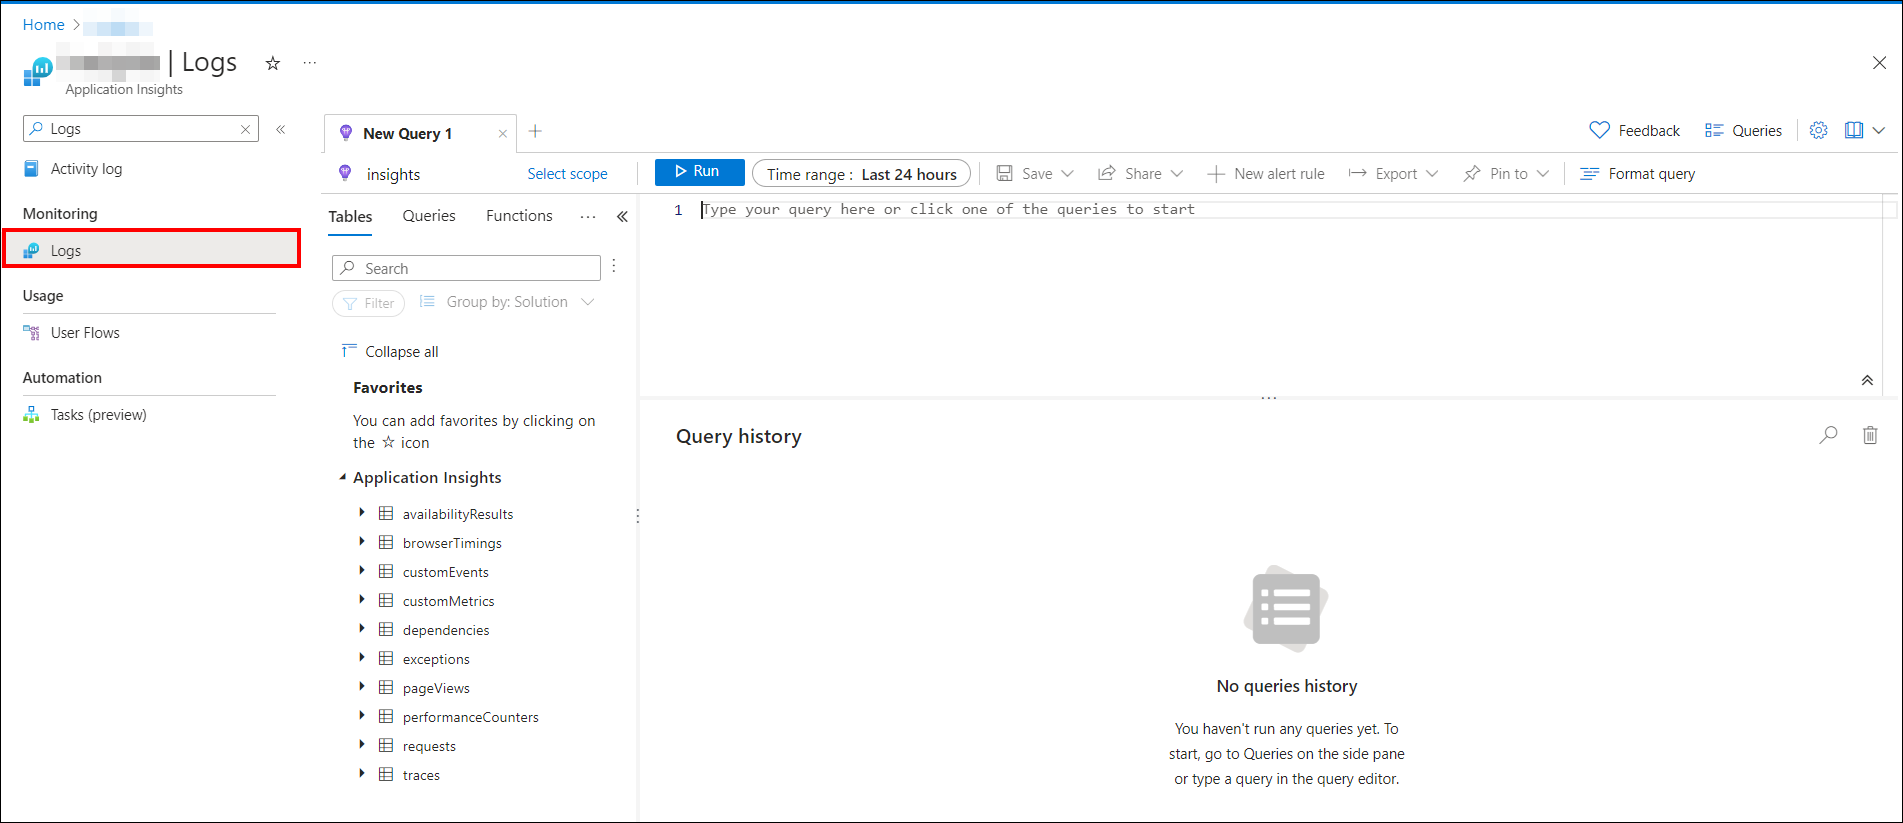
-
To find the
debug-info logs, you need to perform a query astracesand clickRun.traces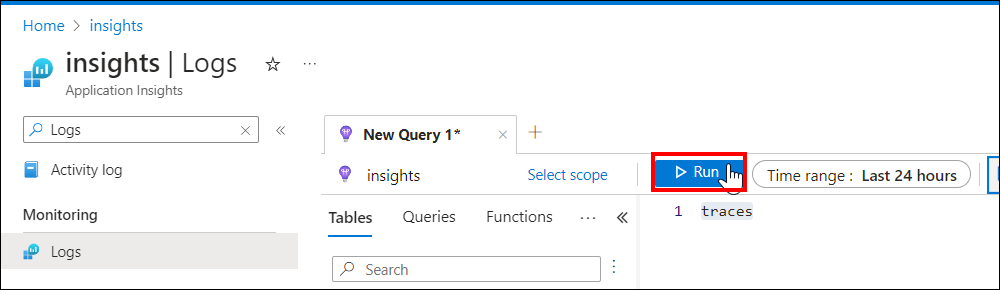
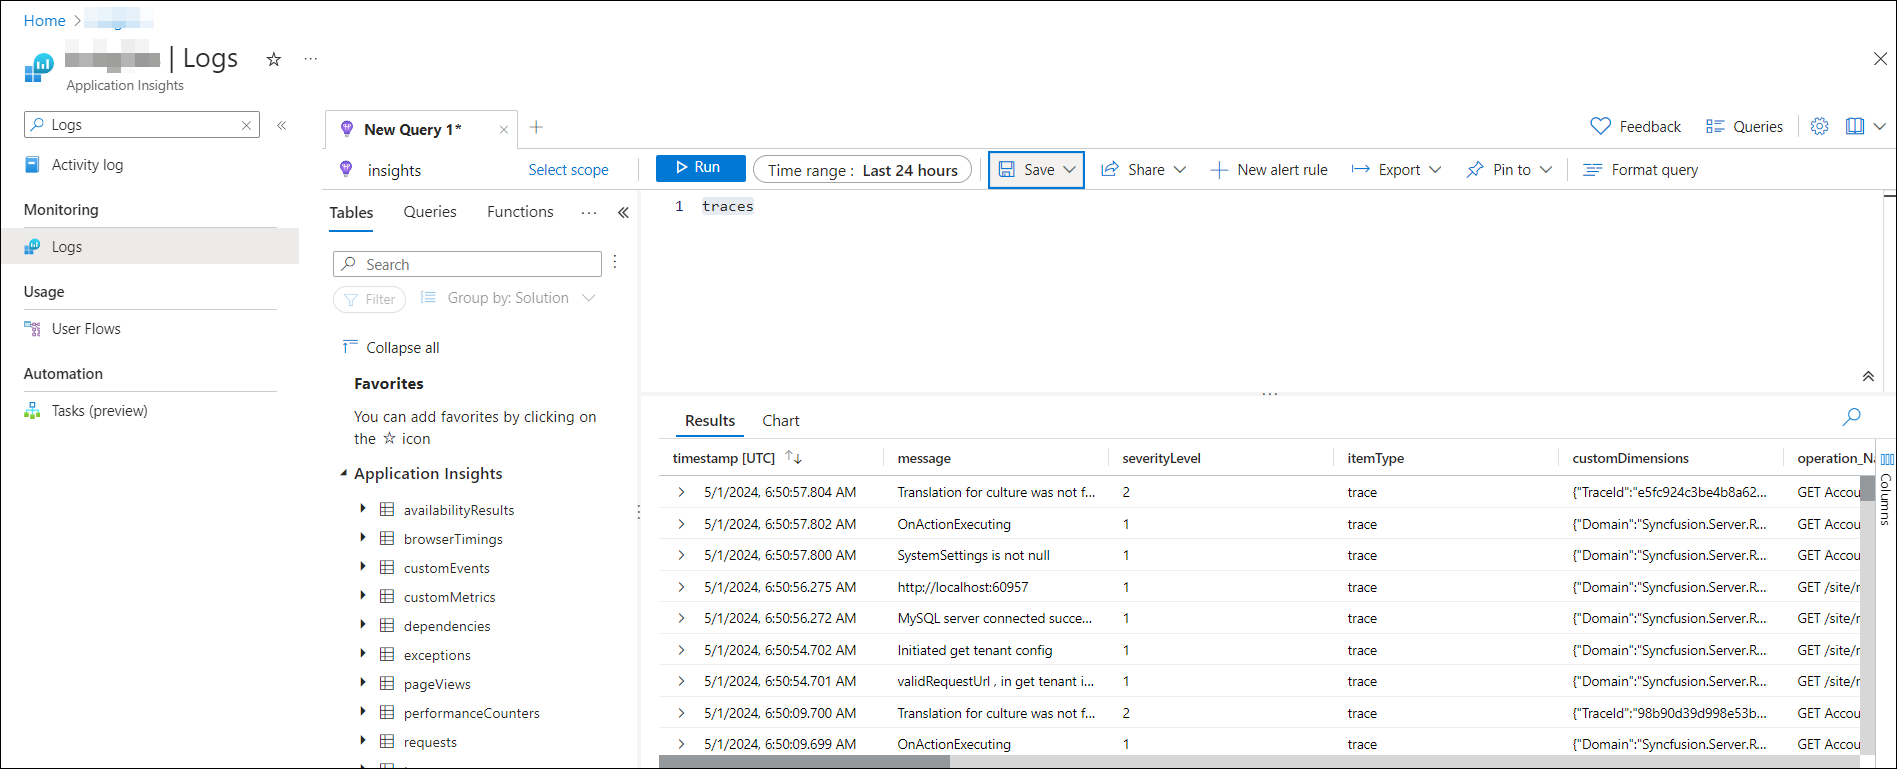
-
To find the
error logs, you need to perform a query such asexceptionsand clickRun. Then you will receive the results as shown in the following screenshot.exceptions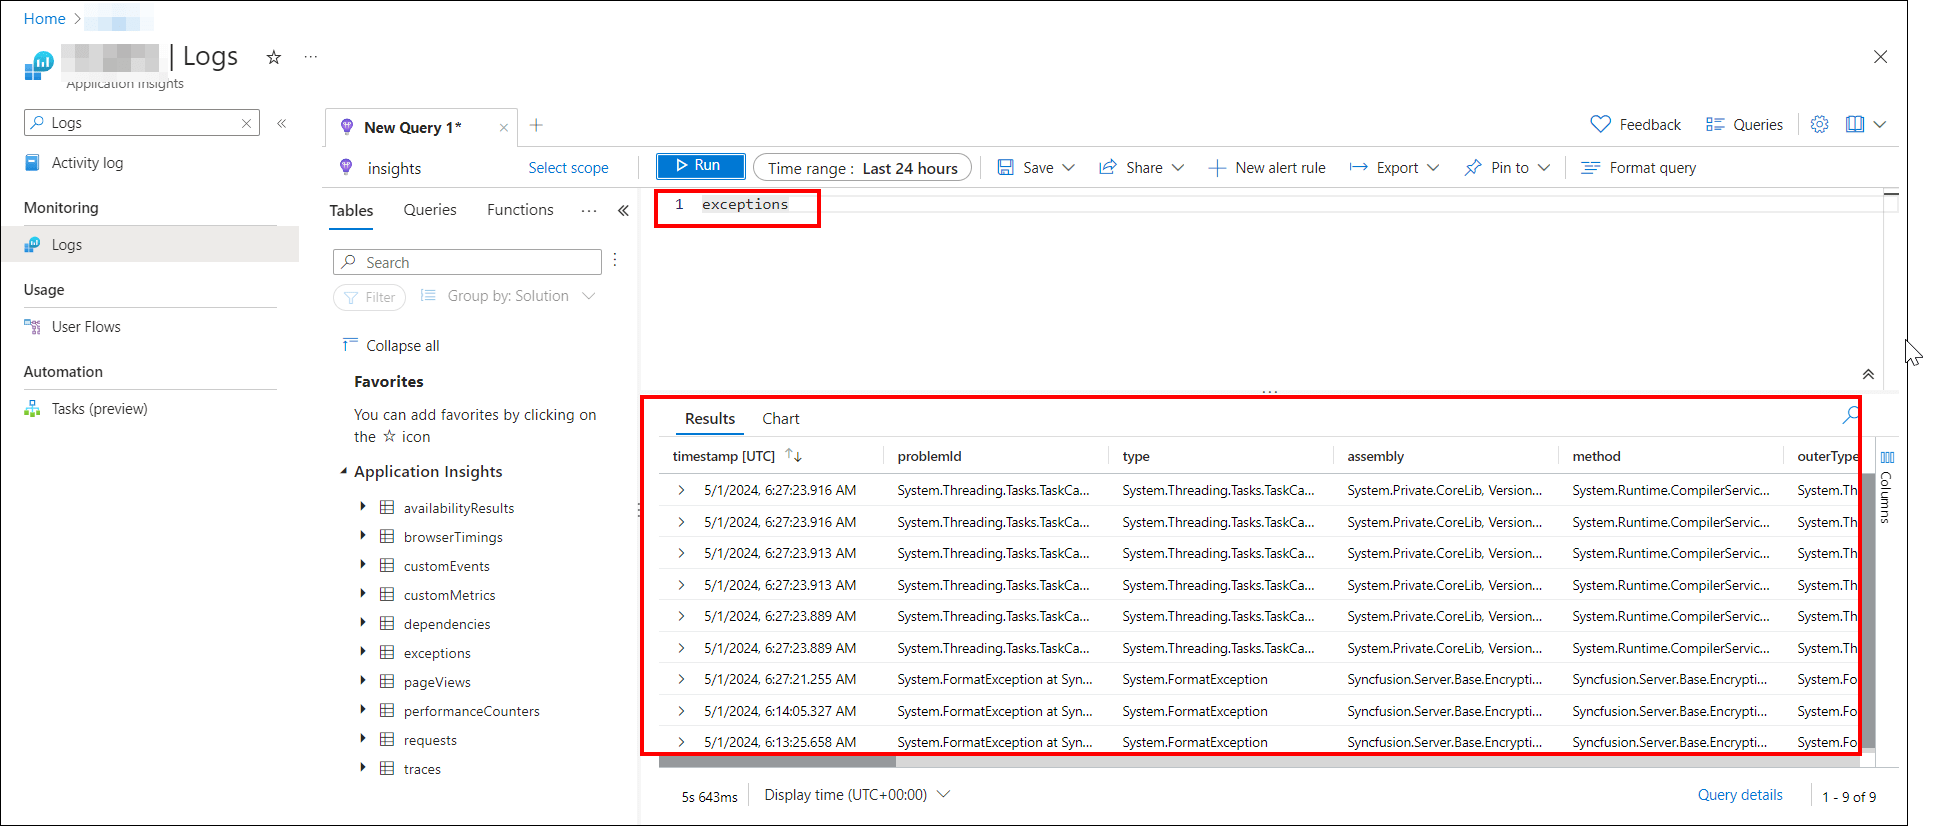
-
To find the
debug-info logsfor specific service, execute the query as follows:-
web(reporting.web)
traces
| where customDimensions["loggername"] == "reporting.web"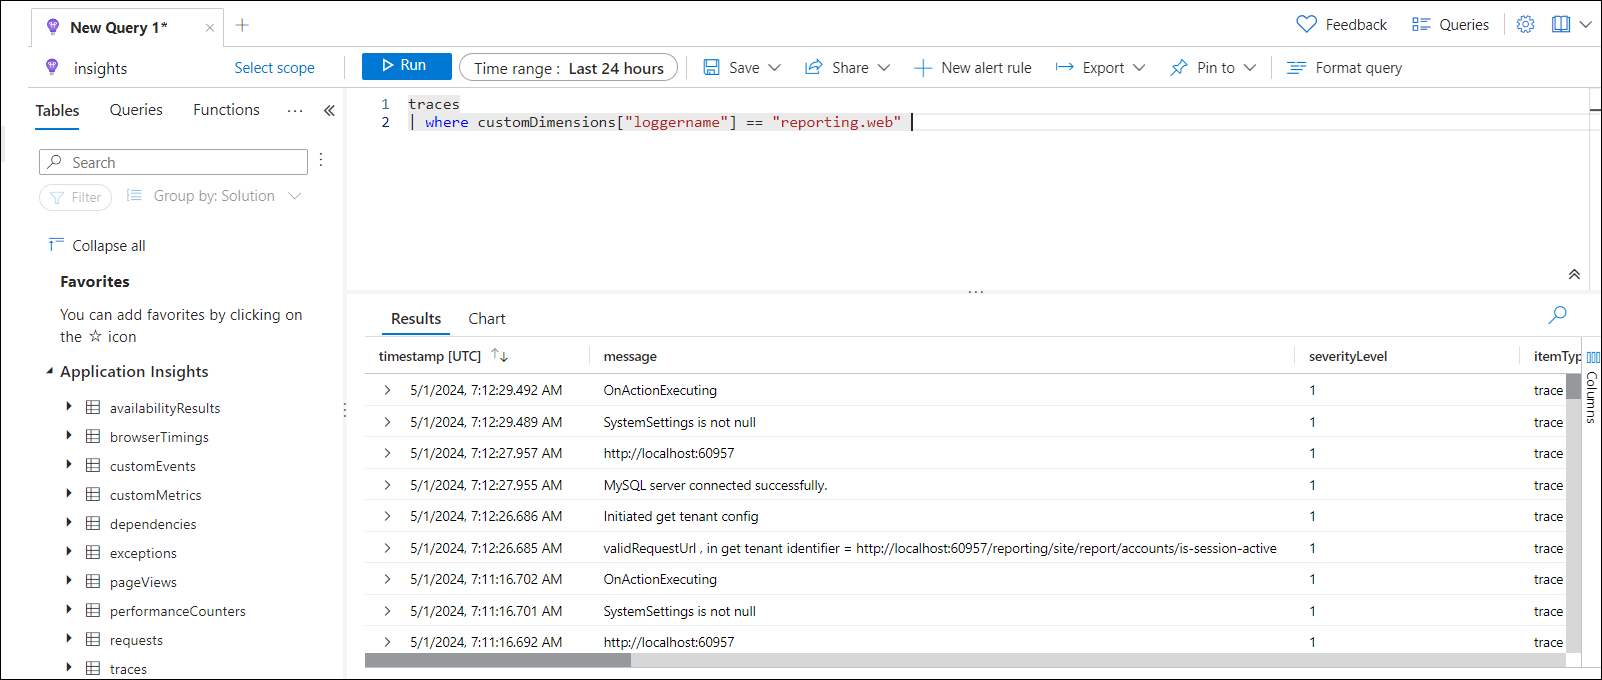
-
jobs(reporting.jobs)
traces
| where customDimensions["loggername"] == "reporting.jobs"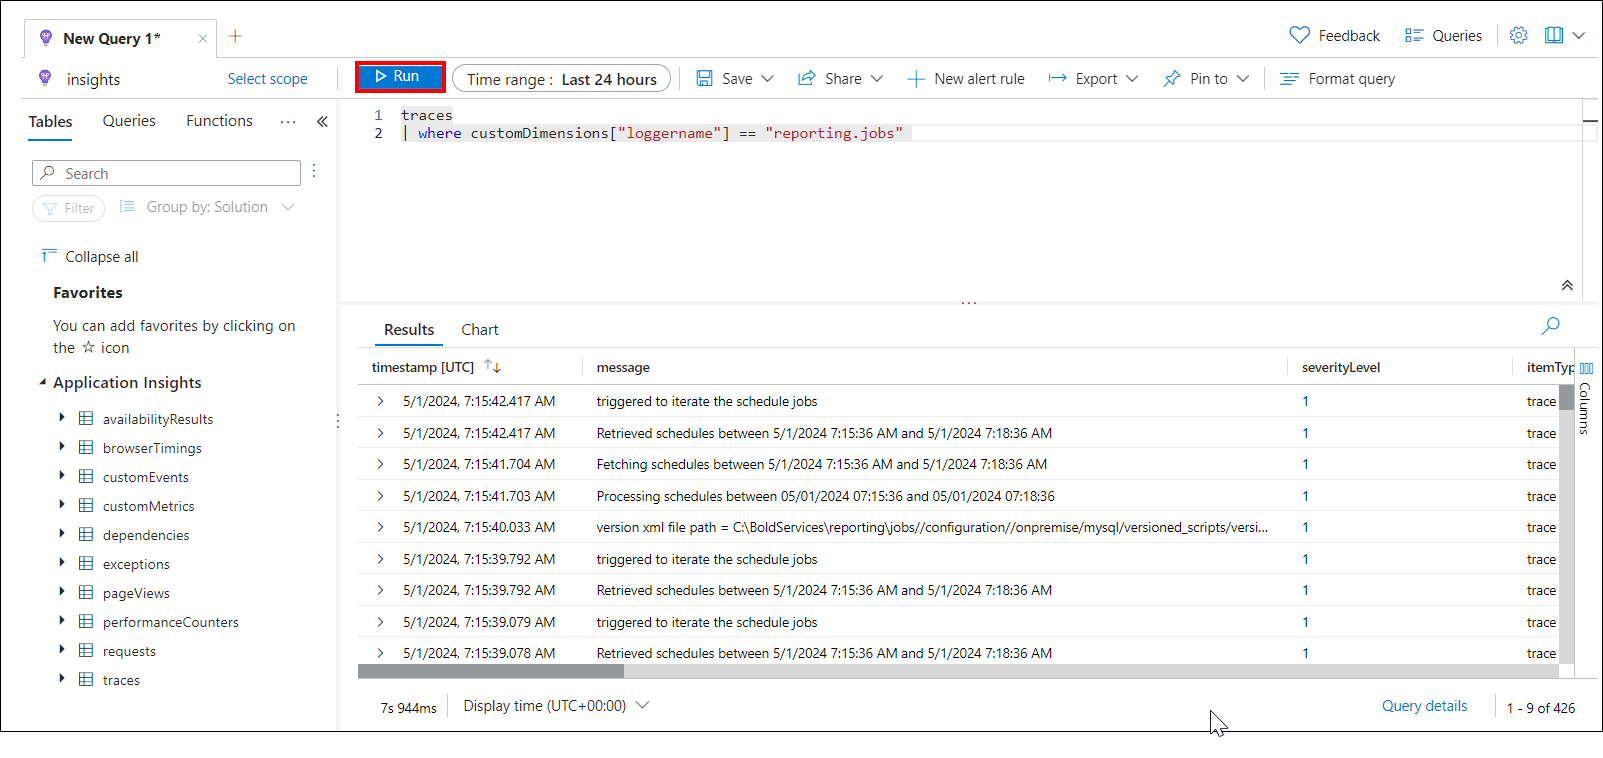
-
api(reporting.api)
traces
| where customDimensions["loggername"] == "reporting.api"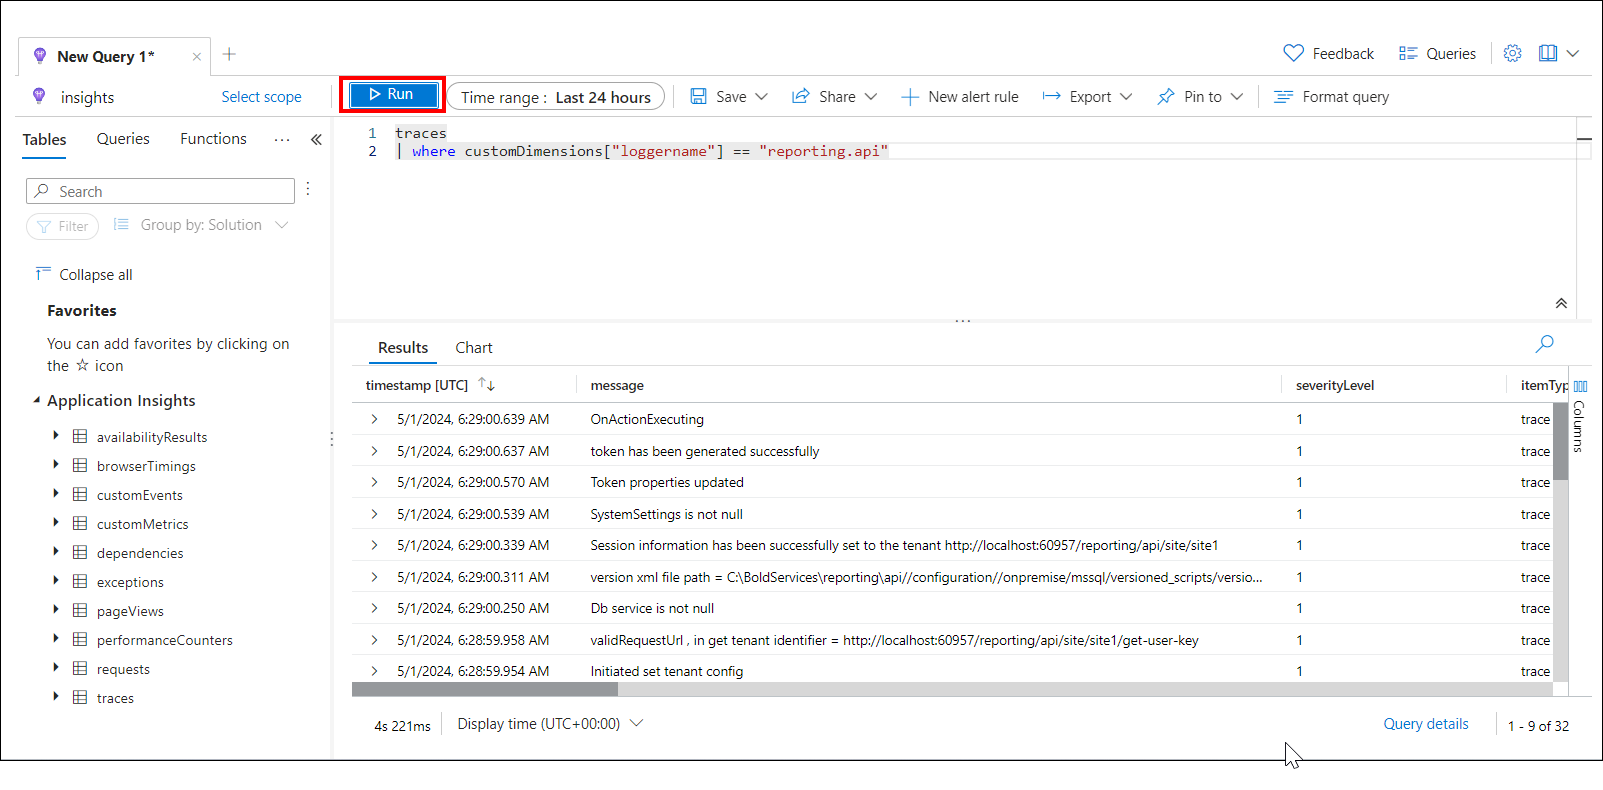
-
viewer(reporting.viewer)
traces
| where customDimensions["loggername"] == "reporting.viewer"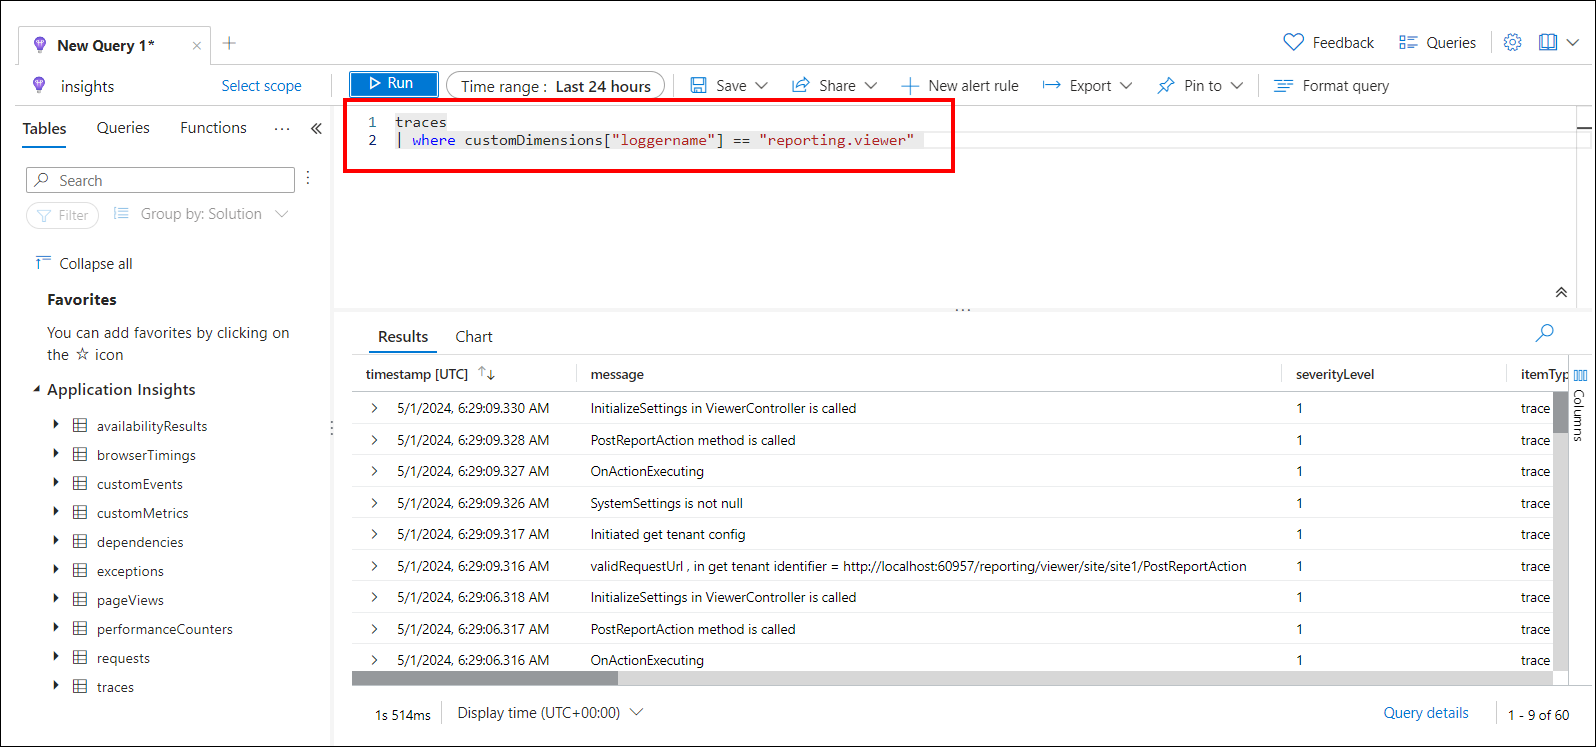
-
-
To find the
error logsfor specific service, execute the query as follows:-
web(reporting.web)
exceptions | where customDimensions["loggername"] == "reporting.web" -
jobs(reporting.jobs)
exceptions | where customDimensions["loggername"] == "reporting.jobs" -
api(reporting.api)
exceptions | where customDimensions["loggername"] == "reporting.api" -
viewer(reporting.viewer)
exceptions
| where customDimensions["loggername"] == "reporting.viewer"
-
-
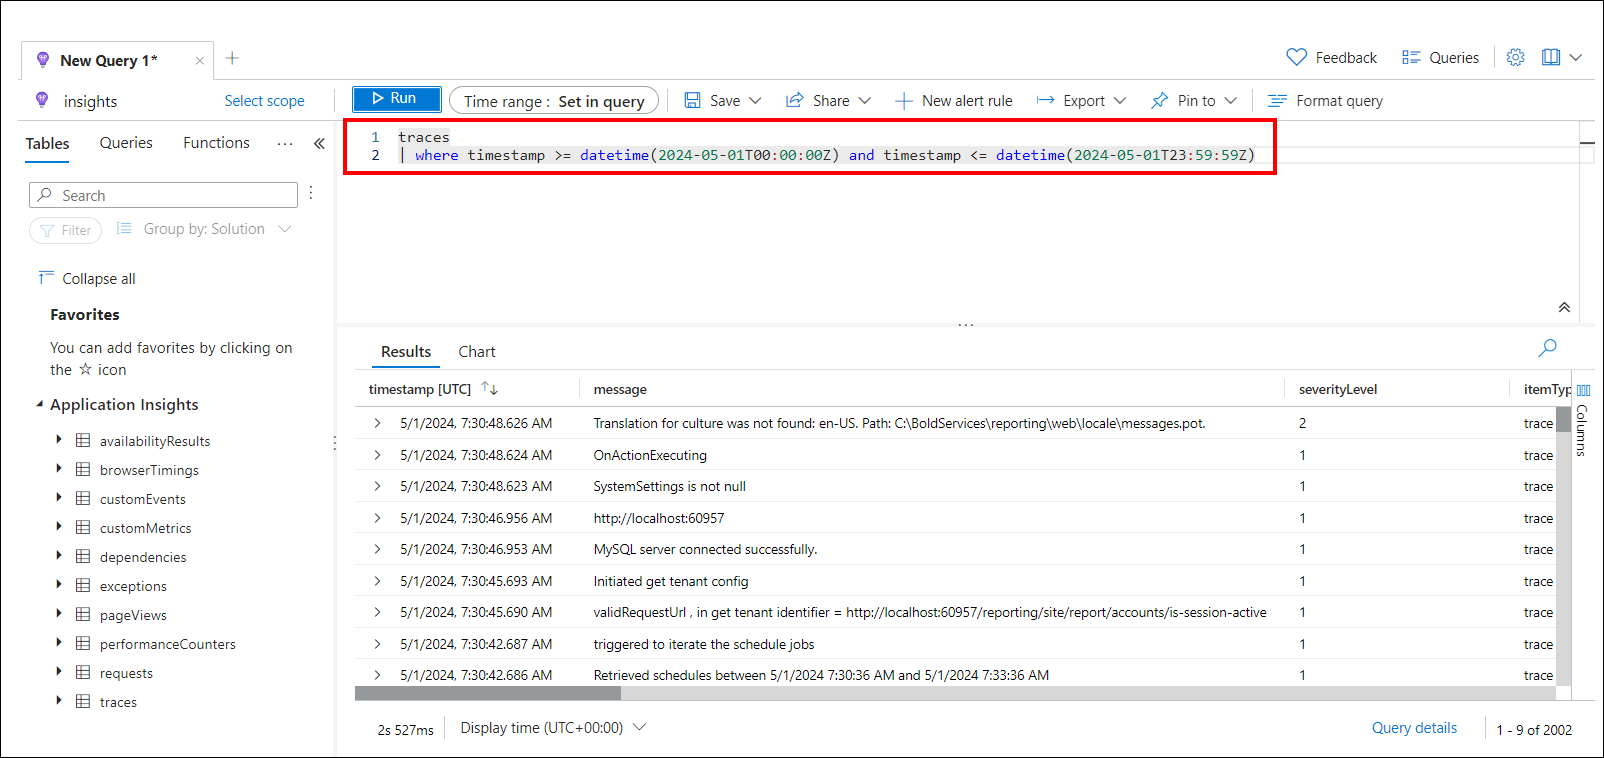
To filter logs by date and time, execute the following query:
traces
| where timestamp >= datetime(2024-03-21T00:00:00Z) and timestamp <= datetime(2024-03-21T23:59:59Z)
Replace with your specific date and time as needed.
-
You can retrieve the logs by specifying the
specific contentswithin the log.traces | search "keyword"Replace
keywordwith the search content.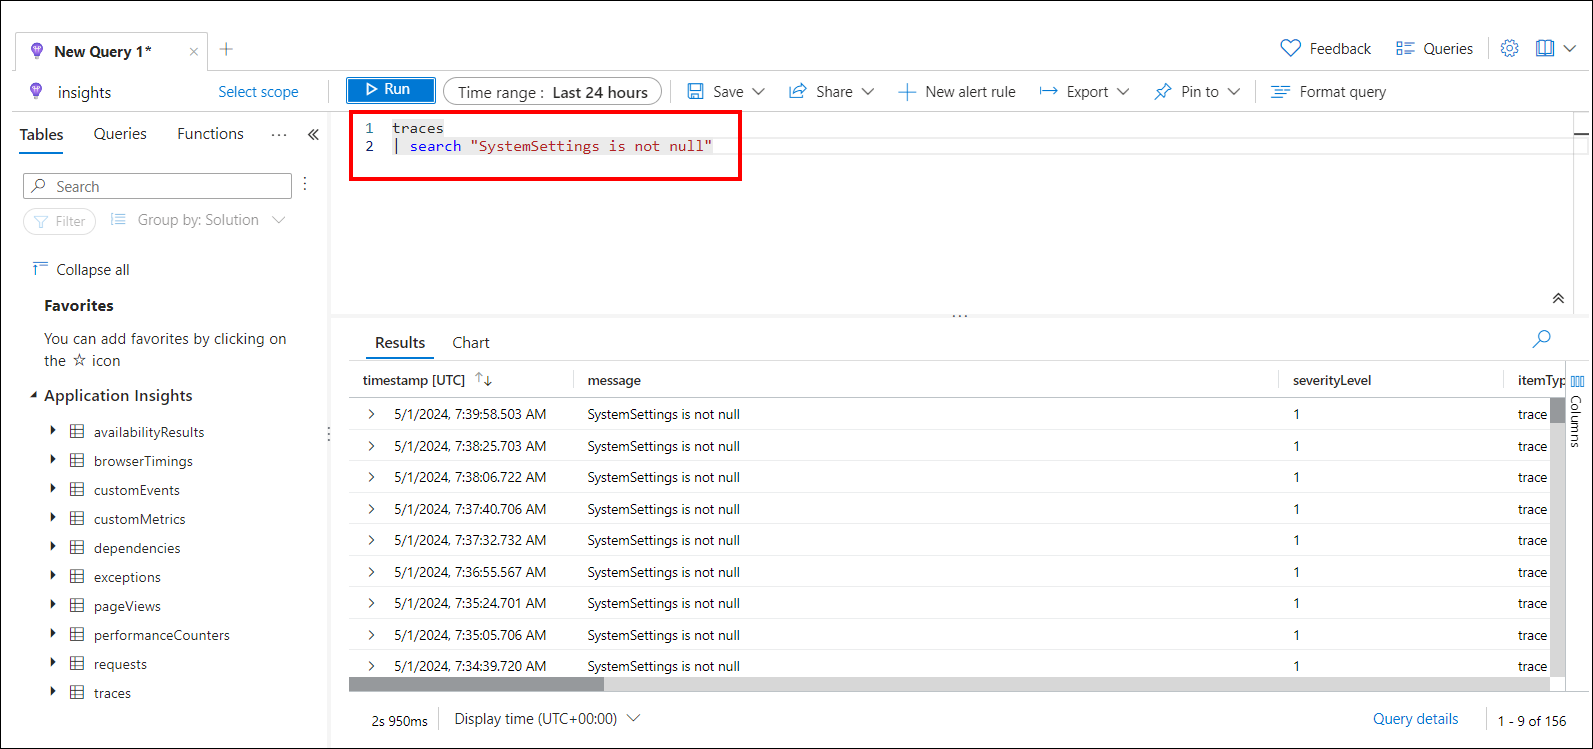
-
You can combine two queries as shown below to find the log. The provided query targets logs related to the
reporting.webservice occurring after March 21, 2024. Specifically, it searches for log entries where theSystemSettings parameter is not null.traces | where customDimensions["loggername"] == "reporting.web" and timestamp >= datetime(2024-03-21T00:00:00Z) | search "SystemSettings is not null"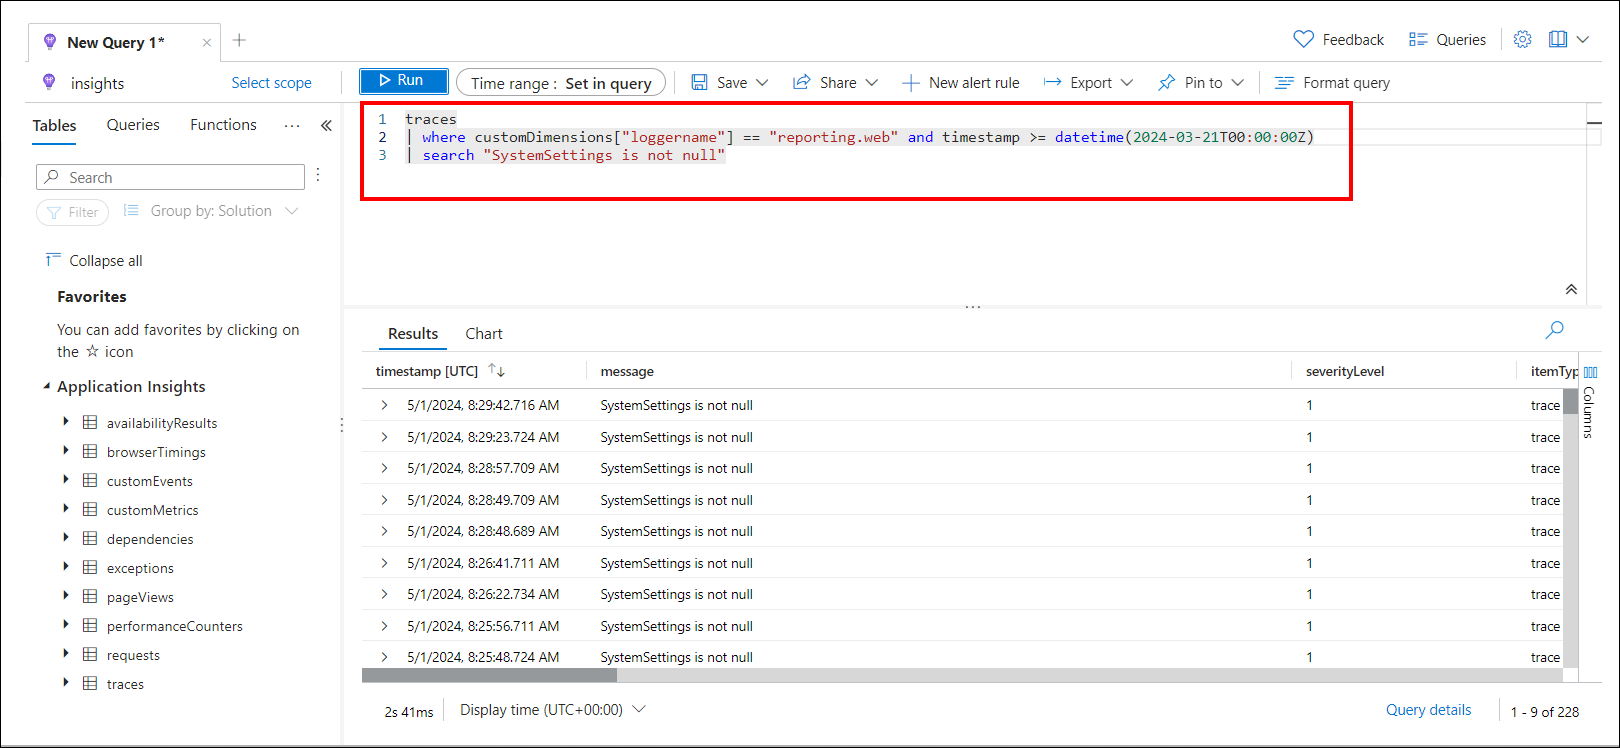
-
To retrieve all the request calls in the application, execute the below query:
requests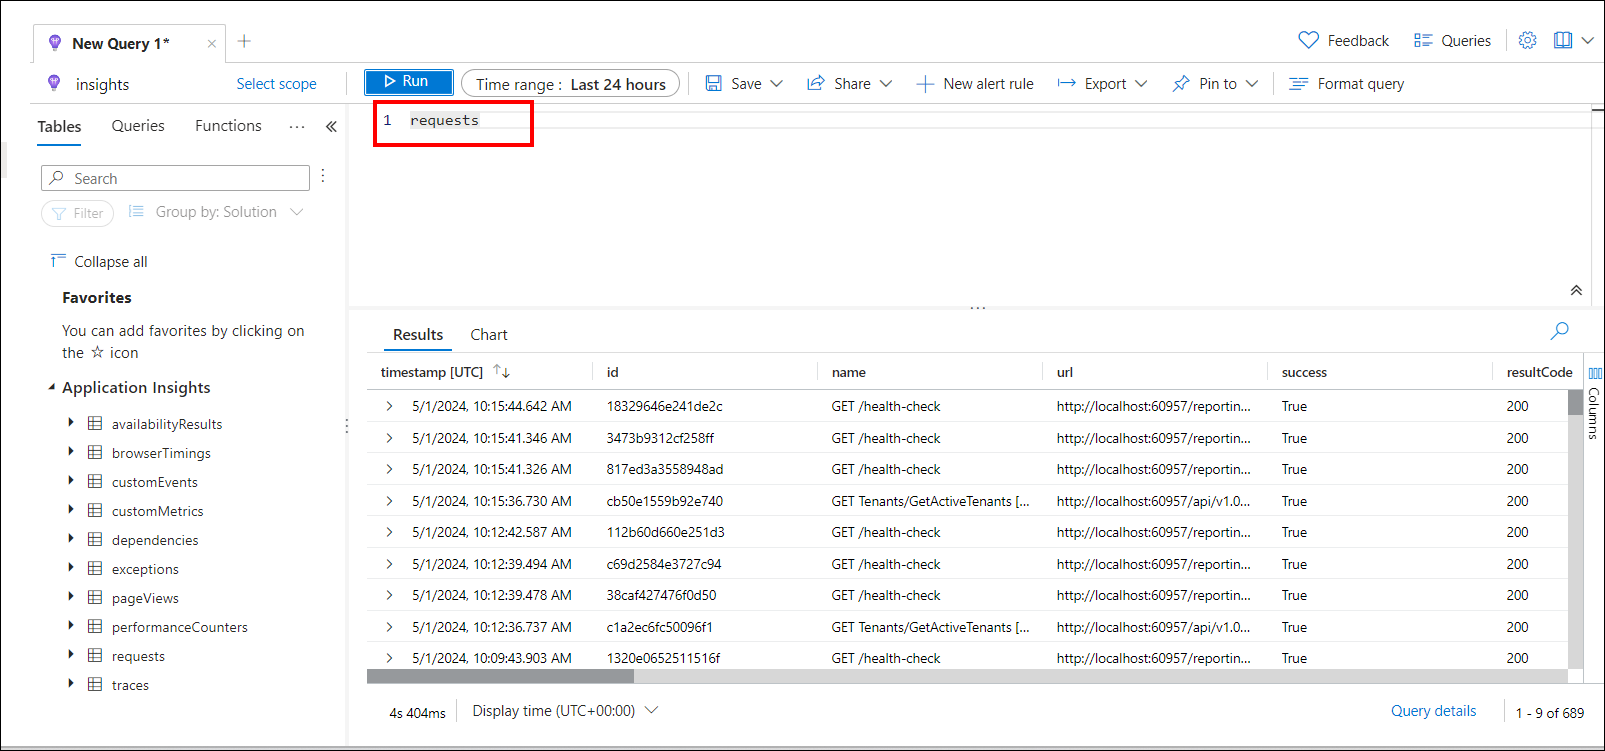
-
To retrieve frequent requests by URL count, use the following query:
requests
| summarize RequestCount = count() by url
| order by RequestCount desc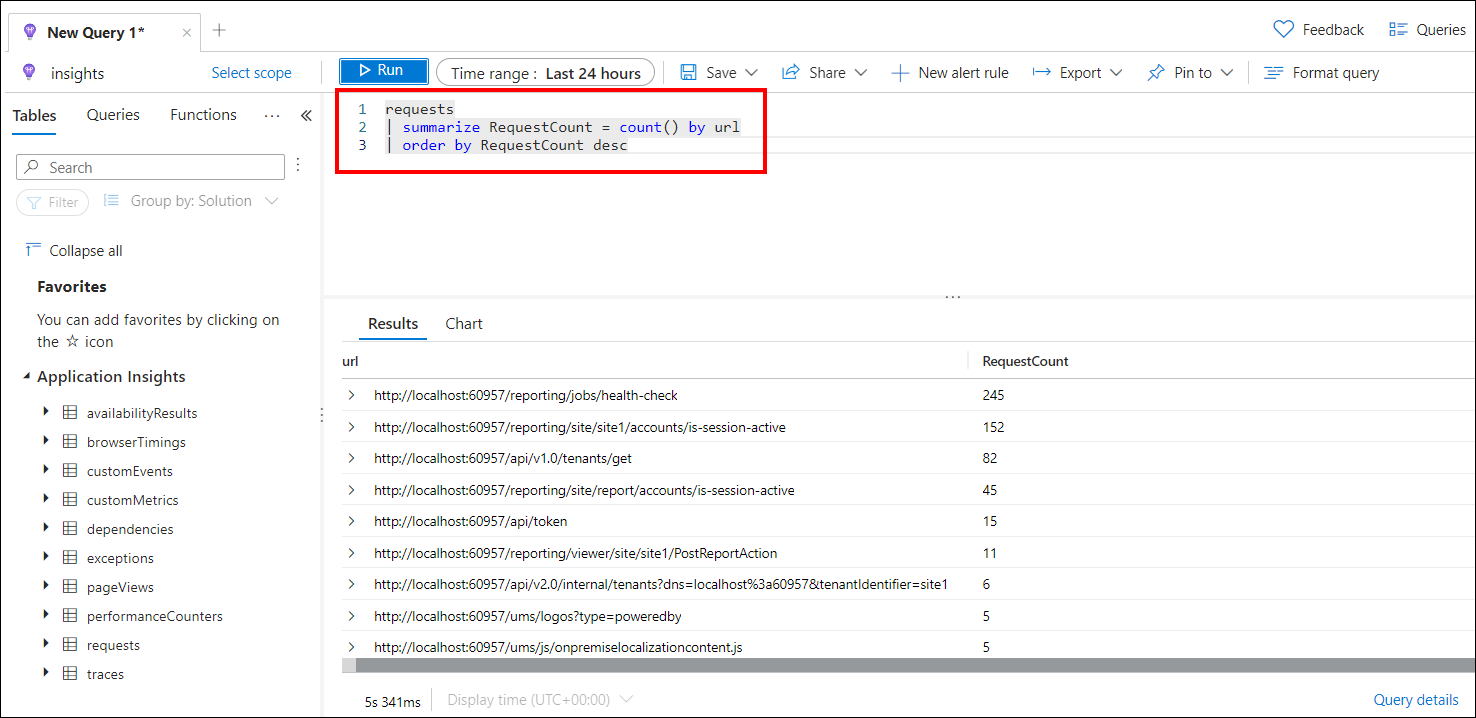
-
To count the number of requests made to a specific URL endpoint, use the following query:
requests
| where url == " http://localhost:51778/reporting/site/insights1/reports/d9116932-b3bb-4a8a-92b2-1c7ea7bd7193/Tutorial Sample/Table?showmyreports=1"
| summarize count() by url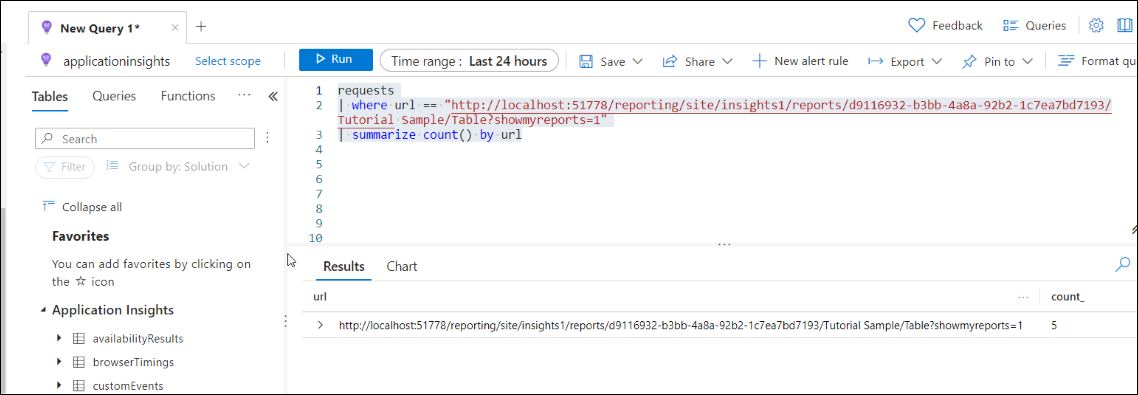
-
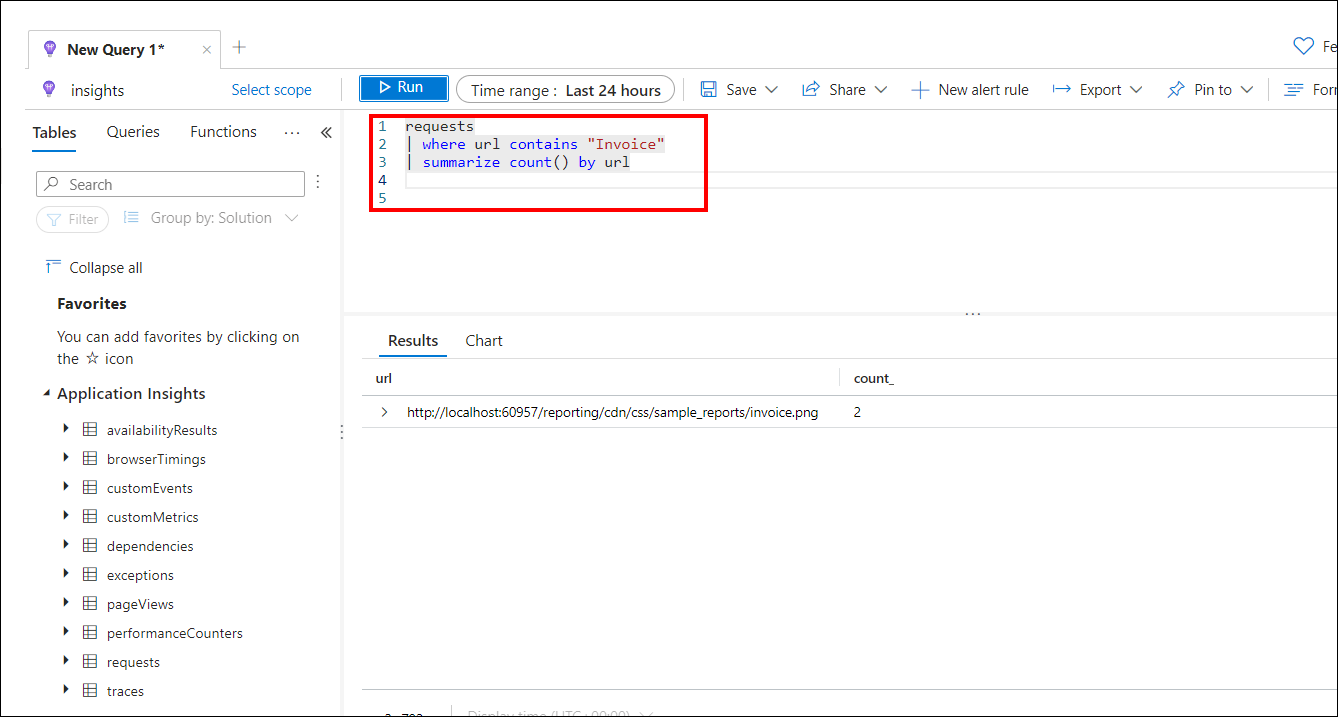
To retrieve requests based on the name of a report, use the following query:
requests
| where url contains "Invoice"
| summarize count() by url
Replace the name
Invoicewith the report name based on the search.
Export logs
You have the option to export logs from Application Insights.
-
Navigate to
Application Insights, then select theLogsmenu. Run the necessary query to generate the required logs. -
Then, select the
Exportoption for the generated logs and choose CSV.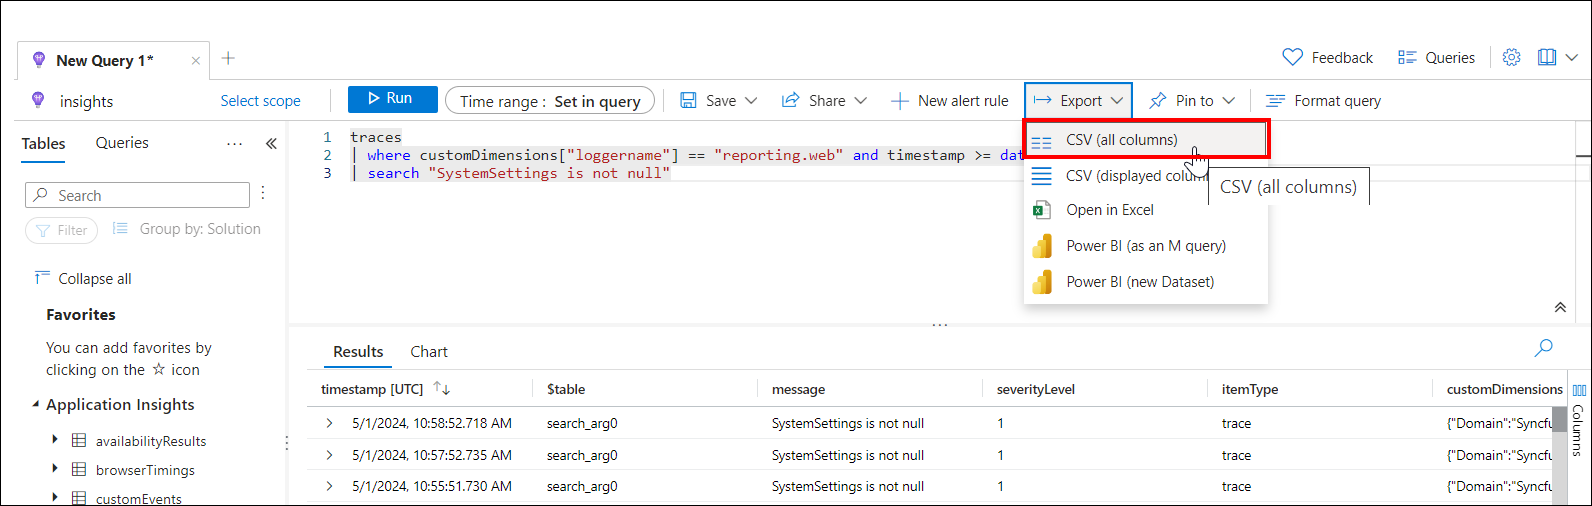
-
Once downloaded, you can view the logs locally by opening the CSV file.
Live metrics
-
Navigate to
Application Insights, then click on theLive metricsmenu.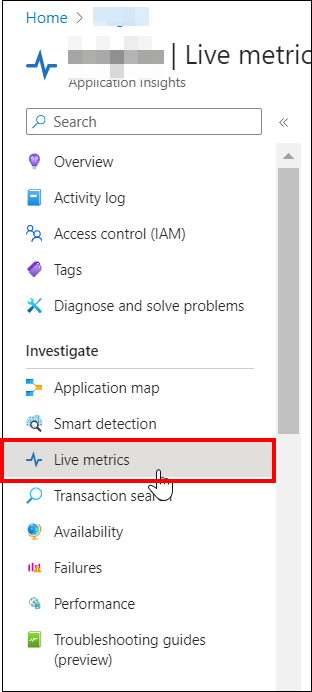
-
On the
Live metricspage, you can see all the live request traces under theSample telemetrytab.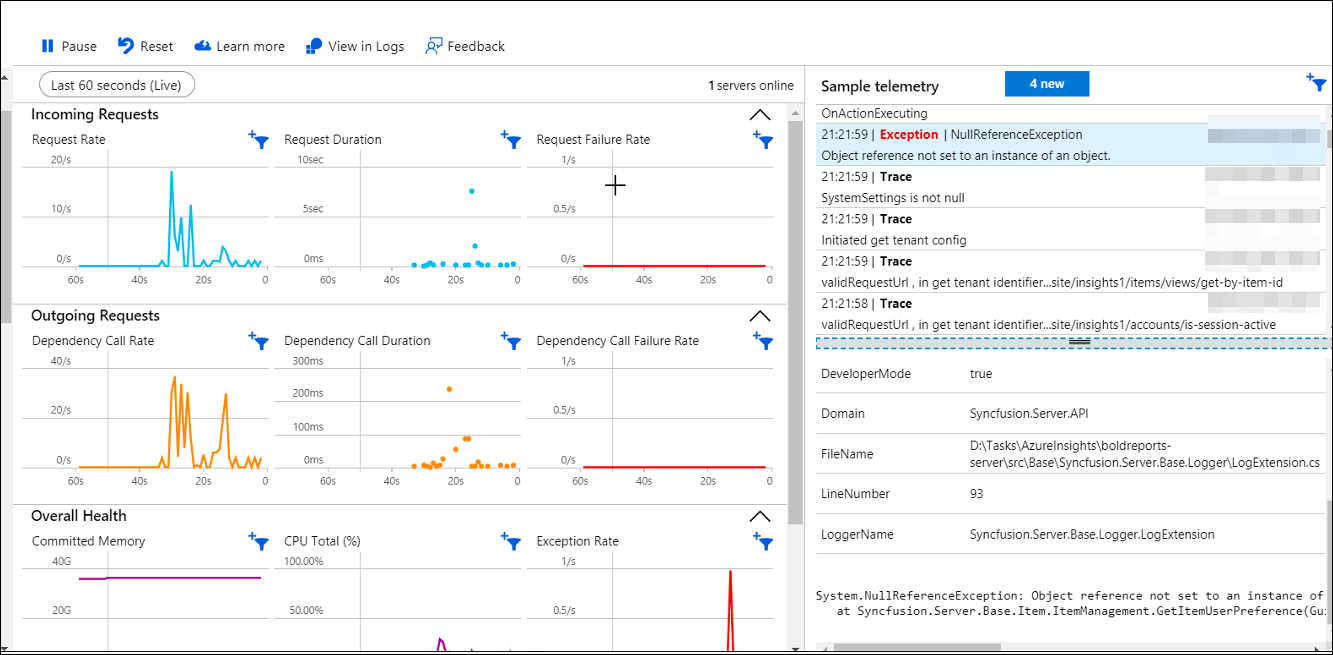
Events
-
Navigate to the
Eventsmenu in Application Insights.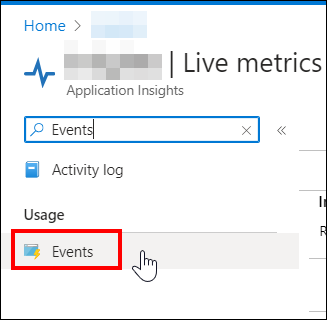
-
Then click
View More Insights, and it will load all the event statistics.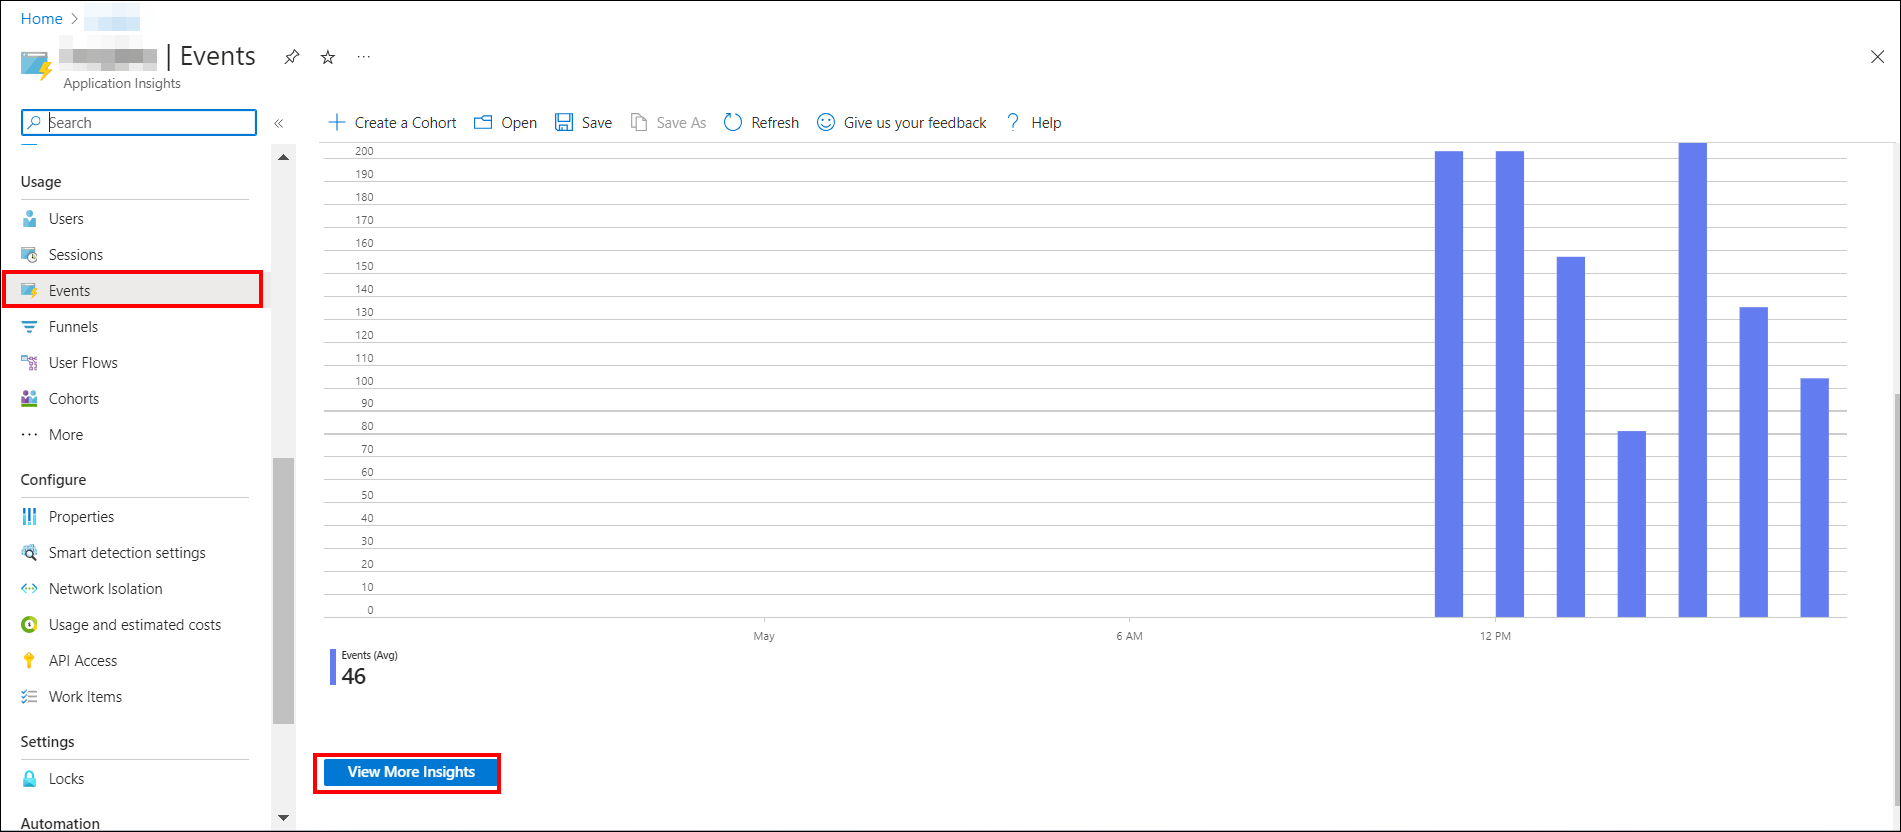
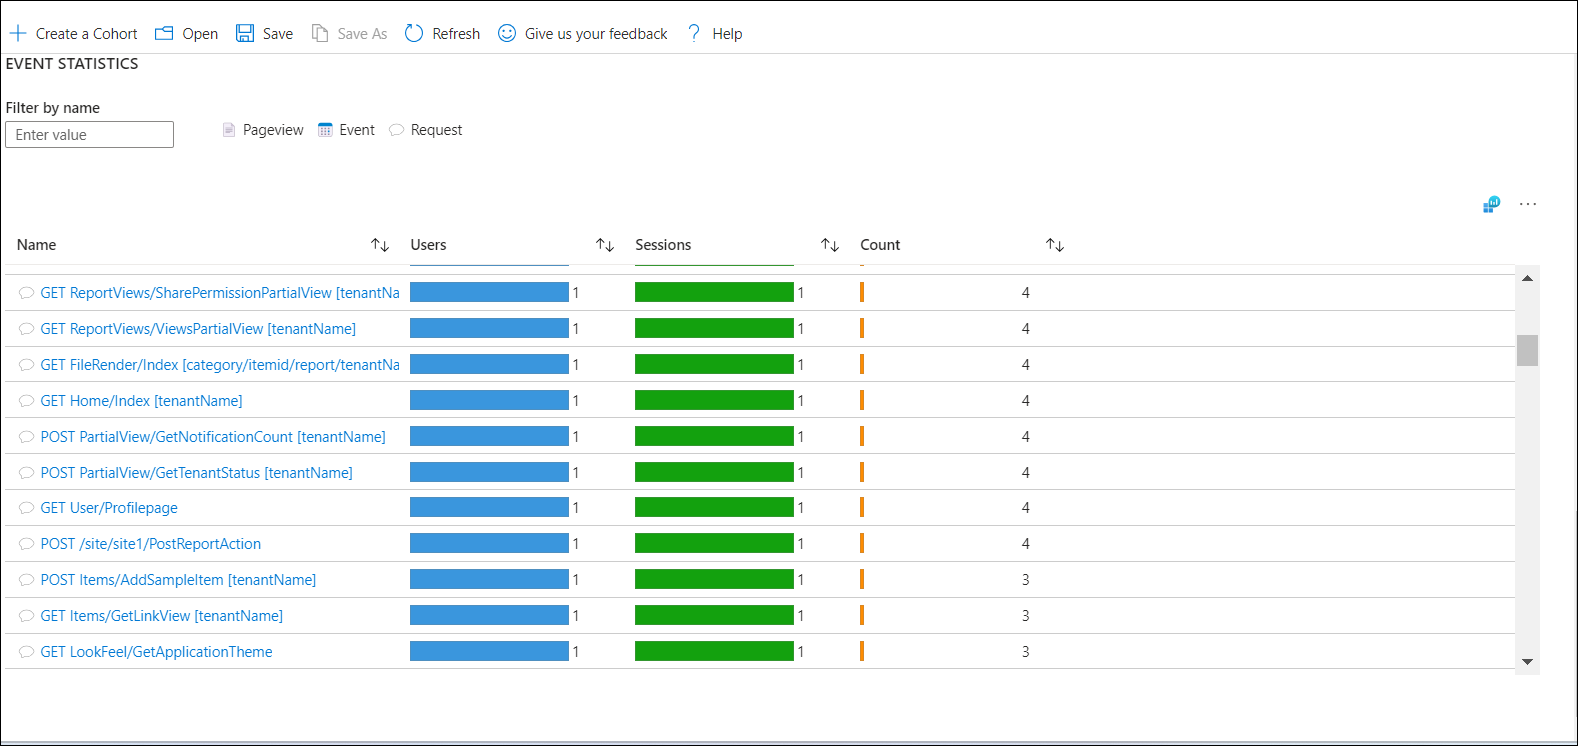
-
Click on the request for which you want to see the full details of the event.
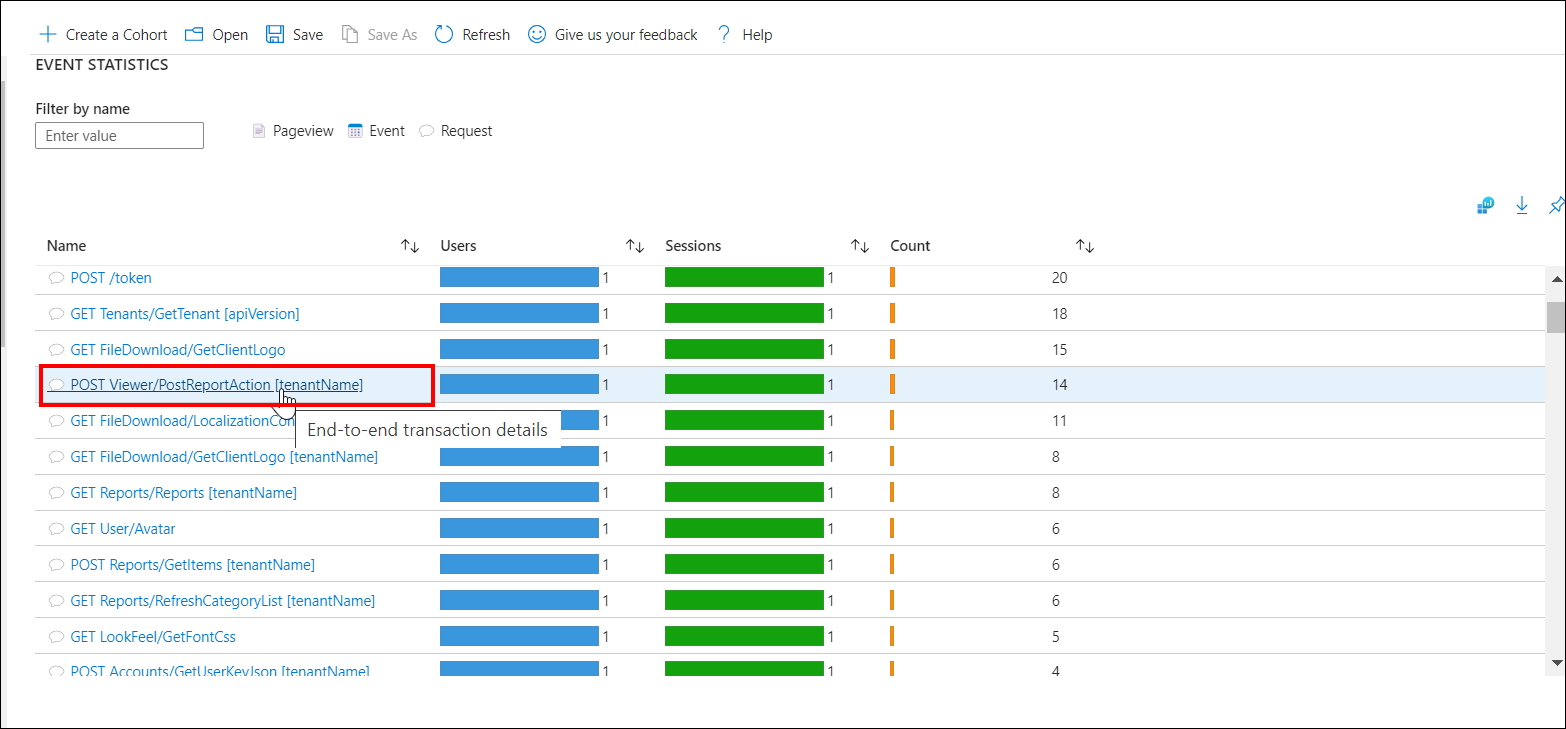
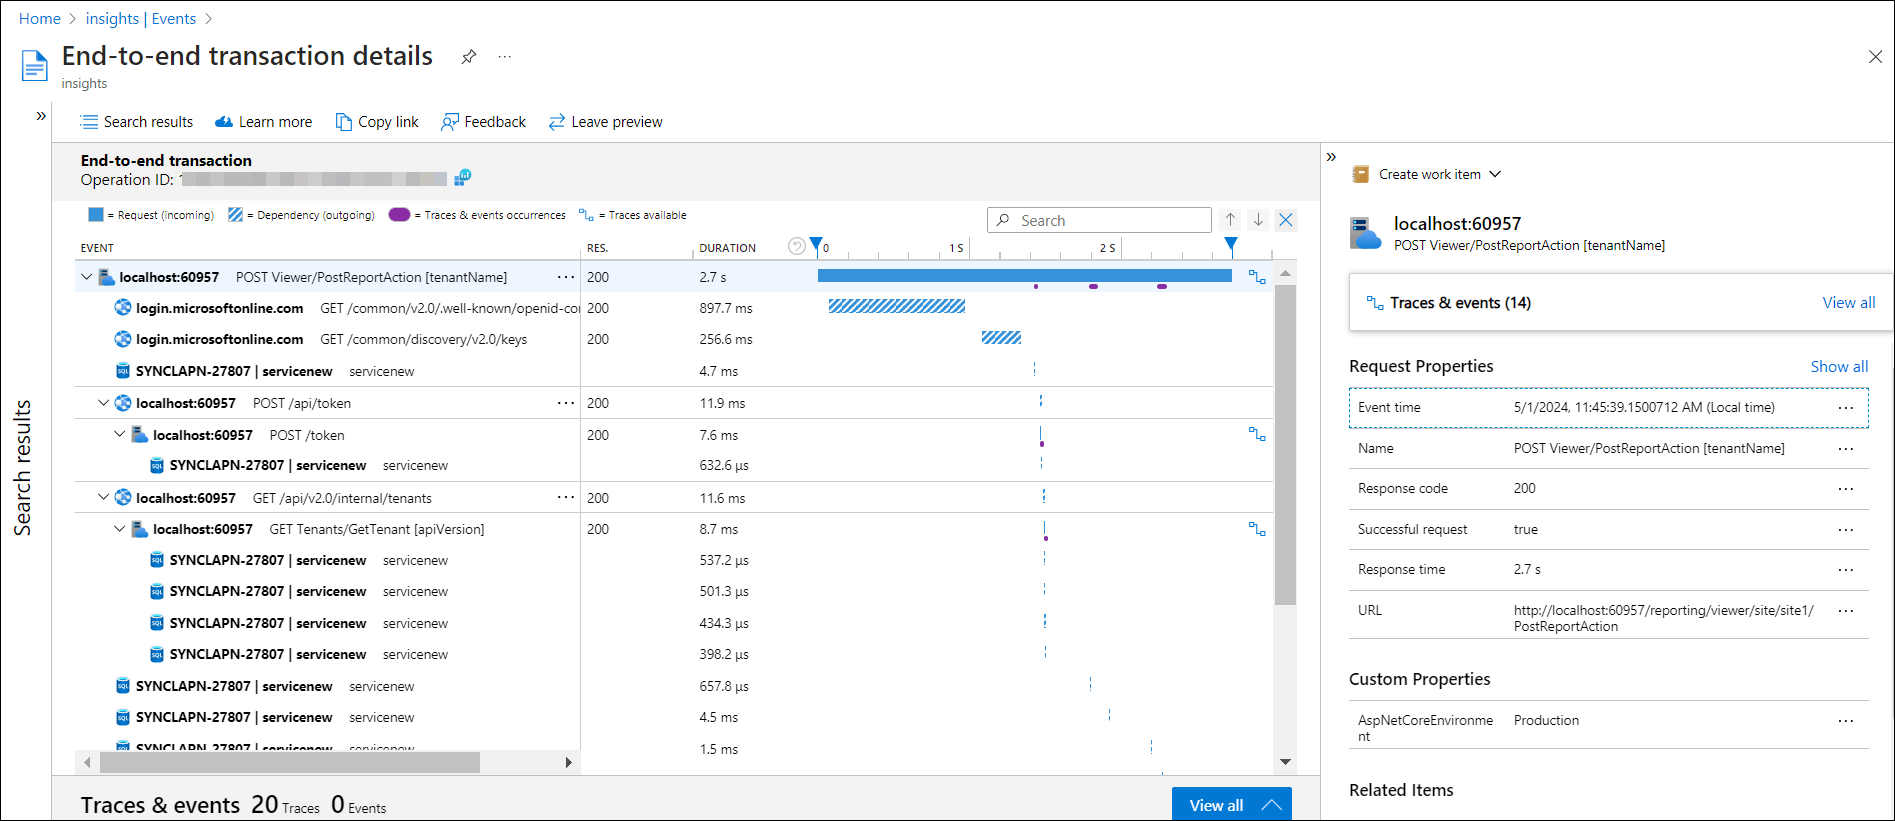
Successful Requests
-
Navigate to the
Performancemenu in Application Insights.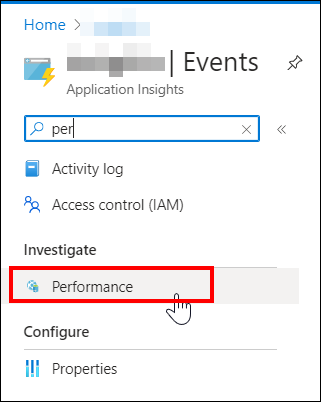
-
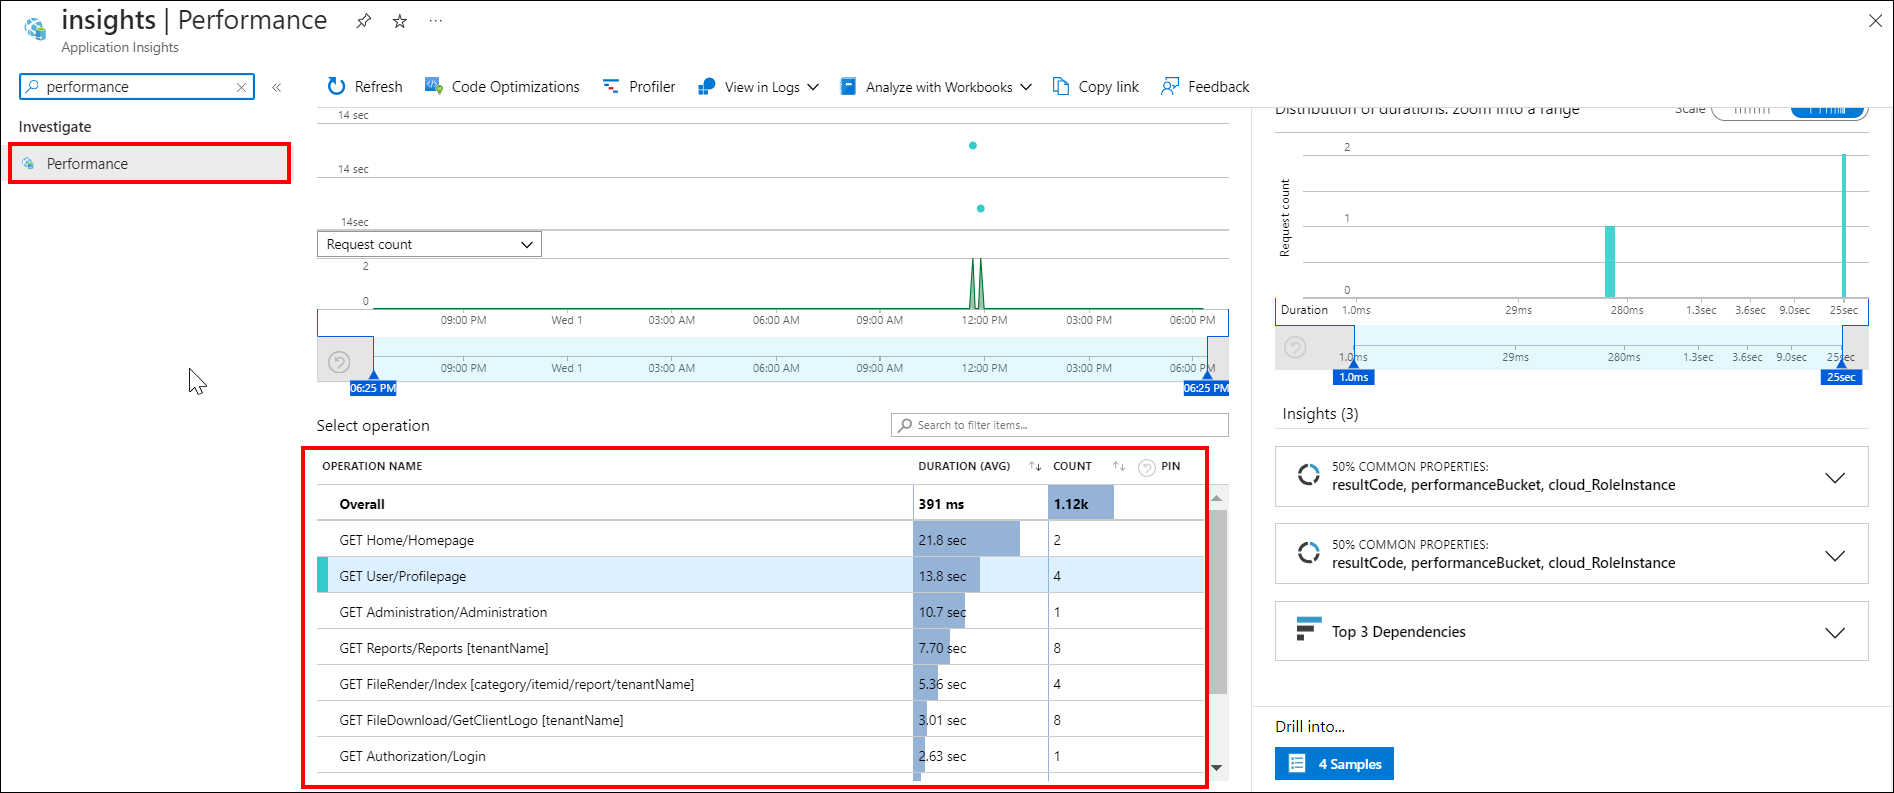
Successful requests are available on the Performance page. From there, you can click on the desired request to view its detailed traces.
Failed Requests
-
Navigate to the
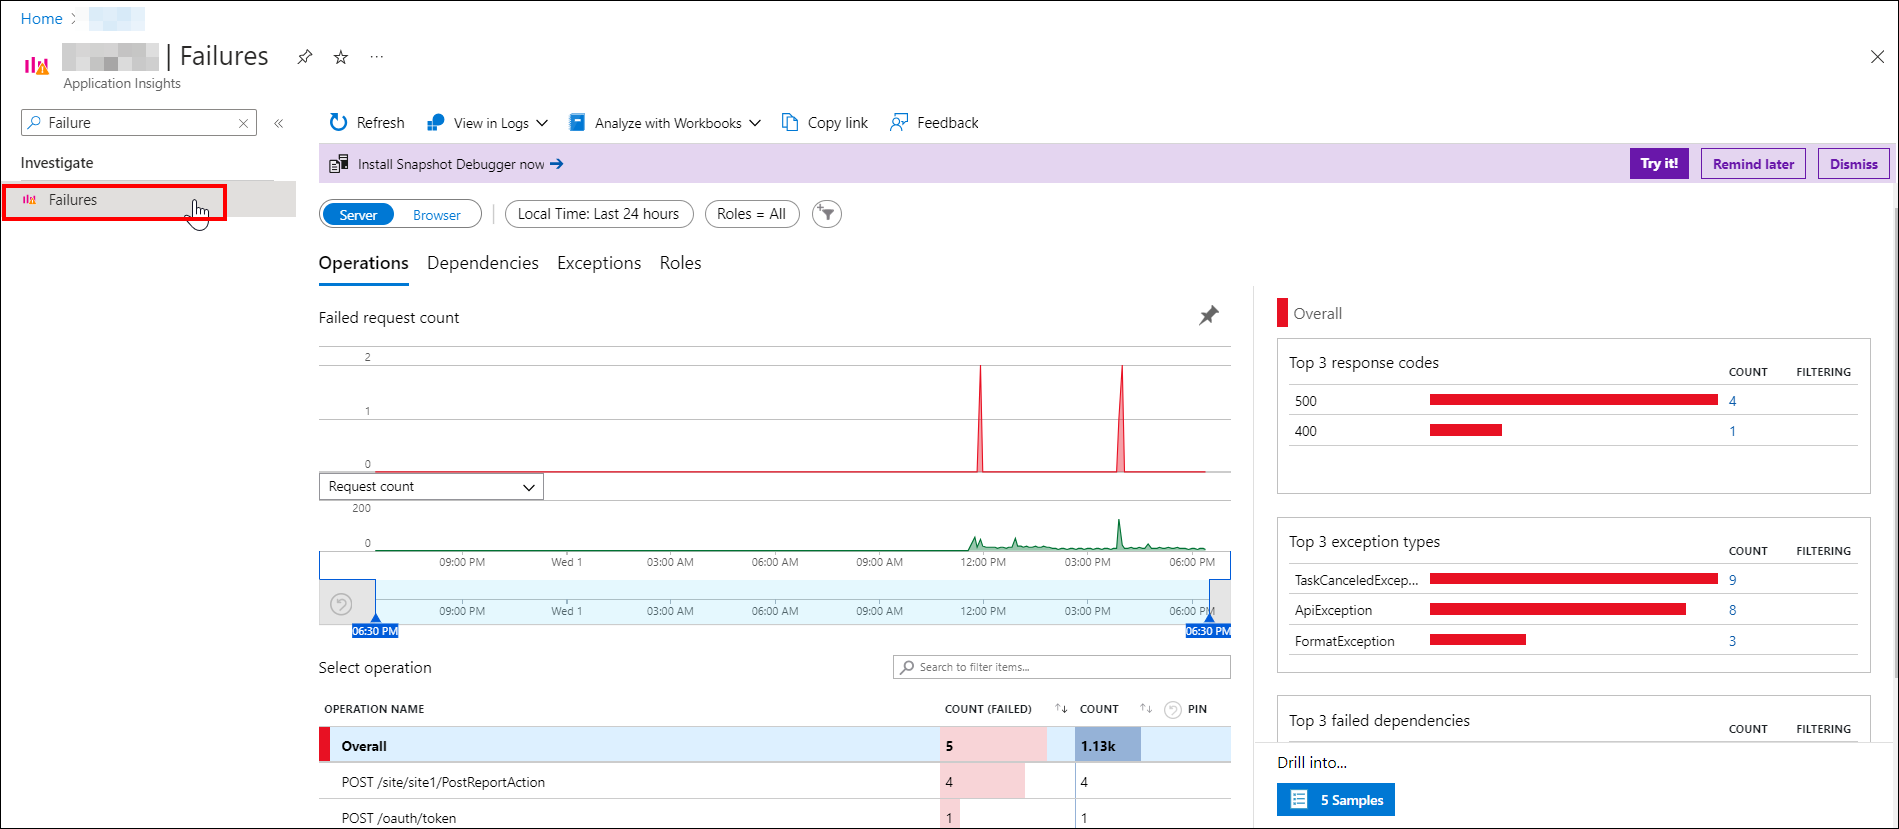
Failuresrequest menu page in Application Insights, where failed requests are available. From there, you can click on the desired request to view its detailed traces.