Image report item in Bold Reports® Web Report Designer
In the Bold Reports® Web Report Designer, the image report item displays images in a report from an external link, data fields, or embedded images. Images can be of the BMP, GIF, JPG, PNG, X-PNG, or SVG type.
How do I add an image to the report?
You add an image to a Bold Reports® report by dragging the image report item from the item panel into the design area.
-
Find the image report item in the item panel under the
Basic Itemscategory.
-
Drag and drop the image report item into the design area from the item panel.

-
Drop the image item into the design area. The properties panel then lists the item properties.

Which properties can I set for an image?
The Bold Reports® image report item has basic settings, link, appearance, size, position, visibility, and miscellaneous properties.
Basic Settings
Basic Settings contains the Source and Value properties. Source includes the Embedded, External, and Database image types.

-
External
The External image source displays a dynamic image in the report. Specify a URL to the image, or set an Expression that evaluates to the URL. To add an external image to a report, enter a valid URL in the value property text field.

-
Embedded
The Embedded option displays the embedded images available in the report. To embed an image in a report, see the Image Manager section.

-
Database
The Database option displays images from image data stored in a database. The
ValueandMIME Typeproperties are listed under theDatabaseoption.-
Value
The value field dropdown lists the available dataset fields in the report. Choose a dataset field bound to a database field that contains an image, or set an Expression that evaluates to the image value.

-
MIME Type
The MIME property specifies the type of image. The MIME property dropdown lists the supported MIME types. Images can be of the BMP, GIF, JPG, PNG, X-PNG, or SVG type. Choose the MIME type that matches your image type.

-
Link
Linking in Bold Reports® creates an interactive report by using the Hyperlink and Report Linking actions. To learn more, see the Linking section. Select the Enable Link checkbox to enable the sub properties.
Appearance
The Appearance properties improve the style of an image layout. The Appearance category lists the border style, color, and width properties.

Border
Border properties add or customize the border around an image report item to visually separate items in the report design. To set border properties for the image report item in the properties panel, see the Border Properties section.
Size
The Sizing property formats the size of the images displayed in the design area. It includes four options to adjust the image display. Choose the size you need in the Sizing dropdown list.
- AutoSize
- Fit
- FitProportional
- Clip

AutoSize
The AutoSize option displays the original size of an image in the design area.
Fit to Size
The Fit option fits the image inside the image report item.
Fit Proportional
The FitProportional option fits the image inside the image report item while maintaining a certain aspect ratio.
Clip
The Clip option displays an image from the top-left corner of the picture in the image report item. If the image is larger than the image report item, only a portion of the image is displayed.
Position
The Position property sets the width, height, left, and top position of the image item in the report design. To set these properties in the properties panel, see the Position section.
Visibility
The Visibility property conditionally shows or hides the image report item on report preview or export. To set the visibility of the image item in the properties panel, see the Visibility section.
Miscellaneous
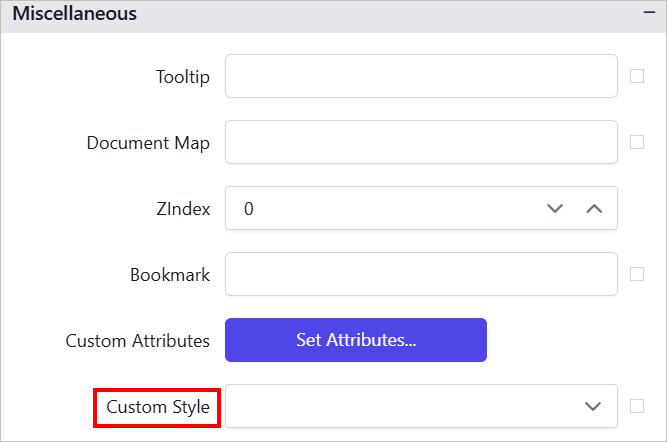
The Miscellaneous category holds the custom attributes, document map, bookmark, tooltip, and custom style properties of the image report item.
Custom attributes
The custom attributes property sets the values of image report item custom properties. To assign values to custom properties in the properties panel, see the Custom Properties section.
Document Map
A document map is a navigational feature that displays a separate side pane with a set of navigational links in a hierarchical structure when you view a report. Users click an entry in the list to navigate to the report page that displays that item. To configure a document map in the report design, see the Document Map section.
You can set static or dynamic text as the value of the document map property. To set and reset dynamic text, see the Set Expression and Reset Expression sections.
Bookmark
Bookmark links let users navigate to different parts of an SSRS report. You can add bookmarks to each textbox, image, table, or chart, or to the unique group values displayed in a tablix, to direct users to specified locations in the report. The bookmark value can be your own string or an expression. To configure a bookmark in the report design, see the Bookmark section.
Tooltip
The Tooltip property displays informative text or a value when the user hovers over the report item in report preview. To set a tooltip for the report item in the properties panel, see the Tooltip section.
Custom Style
The Custom Style property lets you use external CSS to style report items, giving more flexibility than the built-in styling options. Use this property to meet specific design requirements and keep styling consistent across multiple reports. For a step-by-step guide on setting up custom styles in your report, see the How To section of this guide.
Frequently asked questions
Which image formats can I use?
Images can be of the BMP, GIF, JPG, PNG, X-PNG, or SVG type.
Can I load an image from a database field?
Yes. Set the Source to Database, choose a dataset field that contains an image in Value, and choose the matching MIME Type.