Marker color rule
The marker rule properties can be used to define marker styles for each marker on the map surface.
Define marker rule
Marker rule can be applied when you have matched the map shapes based on shape data and analytical data from a data set field or from a spatial data source field.
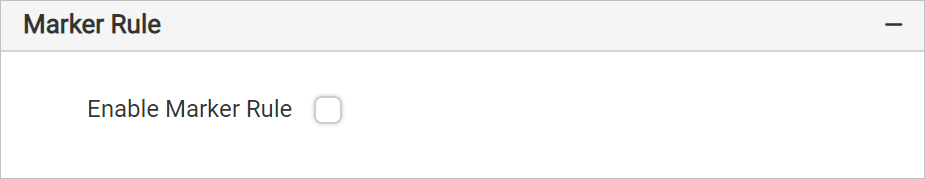
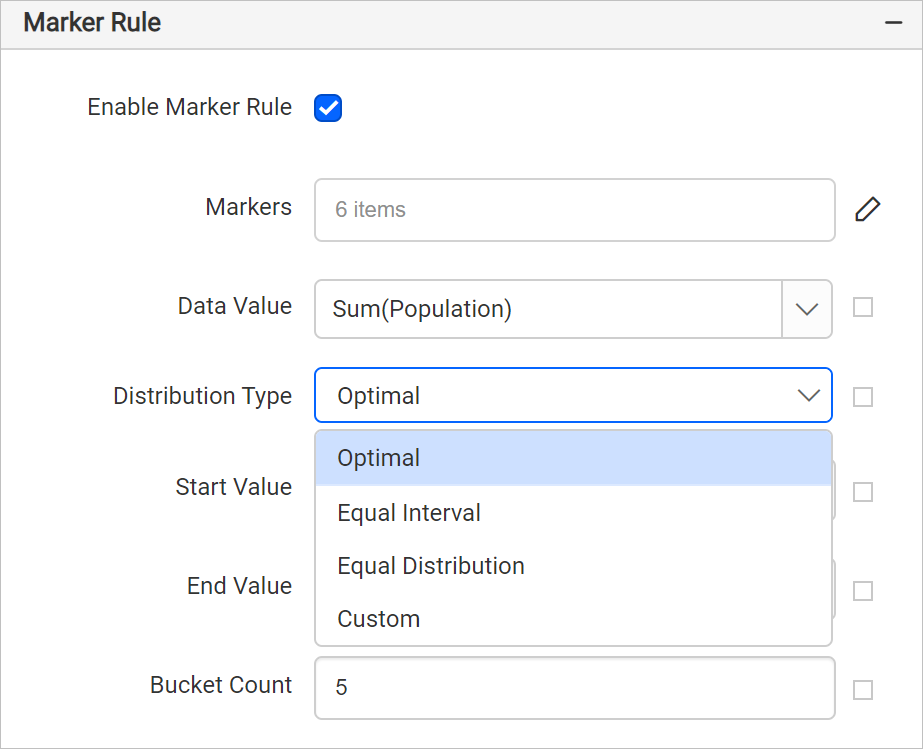
These properties are listed under Marker Rule in the map properties. To enable/disable marker rule in the map surface, toggle the Enable Marker Rule checkbox.
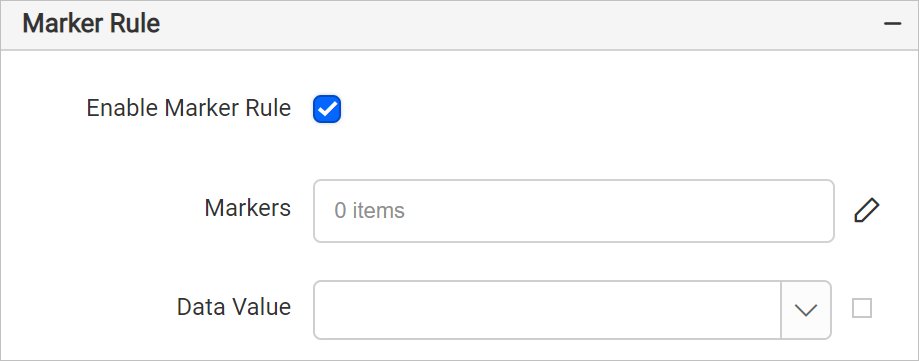
Once you enable the marker rule, other properties required for defining marker styles will start displaying under Marker Rule category.
Markers
This option can be used to define any number of marker style sets based on your desired output. To define marker styles, follow these steps:
- Click on the edit icon for the
Markersproperty.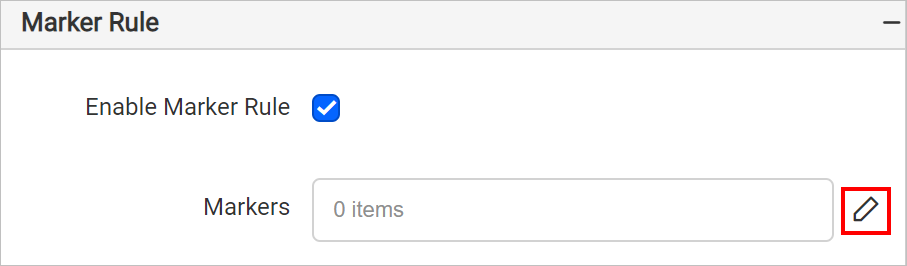
- Now, you will be taken to the Map Marker panel.
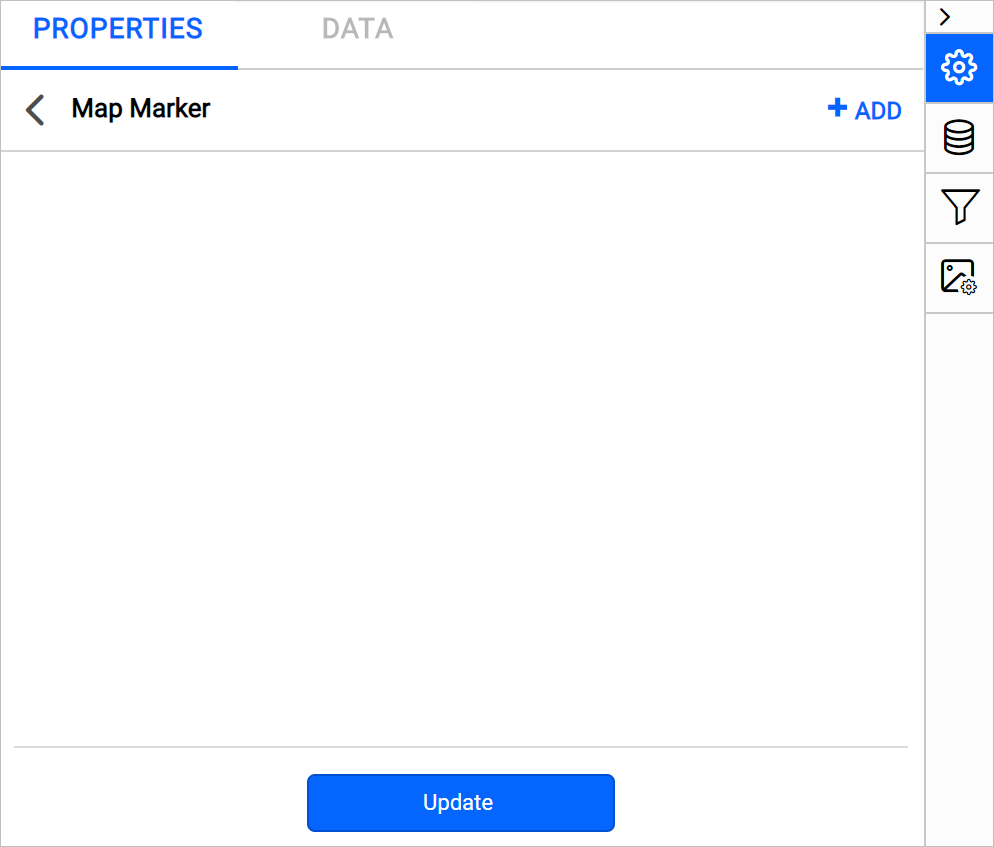
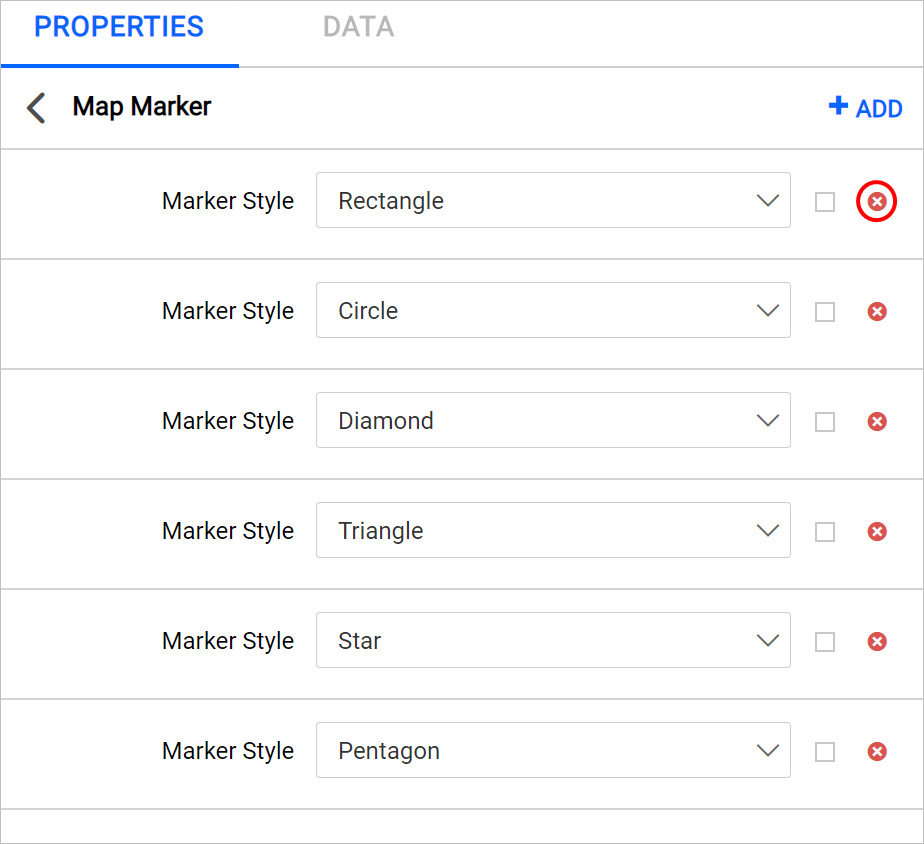
- Click on the ADD icon in the top-right corner. A new field with option to set marker style will be added in the panel.
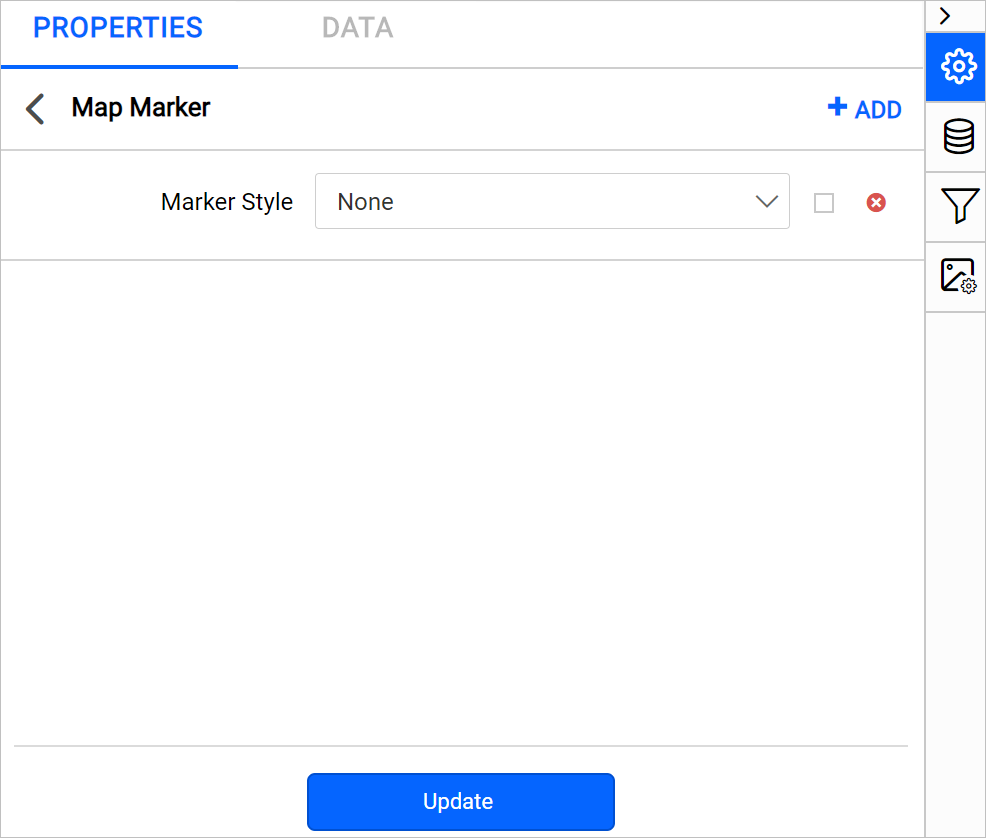
- Set the desired style in the marker style field.
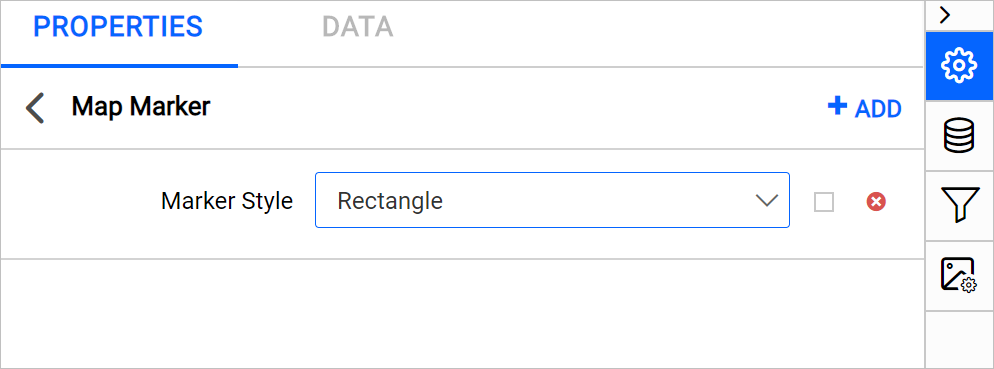
- Click on the Update.
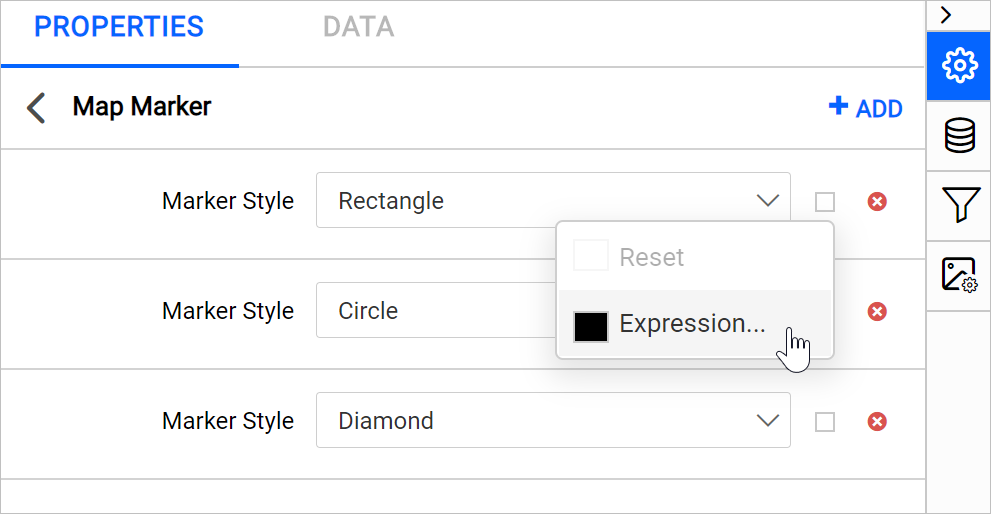
You can also set marker style based on dynamic values, by using the Expressions. Refer Set Expressions and Reset Expressions section to open set/reset expression menu in properties panel. Click on the square icon in the right side of the each field to open expression menu,
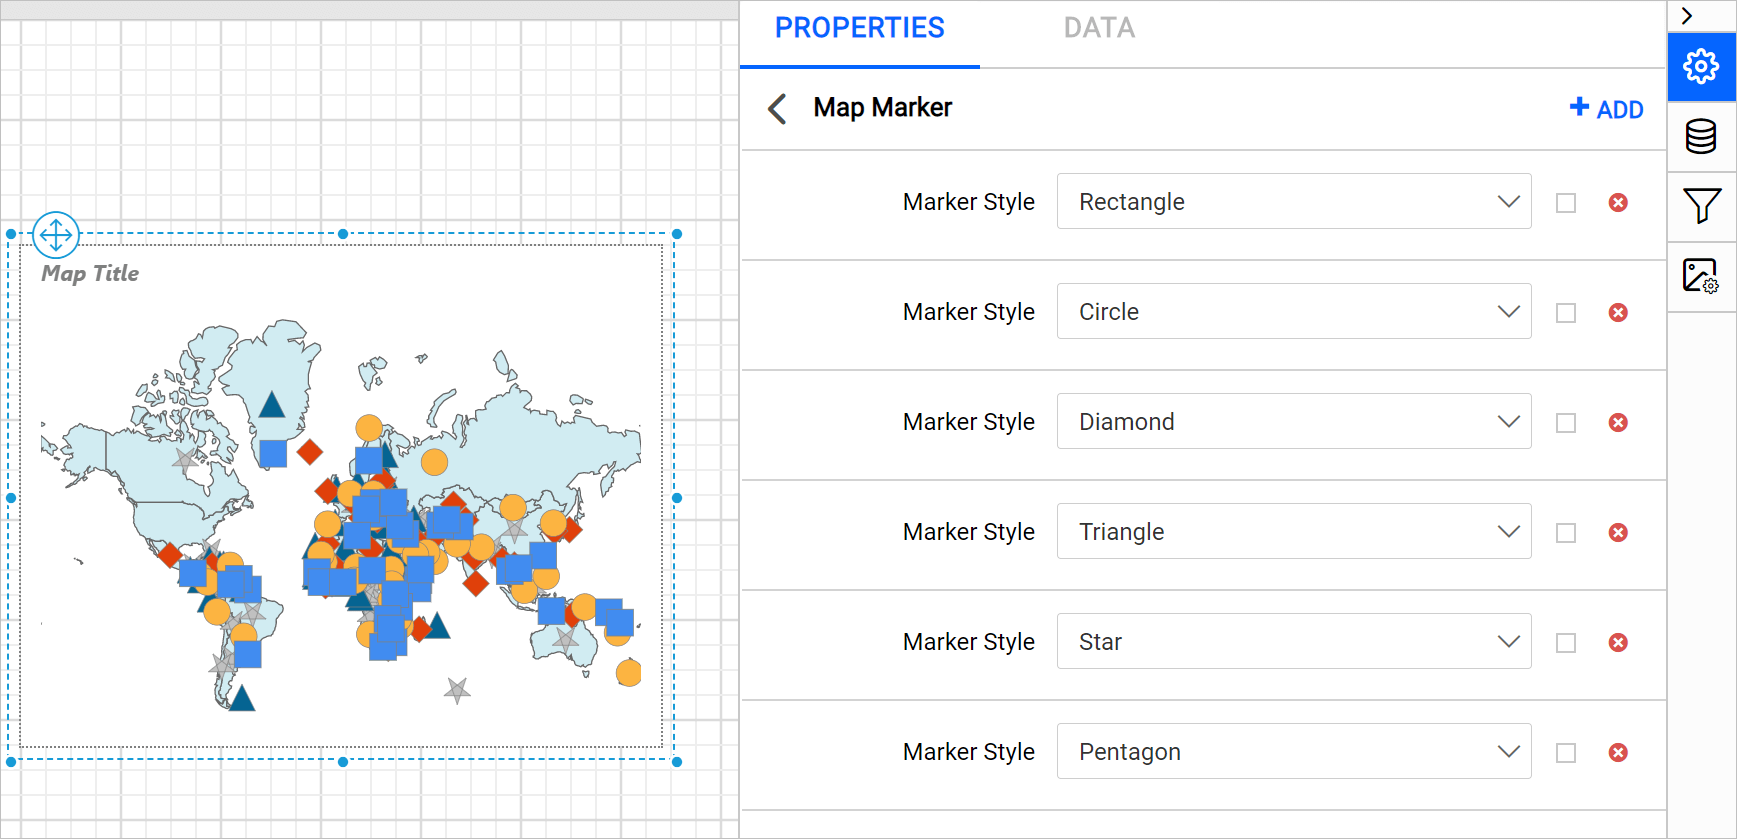
Repeat the above steps to create multiple marker style sets or edit existing style sets. For example, I have added six marker styles in marker style panel and it will be distributed on the map surface based on the distribution type and data range.
Delete style set
To delete the existing style set, click on the edit icon for the Markers property. Now, the available style sets will be listed Map Marker panel. Click on the Delete icon in the right corner of required style set and click on the Update.
Data value
The data value field will list the available shape data fields and analytical data fields depending on the source of shape data and analytical data in the report.
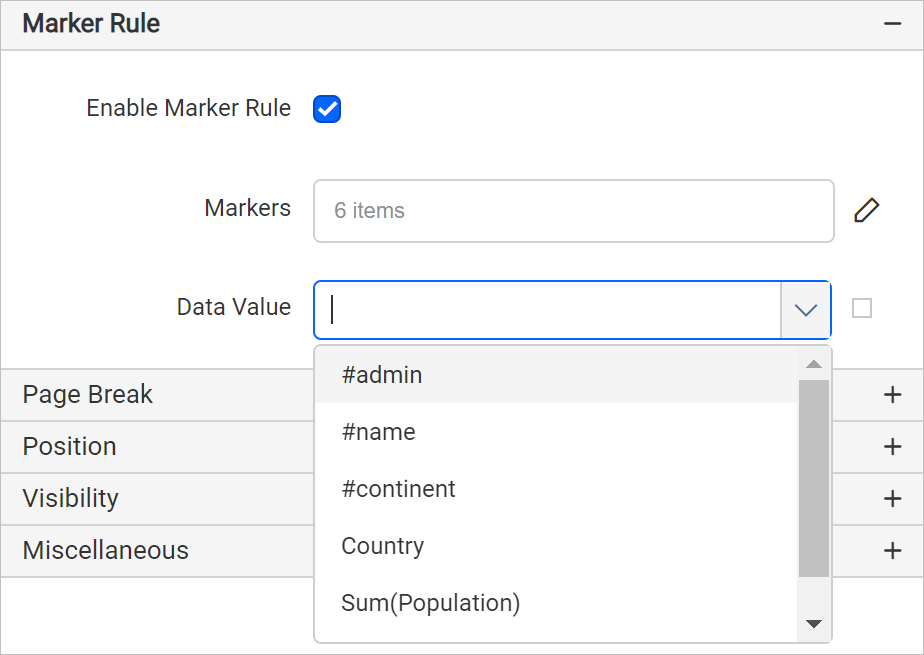
For example, to vary the marker styles based on population of each country, you have to choose sum of population data field as data value. You can also set data value based on dynamic values, by using the Expressions. Refer Set Expressions and Reset Expressions section to open set/reset expression menu in properties panel.
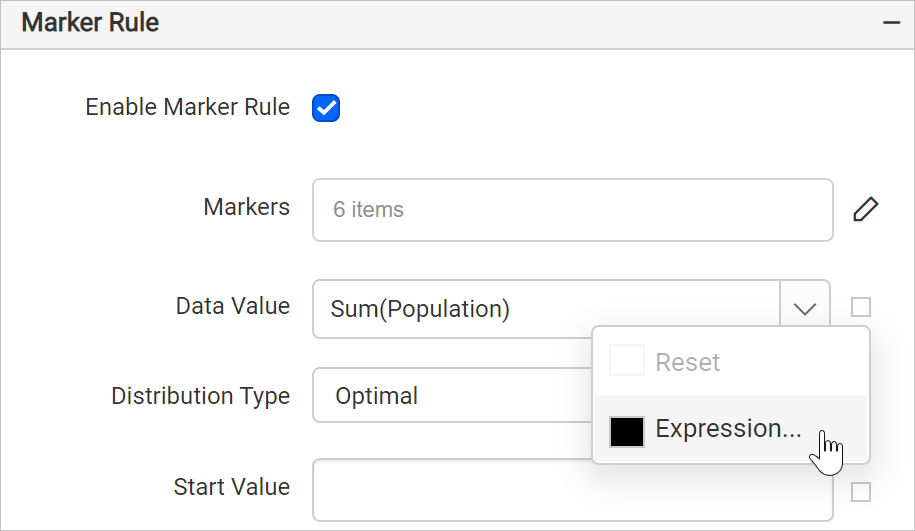
Once you select the data value, the properties required to configure distribution type will start displaying under marker rule category,
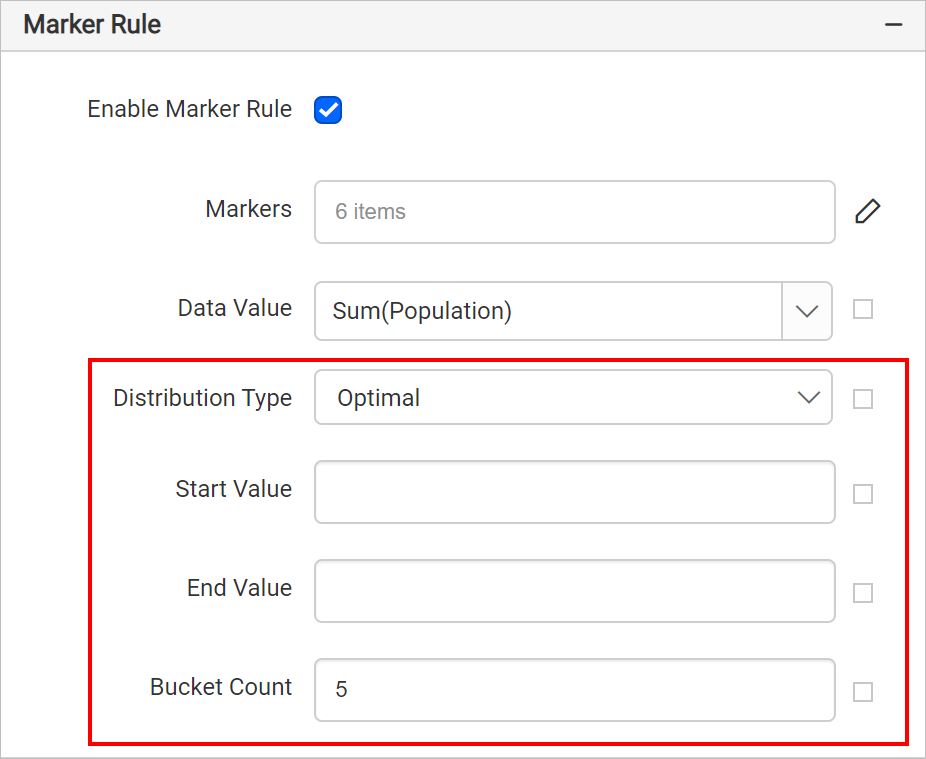
Distribution type
The marker distribution options govern the way markers are visualized on the map surface. There are four types of distribution rules: Optimal, Equal Interval, Equal Distribution, and Custom. These options are listed in the Distribution Type drop-down,
On report preview, based on the selected distribution type the analytical data will be split into ranges and the specified color rules will be applied to the map markers.
- Optimal - adjusts the size of data intervals so as to limit the grouping blunder and in this manner the map looks increasingly adjusted and the outcomes appear to be progressively right, with only a couple of marker styles in the highest class as one would anticipate.
- Equal Interval - it divides the entire data range into equally sized intervals.
- Equal Distribution - this type creates unequally sized data intervals and involves adjustment of the interval limits so that each range has an equal number of items.
- Custom - Indicate your own number of data ranges to decide the distribution of values.
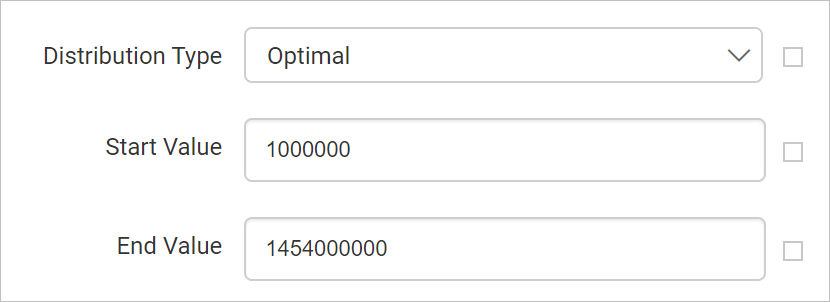
Start and End Value - Based on start and end values the ranges will be split using an algorithm in report preview.
For example, to display population of each country on a map, you can set minimum population as start value and maximum population as end value.
Bucket count - Based on specified bucket count, splits the data ranges. For example, if you specify bucket count as 25, the data between start and end values will be split into 25 ranges.
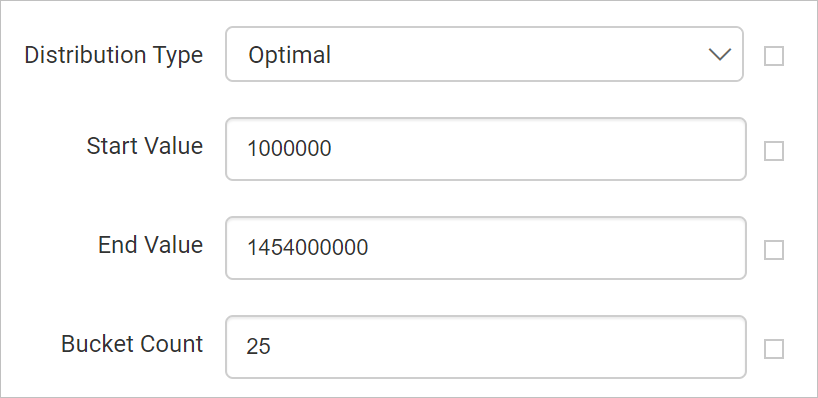
You can also set bucket based on dynamic values, by using the Expressions. Refer Set Expressions and Reset Expressions section to open set/reset expression menu in properties panel.
For optimal, equal interval and equal distribution the data ranges are split using algorithm when processing the report. You can also define the data ranges explicitly using the Custom distribution type. Refer Custom distribution section.
You can also apply distribution type based on dynamic values, by using the Expressions. Refer Set Expressions and Reset Expressions section to open set/reset expression menu in properties panel.