Custom Distribution
Indicate your own number of data ranges to decide the distribution of values.
Once you select the data value, the properties required to configure distribution type will start displaying under marker color rule category,
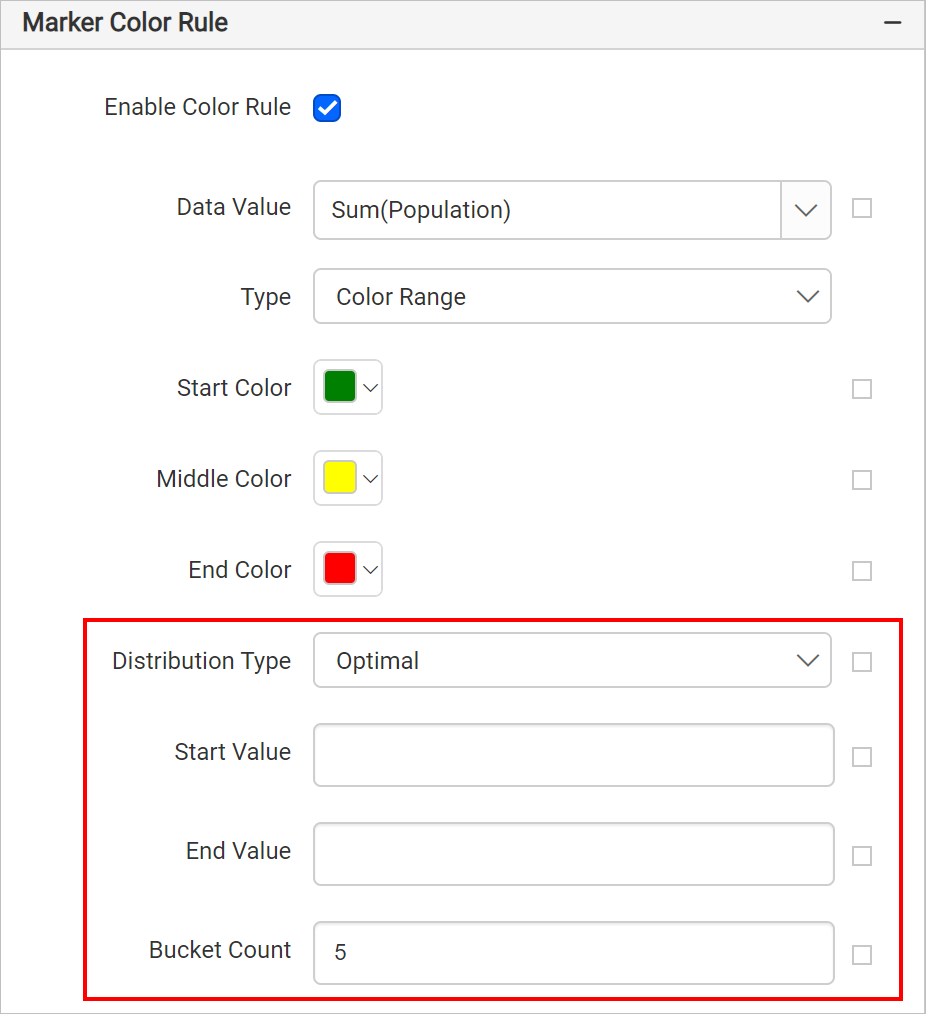
Choose Custom in Distribution Type dropdown.
Now an option called Buckets will start displaying, click on the edit icon.
![]()
Now, you will be taken to the Map Bucket panel.
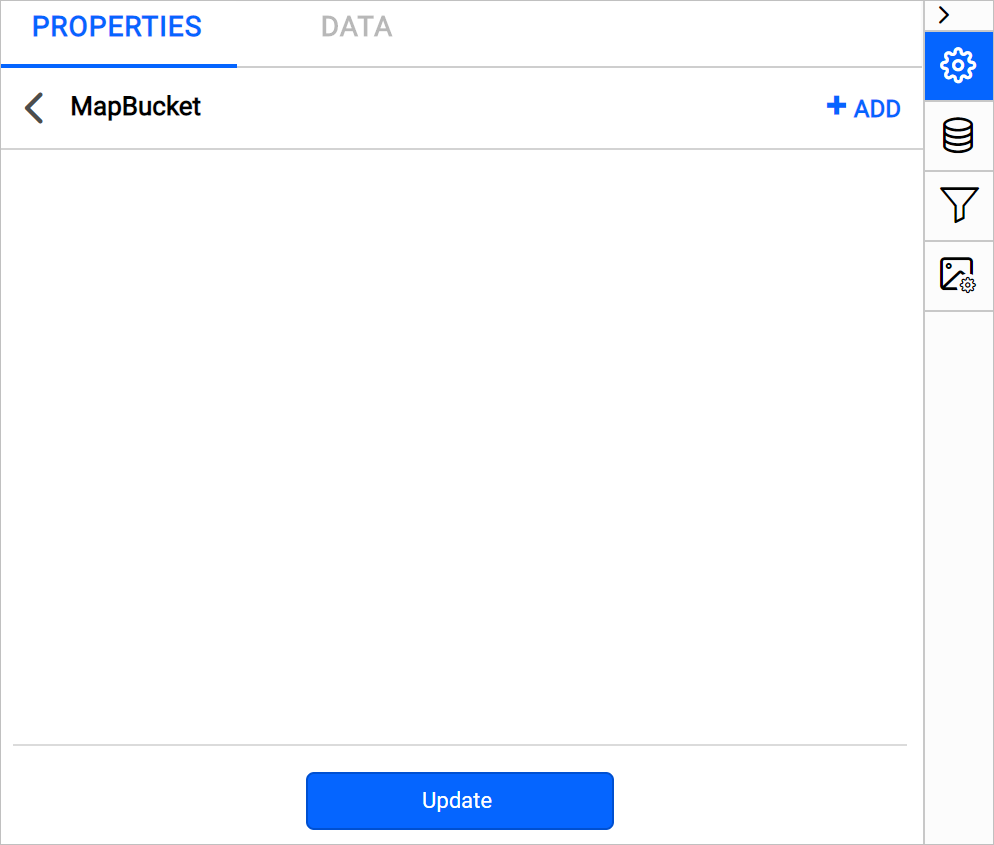
Buckets
To define the data ranges explicitly in the Buckets property, refer Custom Buckets section.
On report preview, based on specified data ranges, fill color will be applied on marker icons in the map surface.