Design a map using a marker rule in Bold Reports®
You can design a map in the Bold Reports® Web Report Designer with a marker rule and color rule. The example map displays the mineral resources production plants of a company in the USA.
How do I create the data set?
You create the data set for the map in the Bold Reports® Web Report Designer from a JSON file. Follow these steps:
- In the data panel, click
New Data.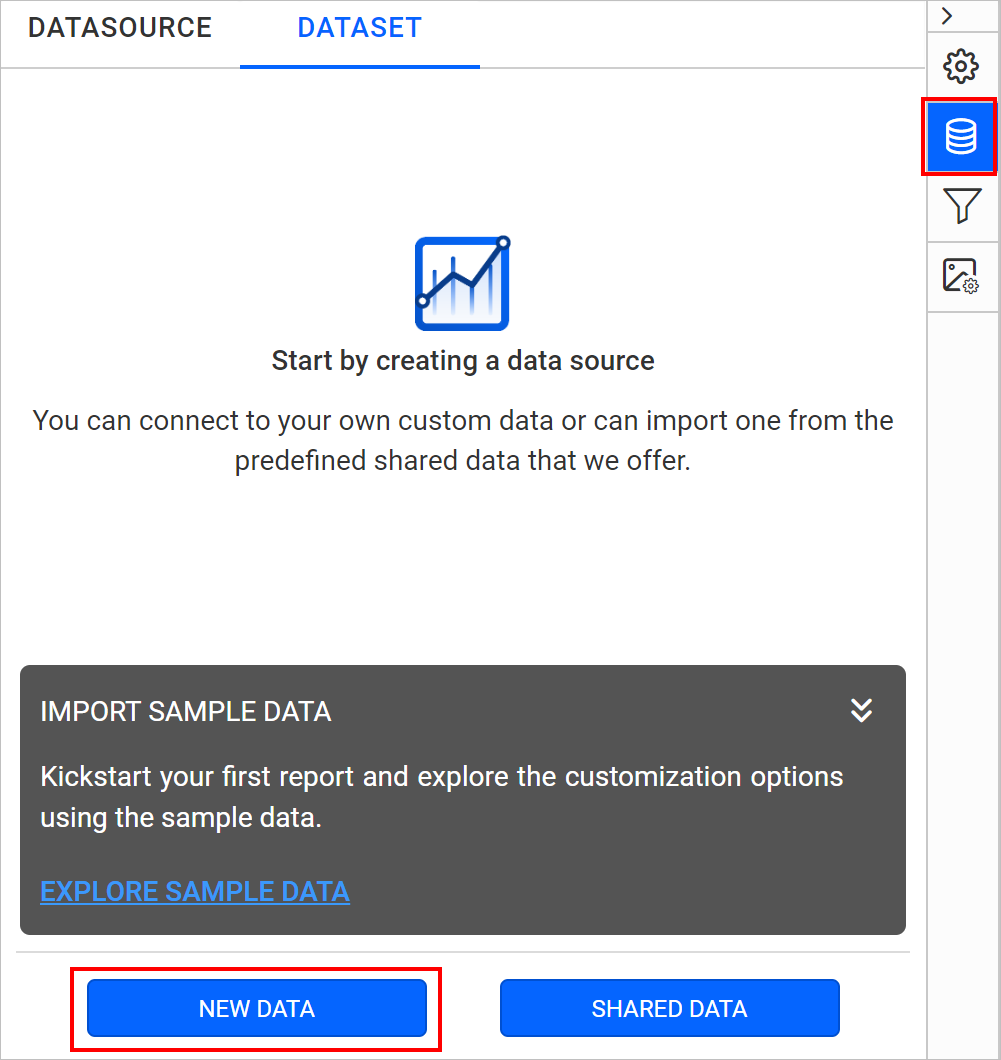
- Choose the
JSONconnection type.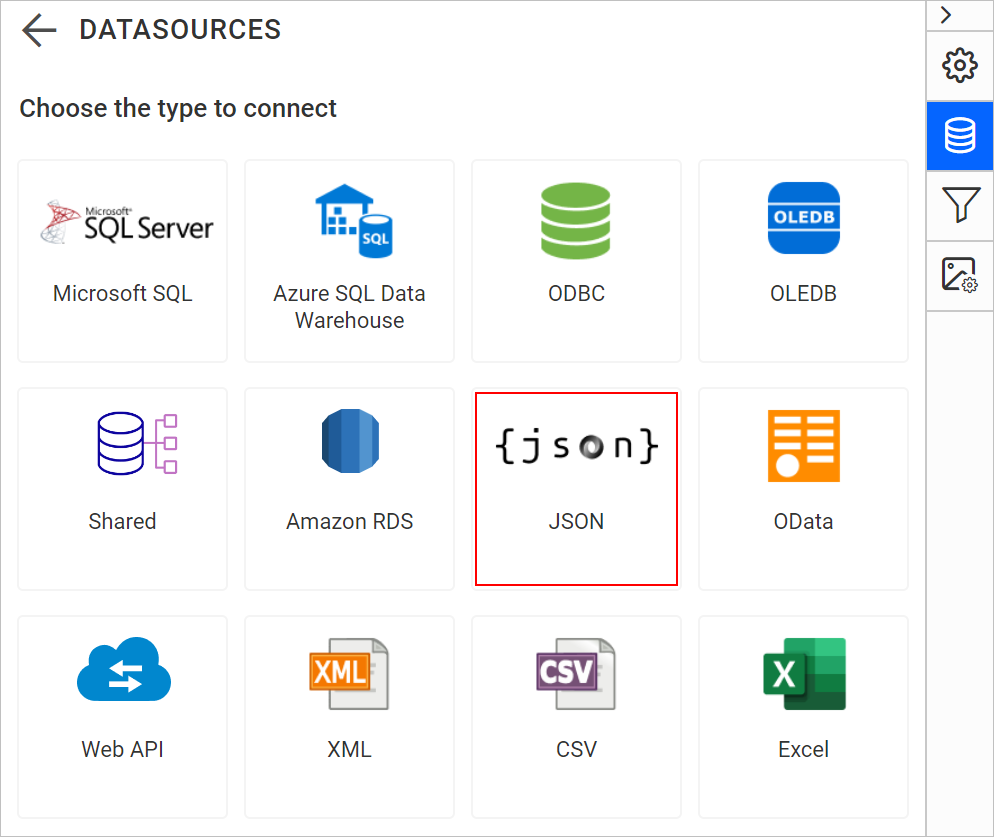
- Choose
FileasType.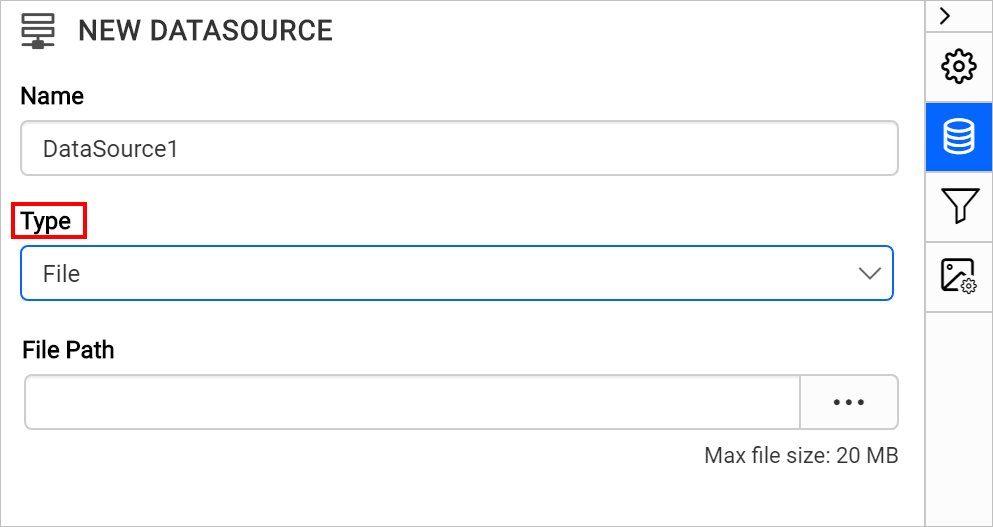
- Click the upload button, then browse and upload the JSON file in the
File Pathfield.
- Click the
Connectbutton. - In the query builder, the available fields in the JSON file are loaded under the default table name,
Result.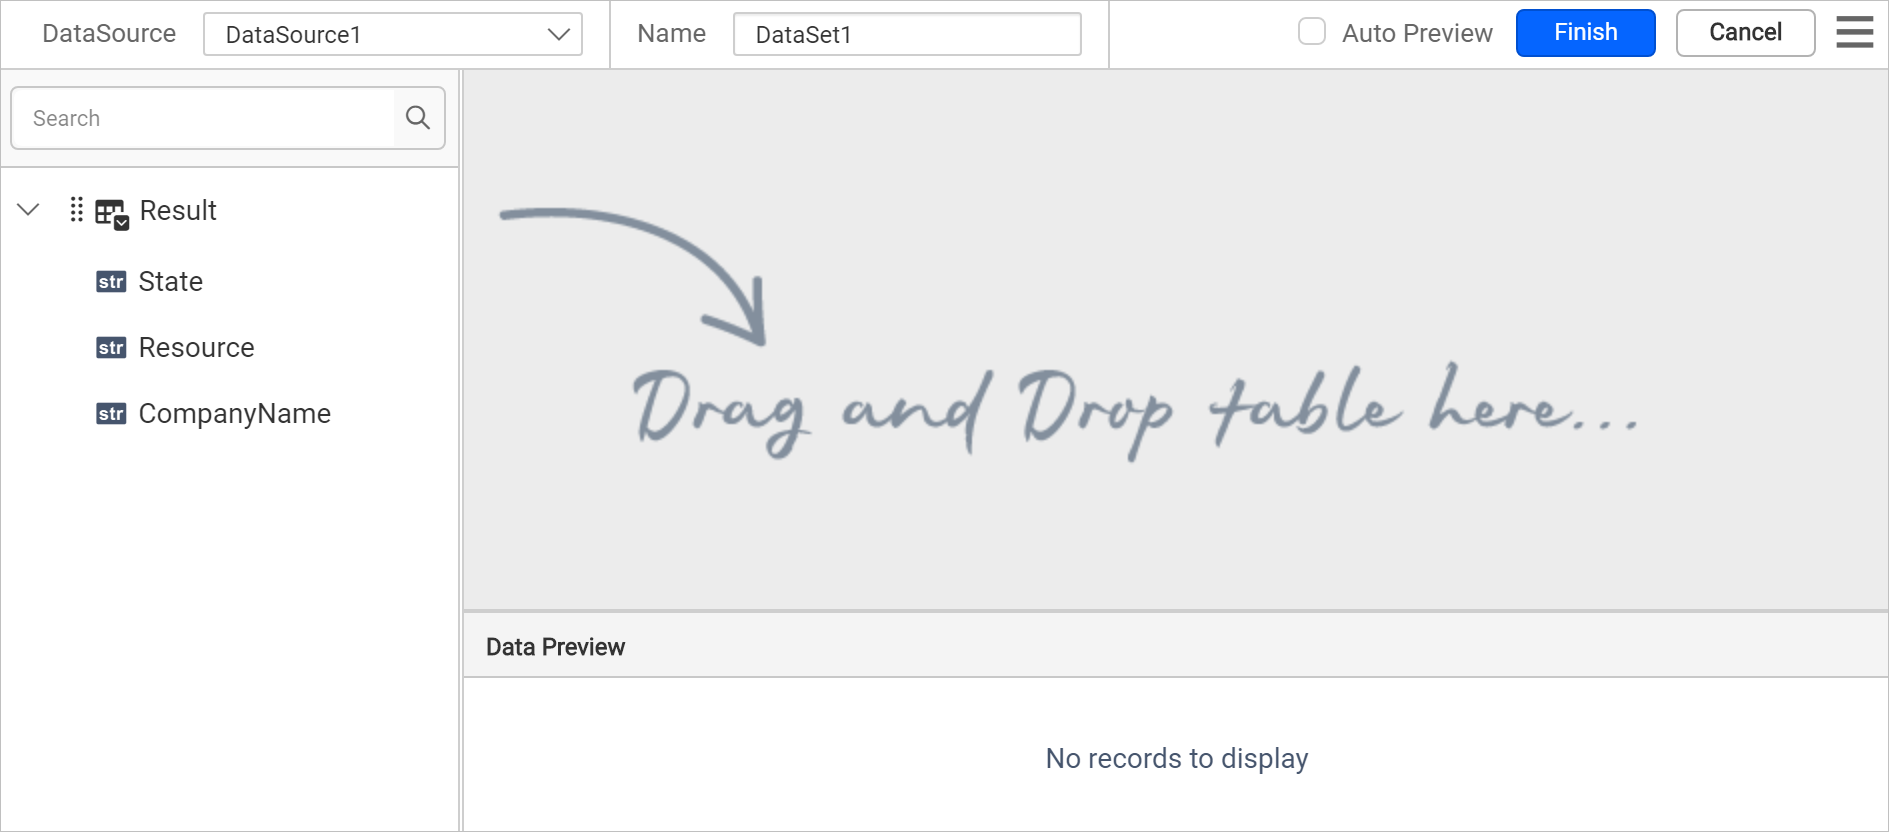
- Drag and drop the
Resulttable and execute.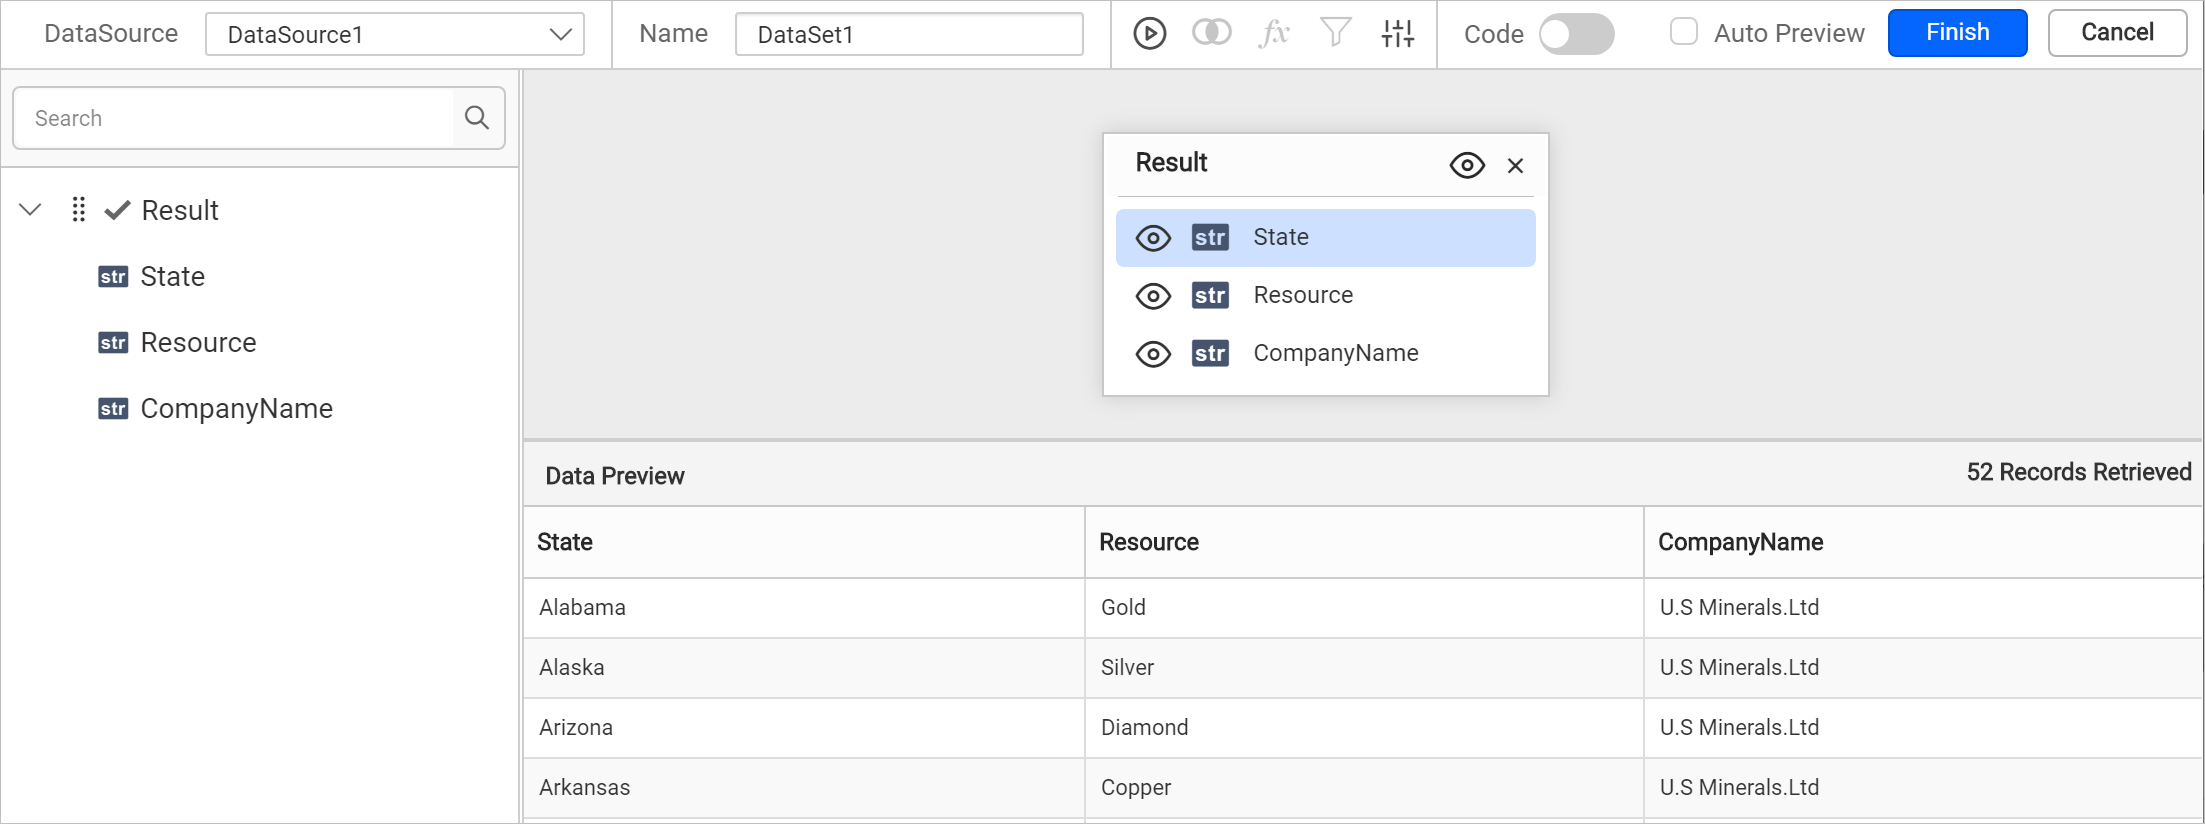
- Modify the data set
Nameand click Finish.
Note: This data is created for demonstration purposes. Download the mineral resources sample JSON file.
How do I add a map to the report design?
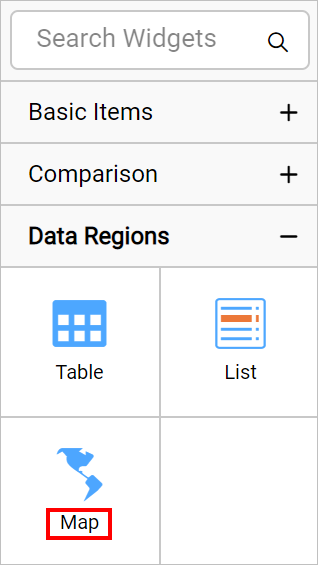
The Map report item in the Bold Reports® Web Report Designer is listed under the Data Regions category in the item panel.
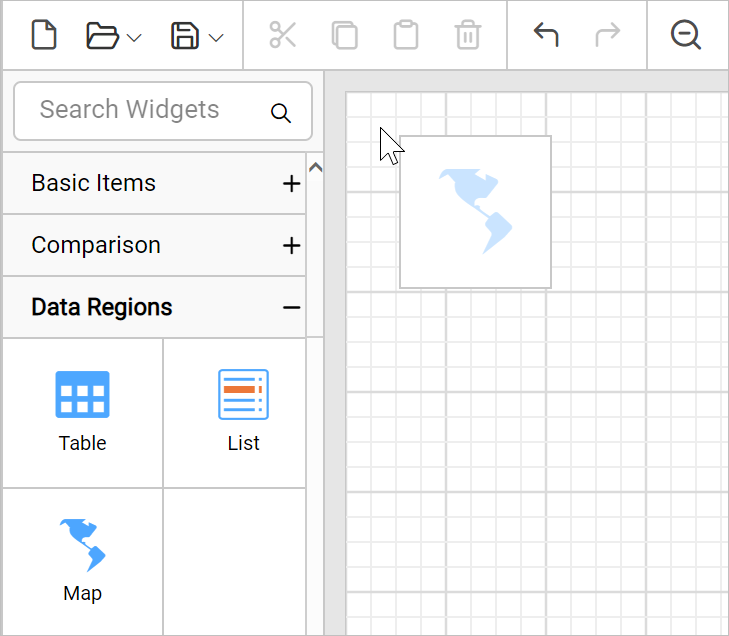
To add a Map report item to the report, drag the map from the item panel into the design area.
The map item is rendered in the design area, and the map properties are listed in the properties panel.
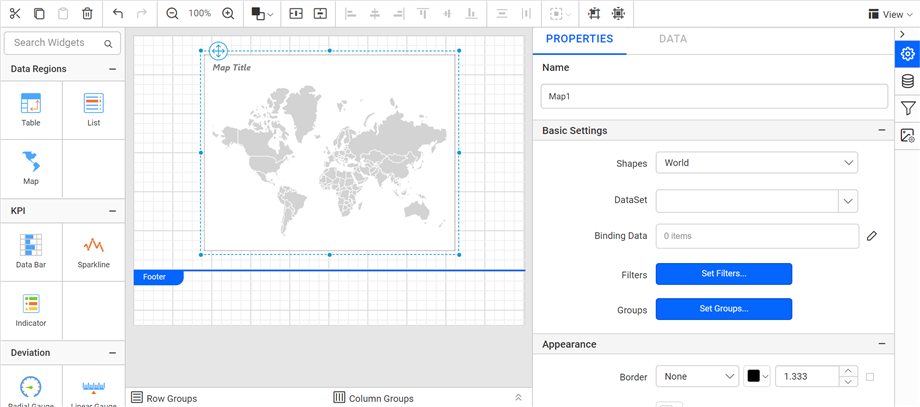
By default, map report item renders with world map shapes.
How do I bind analytical and shape data?
You bind analytical and shape data in the Bold Reports® Web Report Designer from the Basic Settings category of the properties panel. Follow these steps:
-
Under the Basic Settings category, set
USAin theShapesproperty and choose the data set in the DataSet property.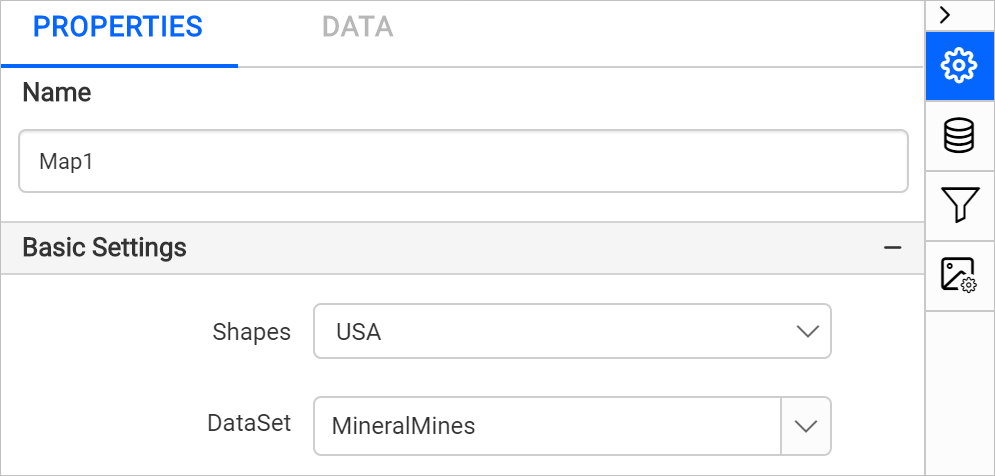
-
Click the edit icon for the Binding Data property under Basic Settings.
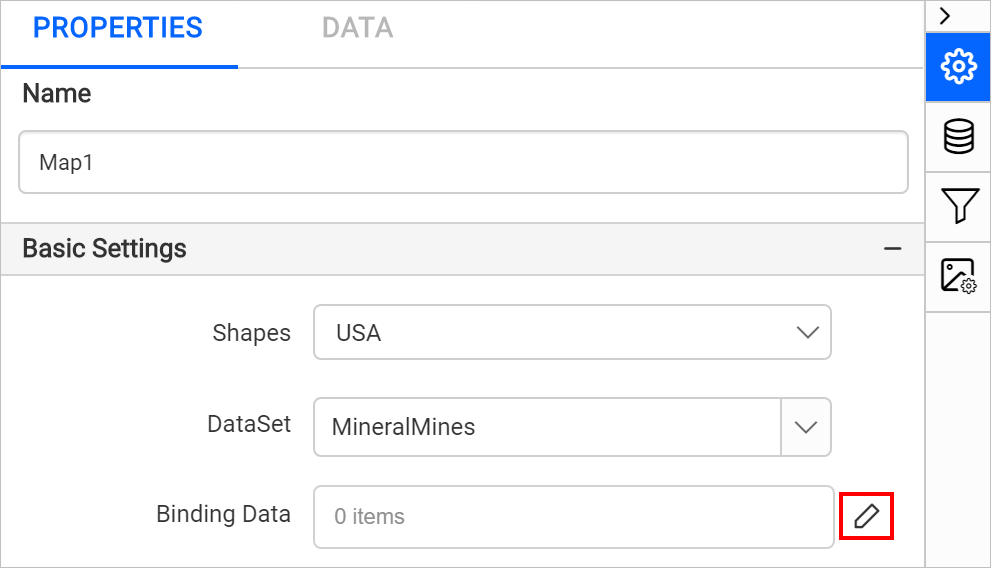
-
Match the analytical and shape data as described in Binding Data. Choose name in the Field Name drop-down and choose the =Fields!Country.Value expression in Binding Expression.
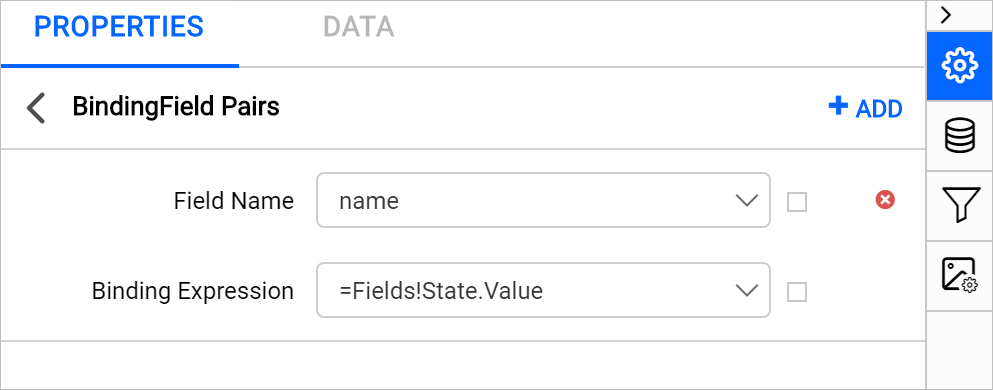
-
Click Update.
How do I customize the map appearance?
You customize the map title, color settings, and other properties in the Bold Reports® Web Report Designer properties panel.
Appearance
Under the Appearance category in the Bold Reports® Web Report Designer, set the border width and color properties as required.
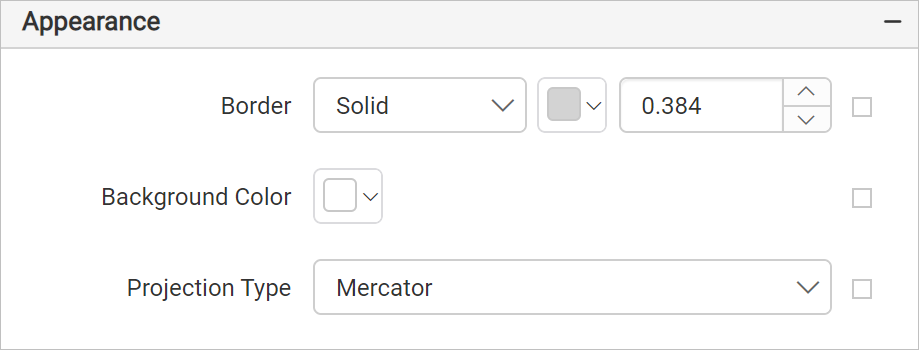
Title
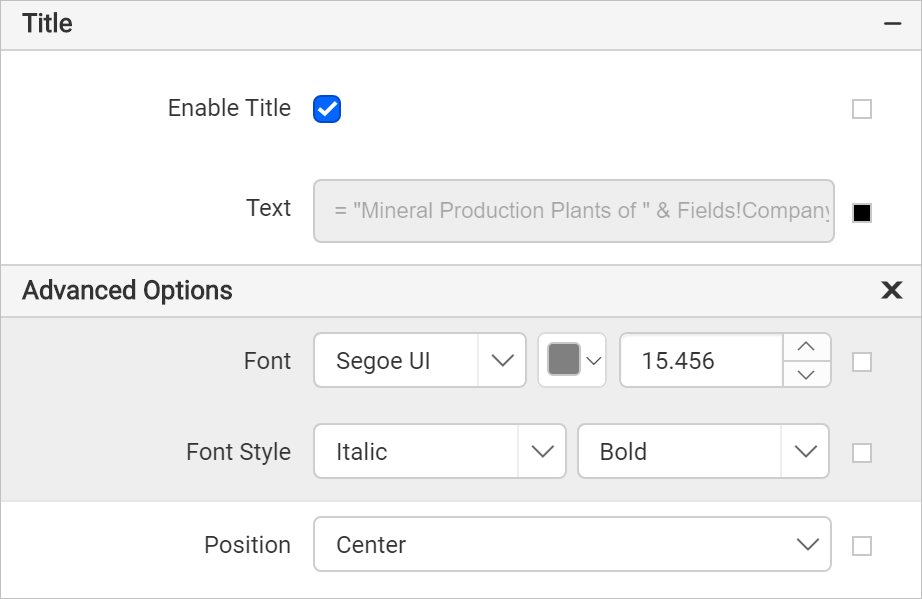
Under the Title category in the Bold Reports® Web Report Designer, set the title text, position, and font properties for the map title. First, enable the Enable Title check box. Then, set the title as = "Mineral Production Plants of " & Fields!CompanyName.Value and the position as center.
Shape settings
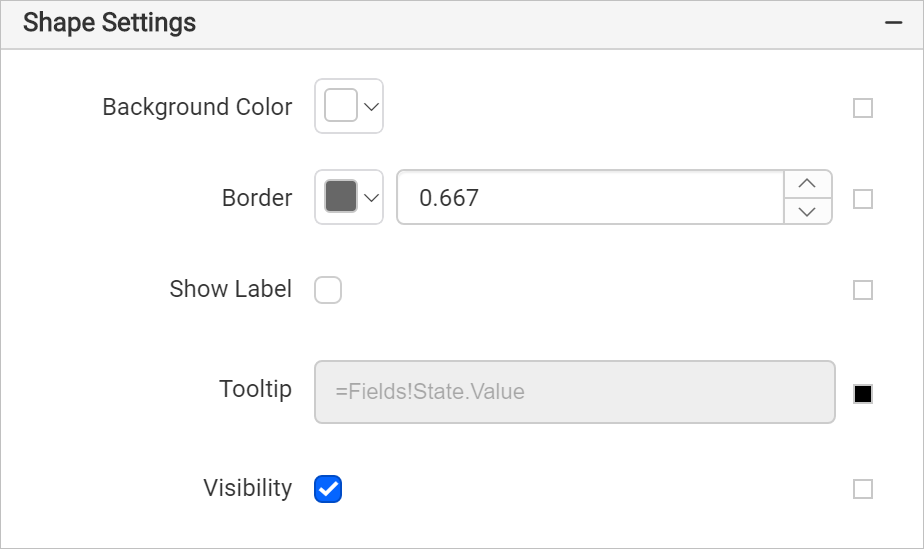
Under the Shape Settings in the Bold Reports® Web Report Designer, set the following values:
- Background color as
#ffffff. - Border color as
#676767and width as0.672px. - Tooltip as
=Fields!State.Value.
How do I define the marker rule?
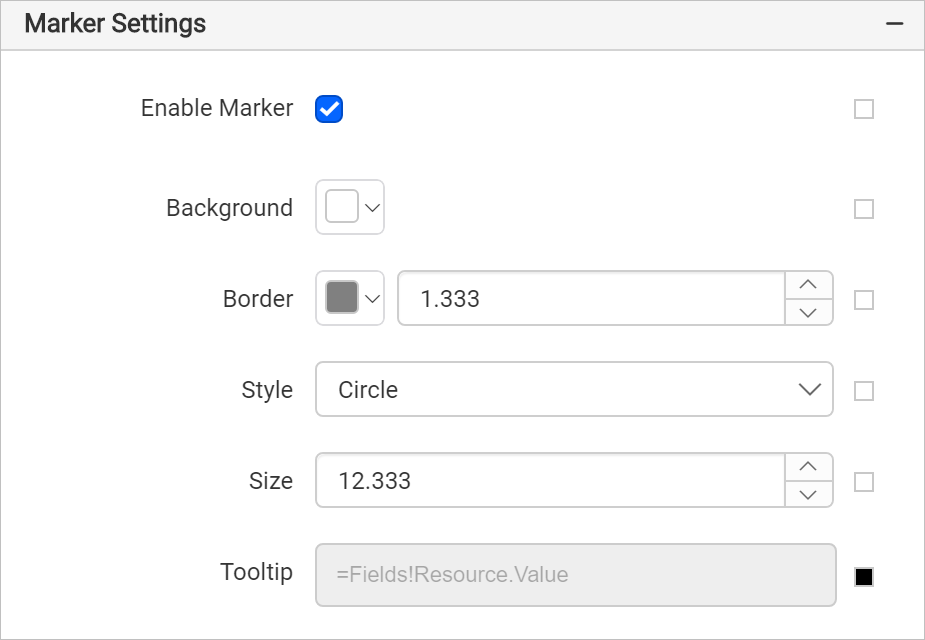
You define the marker rule in the Bold Reports® Web Report Designer after you enable the markers. Under the Marker Settings category, enable the Enable Marker checkbox. Set the marker size as 12.333 and the tooltip as the =Fields!Resource.Value expression, and leave the other values at their defaults.
Marker rule
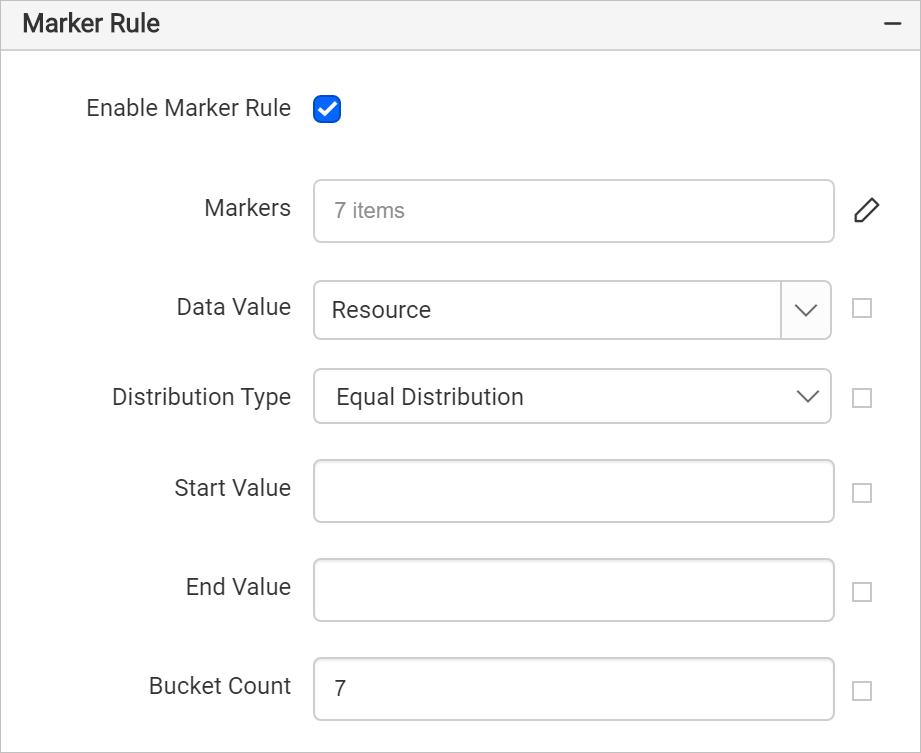
Under the Marker rule category in the Bold Reports® Web Report Designer, enable the Enable Marker Rule check box. Then, set the following values:
- Choose the
Resourcefield in Data Value. - Define custom marker styles as described in Marker property. Here, seven styles in total are defined to show the data on the map surface.

- Set Bucket Count as seven.
The marker rule configuration looks like the following image.
Marker color rule
The marker color rule in the Bold Reports® Web Report Designer differentiates items that share the same marker style. The marker style configuration above defines seven marker styles, and Diamond is defined more than once. So, in preview, two items denote the Diamond shape. To differentiate these items, apply a marker color rule.
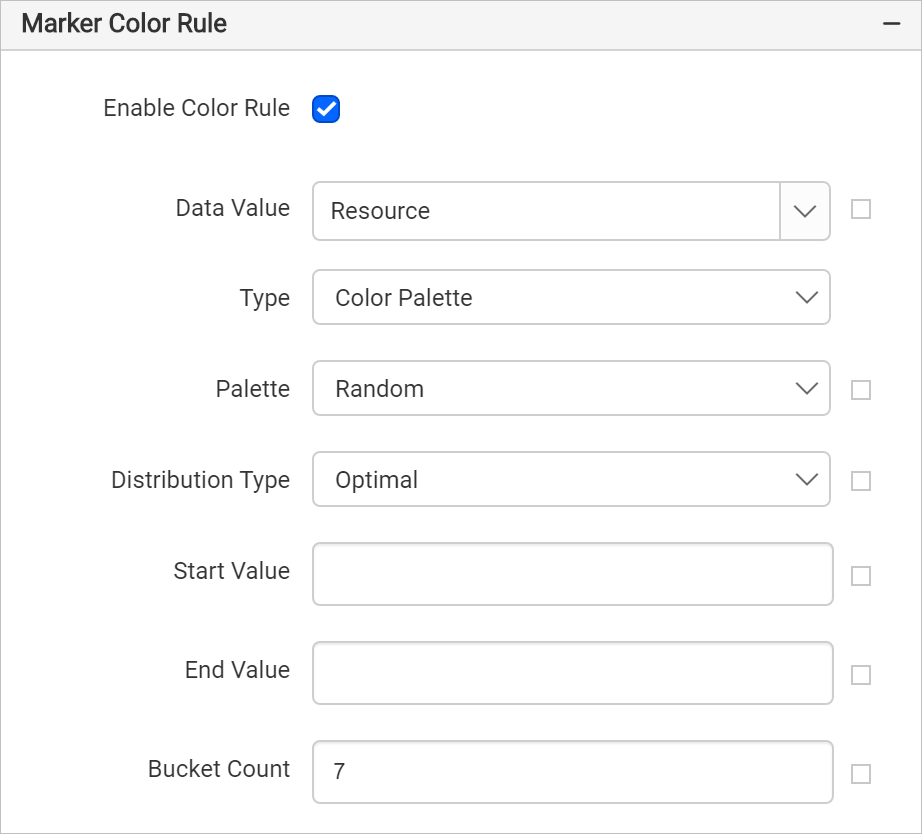
Under the Marker color rule category, enable the Enable Color Rule check box. Then, set the following values:
- Choose
Resourcein Data Value. - Choose
TypeasColor Palette. - Choose
PaletteasRandom. - Choose Optimal for Distribution type.
- Set Bucket Count as seven.
The marker color rule configuration looks like the following image.
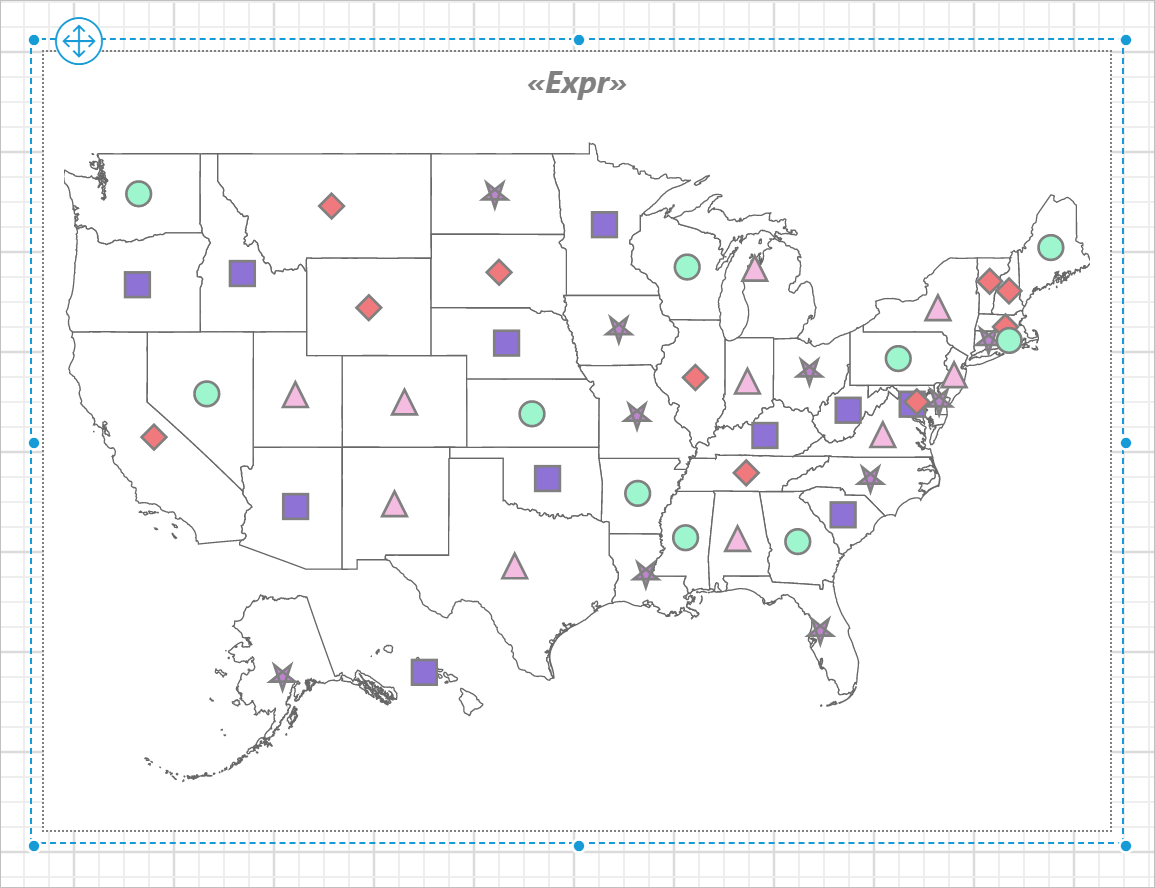
The markers are now applied to the map shapes, but with sample data.
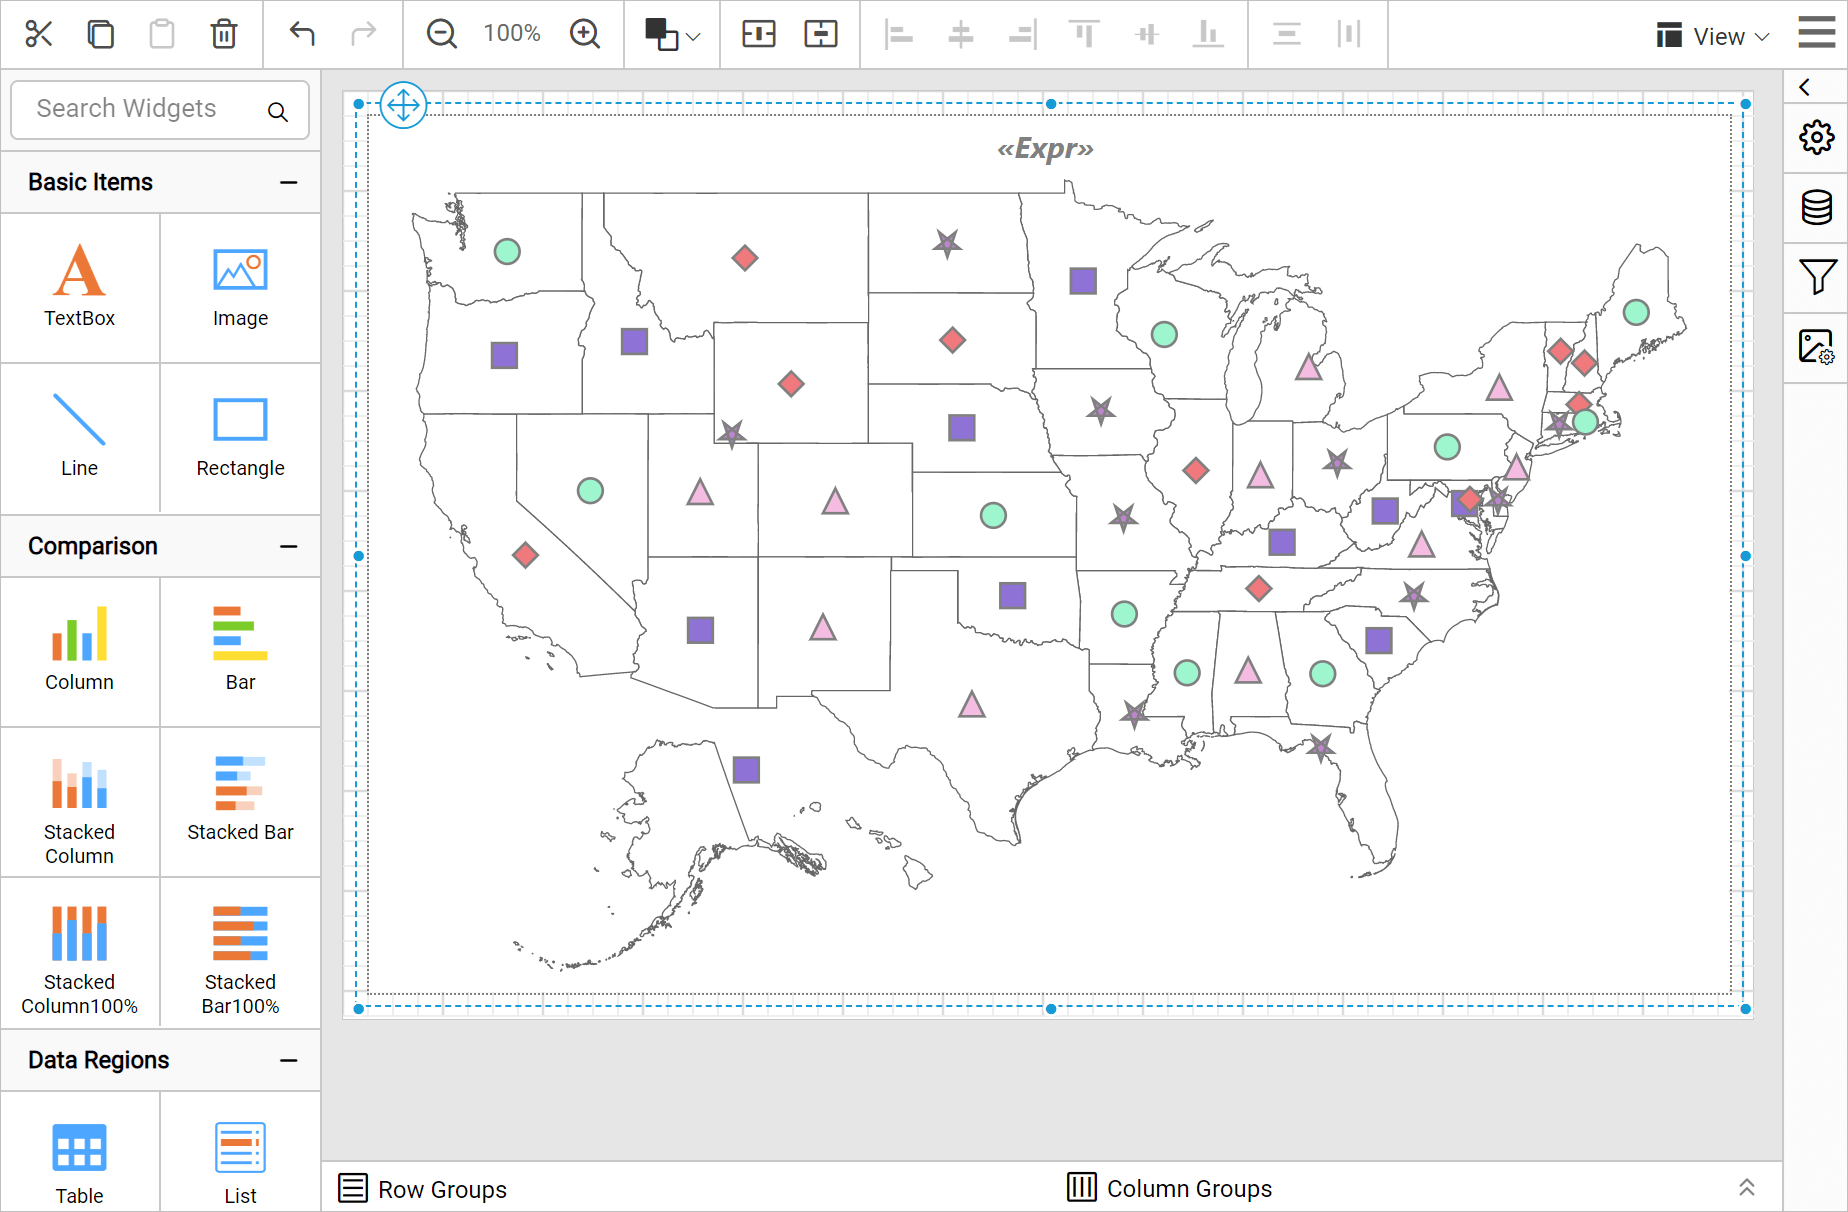
To see the actual data on the map surface, preview the report. Before that, resize the width and height of the map so you can view the information clearly in preview.
Preview report
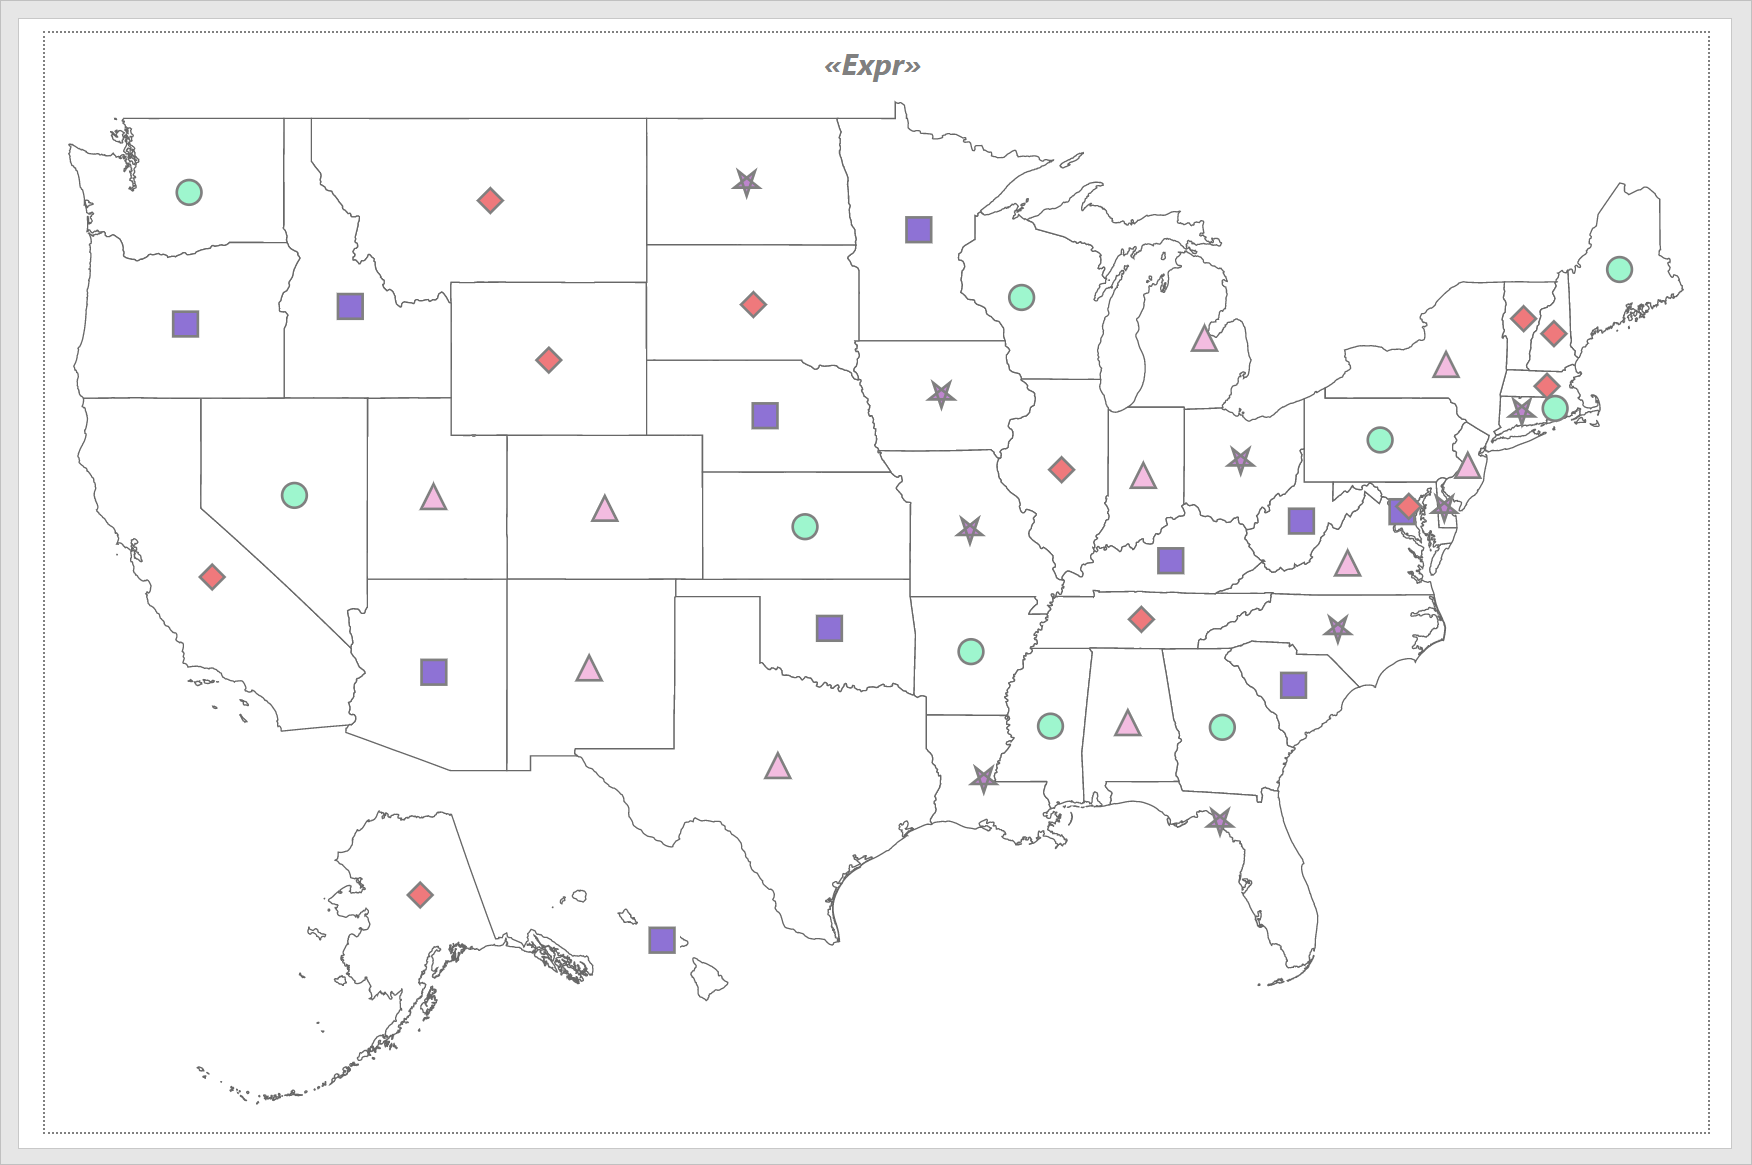
You can preview the report at design time using the built-in Bold Reports® Viewer to make sure the report design is as expected. In preview mode, you can see the different mineral resources production plants located in states of the USA. The following snapshot shows the marker style distributed based on the type of mineral resource plant.
Download the marker rule map report design (RDL).