Equal interval for map markers in Bold Reports®
In the Bold Reports® Web Report Designer, the equal interval distribution type divides the entire data range into equally sized intervals.
How do I set equal interval distribution for map markers?
You set equal interval distribution for map markers in the Bold Reports® Web Report Designer from the marker color rule category.
-
Set a value for the
Data Valueproperty. The properties required to configure the distribution type appear under the marker color rule category.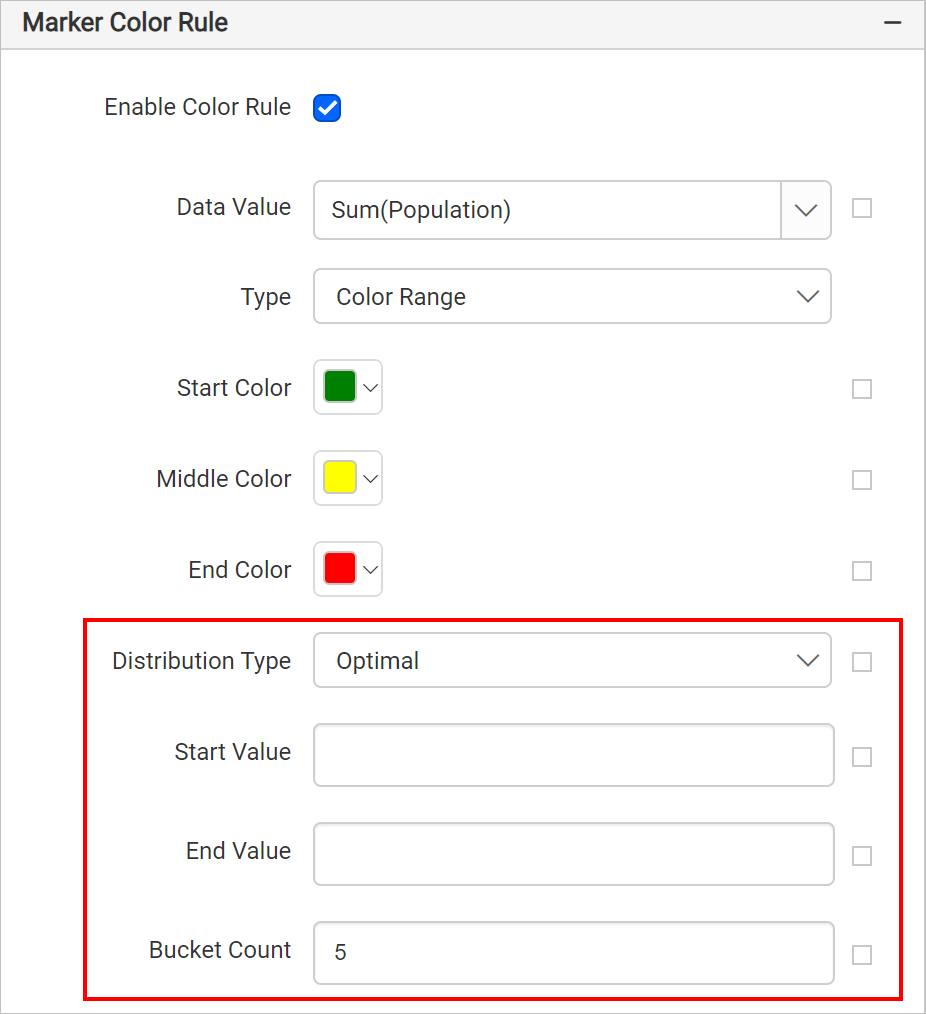
-
Choose
Equal Intervalin theDistribution Typedropdown.
You can also set the distribution type based on dynamic values by using Expressions. To open the set or reset expression menu in the properties panel, see the Set Expressions and Reset Expressions sections.
Start and end value
The start and end values set the limits that Bold Reports® splits into ranges by using an algorithm in report preview.
For example, to display the population of each country on a map, set the minimum population as the start value and the maximum population as the end value.

Bucket count
The bucket count sets how many data ranges Bold Reports® creates. For example, if you specify a bucket count of 25, the data between the start and end values is split into 25 ranges.

You can also set the bucket count based on dynamic values by using Expressions. To open the set or reset expression menu in the properties panel, see the Set Expressions and Reset Expressions sections.
Frequently asked questions
How is equal interval different from equal distribution?
Equal interval divides the entire data range into equally sized intervals. Equal distribution gives each range an equal number of items, which creates unequally sized intervals.