Chart Legend in the Bold Reports® Web Report Designer
In the Bold Reports® Web Report Designer, a chart legend is text that describes the plotted data. You can toggle the visibility of the legend and customize the legend appearance in the chart design. The Show Legend property is listed under the basic settings category in the chart properties panel.
How do I show or hide the legend?
To show or hide the legend on a Bold Reports® chart surface, toggle the Show Legend checkbox in the properties panel.
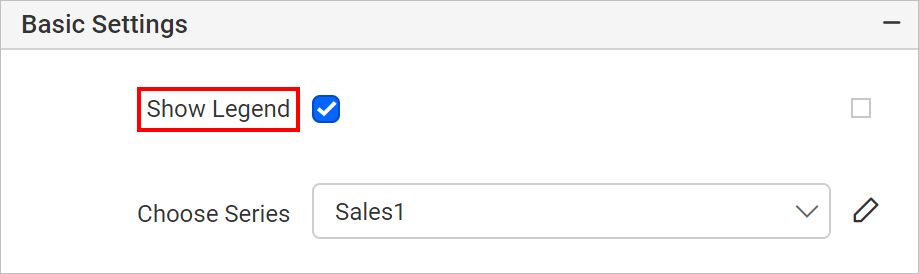
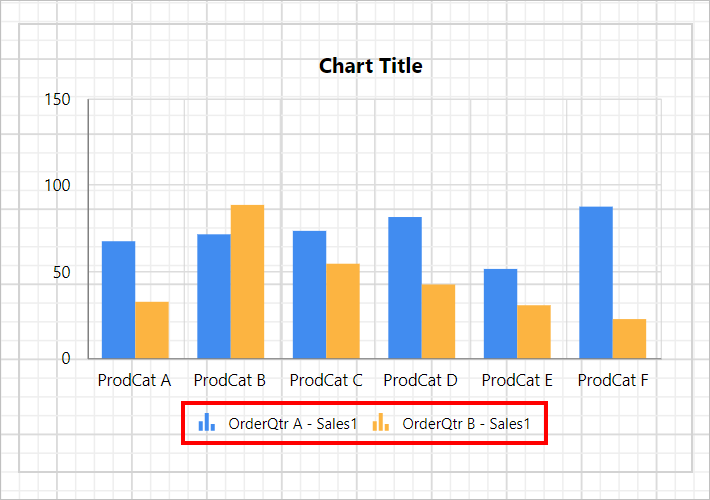
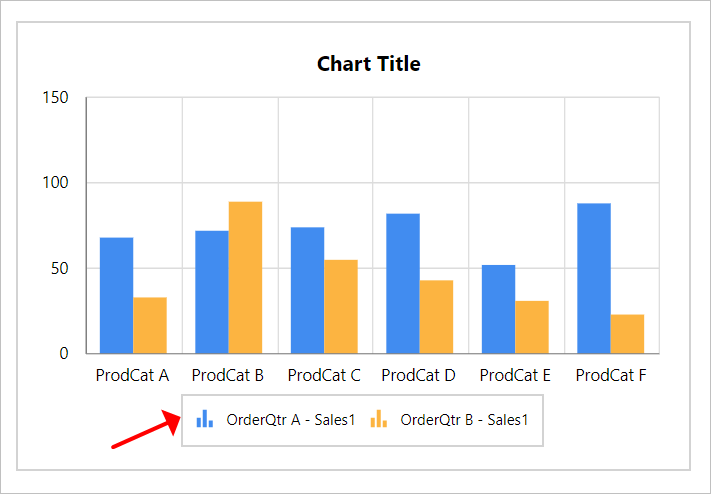
When you enable the Show Legend checkbox, the chart legend displays at the bottom position of the chart area.
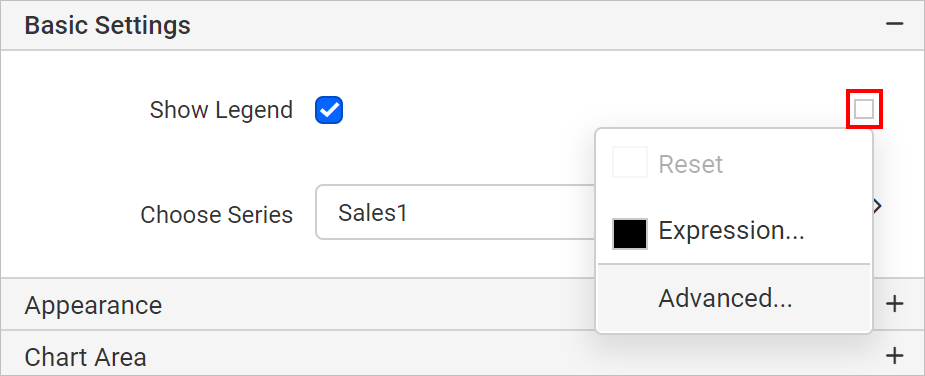
You can also enable or disable the legend based on dynamic values by using Expressions. To open the set or reset expression menu in the properties panel, see the Set Expression and Reset Expression sections.
How do I format the legend?
You customize the Bold Reports® chart legend appearance through the properties in the Advanced menu of the show legend property. Follow these steps:
- Click the square icon on the right side of the
Show Legendcheckbox. - Click the
Advancedoption in the menu.
The legend properties now display in the Advanced Options category.
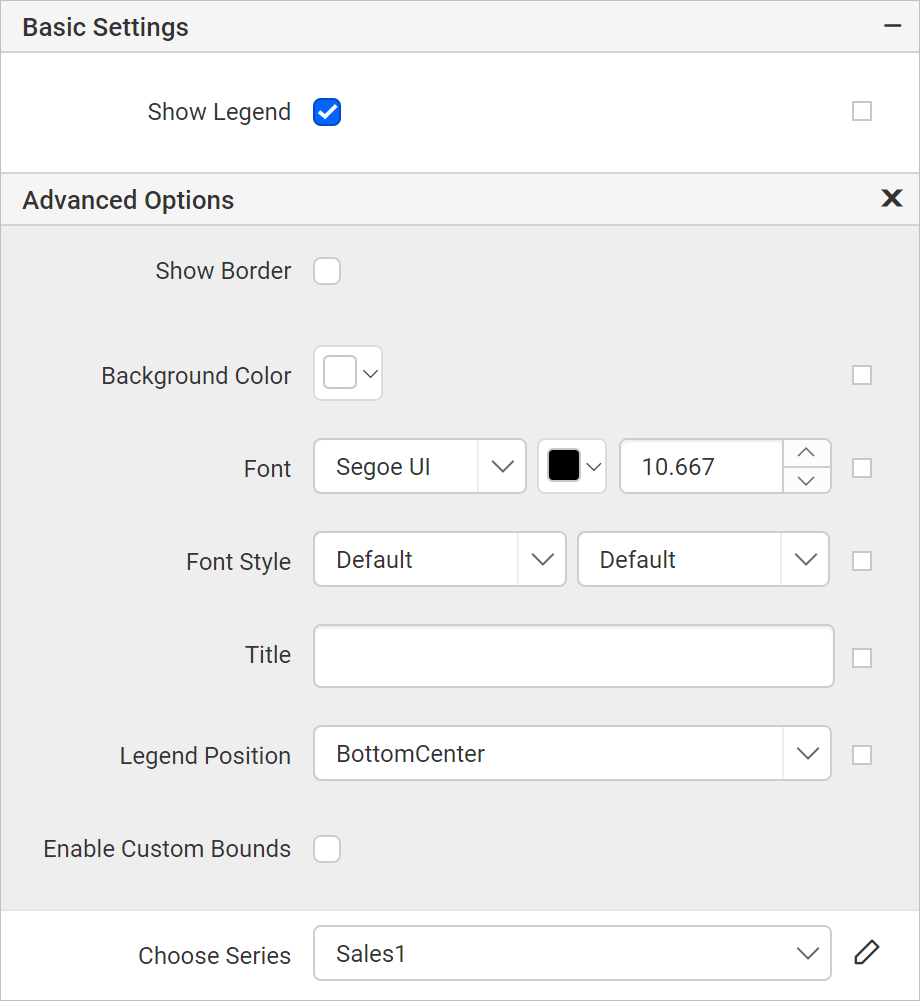
Show border
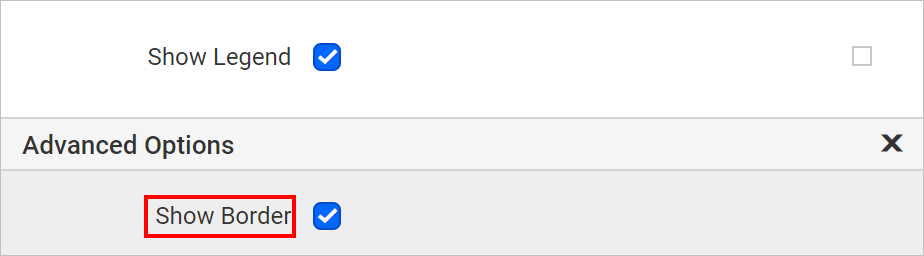
The legend Show Border property sets a border for the legend area in the chart. To enable the legend border, toggle the Show Border checkbox.
The default border is now enabled for the legend area.
A set of border properties also becomes enabled in the Advanced Options category.
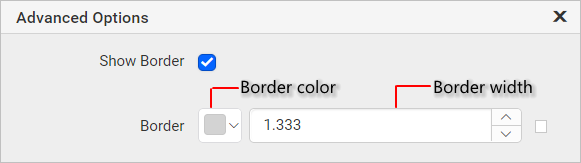
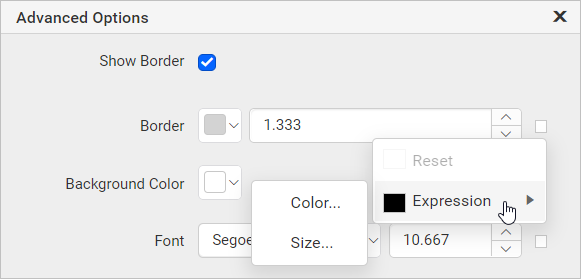
Use the border color and width properties to customize the border for the legend area. You can also set border properties based on dynamic values by using Expressions. To open the set or reset expression menu in the properties panel, see the Set Expression and Reset Expression sections.
Background color
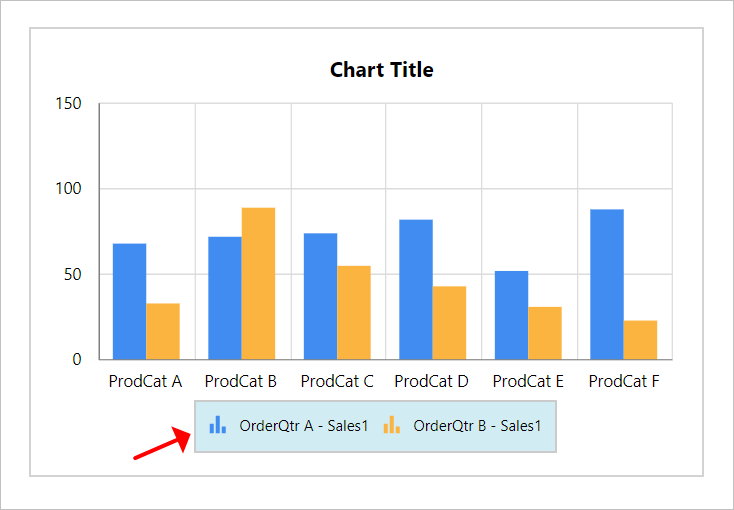
The legend Background color property sets the background color for the legend area.
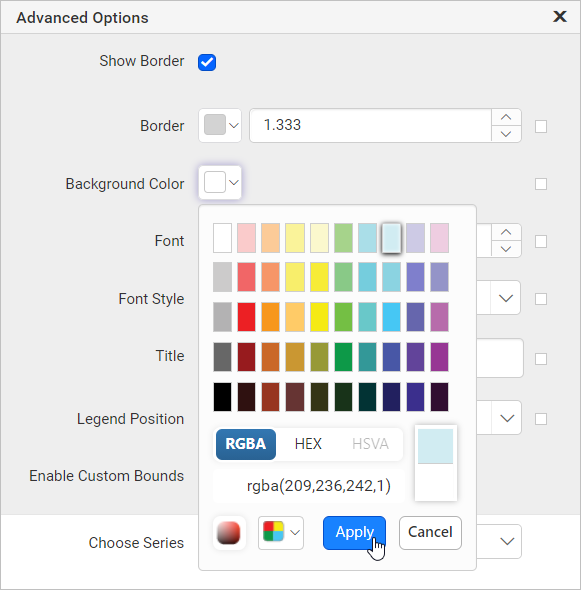
The background color property is then applied to the legend area.
You can also apply the background color based on dynamic values by using Expressions. To open the set or reset expression menu in the properties panel, see the Set Expressions and Reset Expressions sections.
Font
The legend Font properties (font family, font size, and font color) customize the legend text.
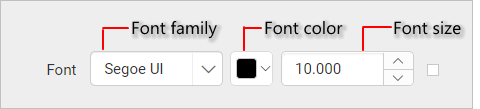
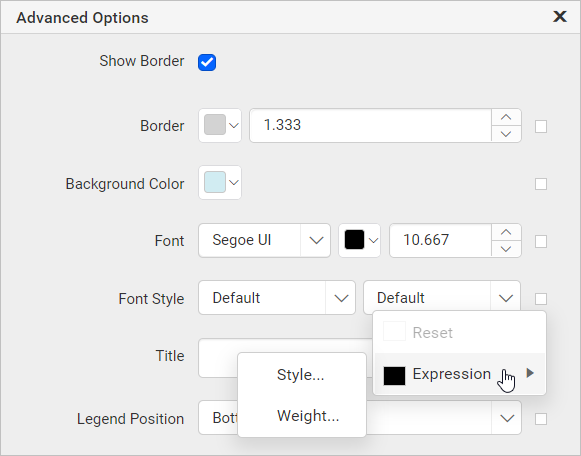
You can also apply font properties based on dynamic values by using Expressions. To open the set or reset expression menu in the properties panel, see the Set Expressions and Reset Expressions sections.
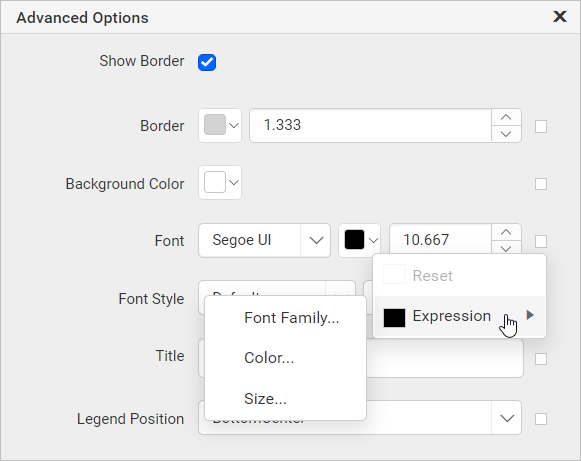
Font Style and Weight
The legend Font Style and Weight properties set the style and weight for the legend text.
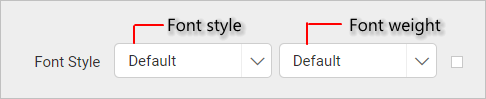
You can also apply font style and weight properties based on dynamic values by using Expressions. To open the set or reset expression menu in the properties panel, see the Set Expressions and Reset Expressions sections.
How do I add a legend title?
The legend Title property adds a title to the Bold Reports® chart legend. Enter the required title text in the title property textbox.
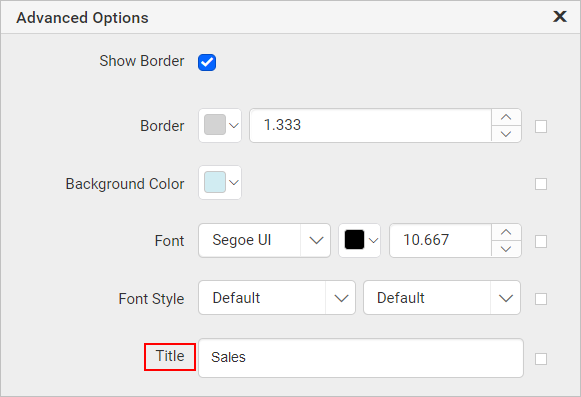
The chart legend area then shows the title text you entered.
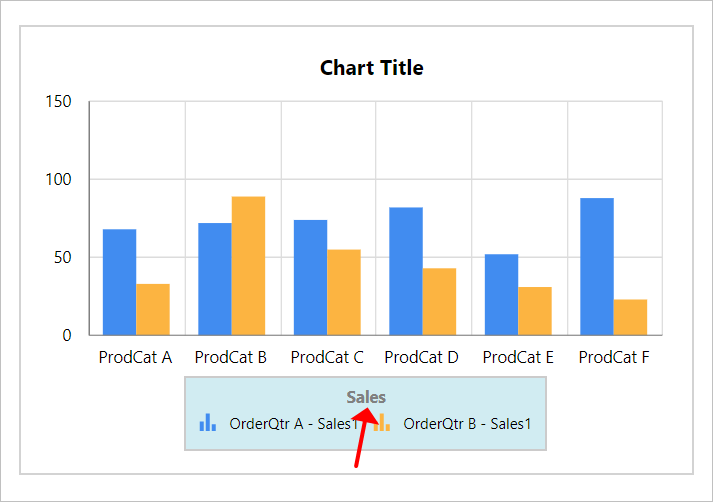
You can also apply title text based on dynamic values by using Expressions. To open the set or reset expression menu in the properties panel, see the Set Expressions and Reset Expressions sections.
Legend position
The Legend position property places the legend in different positions inside the chart area. The Legend Position dropdown lists the supported positioning patterns.
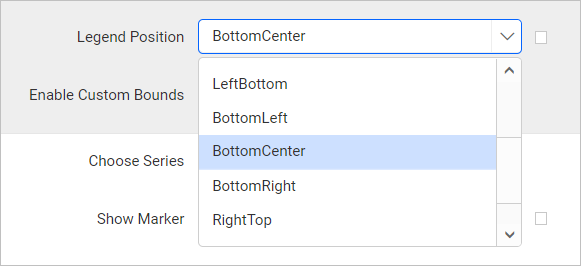
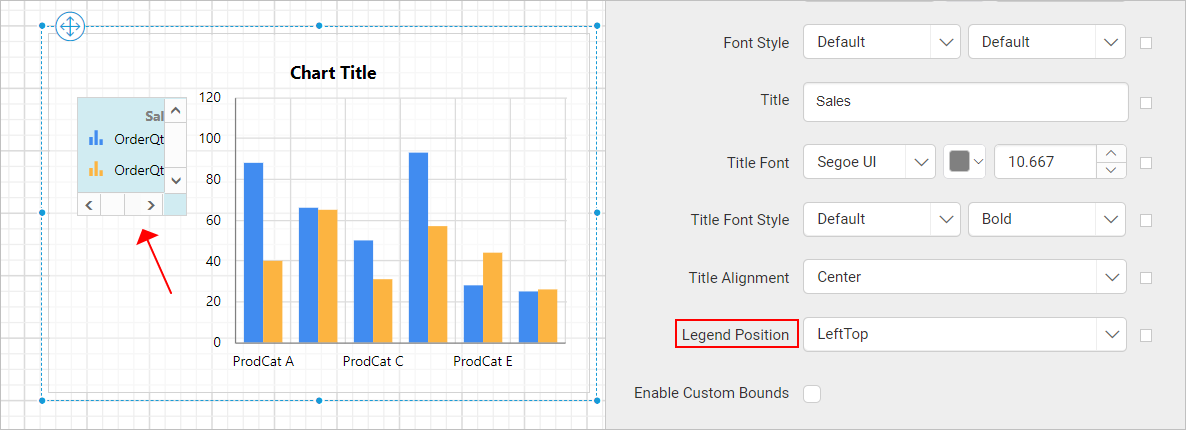
By default, the legend is placed in the BottomCenter position. In the following image, the legend is positioned at the LeftTop position inside the chart area.
Enable custom bounds
The Enable Custom Bounds property customizes the size and position of the chart legend inside the chart area. To set or reset the size and position of the legend, toggle the Enable Custom Bounds checkbox. When you enable the checkbox, the Advanced Options menu lists the position and size properties.
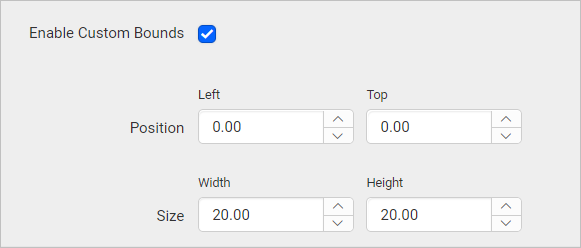
Increase or decrease the width, height, left, and top values as required to position the legend in the chart area.
If the custom bounds property is enabled, the
Legend positionproperty has no effect.
Frequently asked questions
Where does the chart legend appear by default?
When you enable Show Legend, the legend displays at the bottom of the chart area. The default Legend Position is BottomCenter.
Why does the Legend position setting have no effect?
The Legend position property has no effect when the custom bounds property is enabled.