Shape settings
Each region in a map surface is called a map shape or map polygon. We can customize these shapes by applying a label, tooltip, border, and background color.

Customize shapes
These properties are listed under Shape Settings in the map properties.

Background color
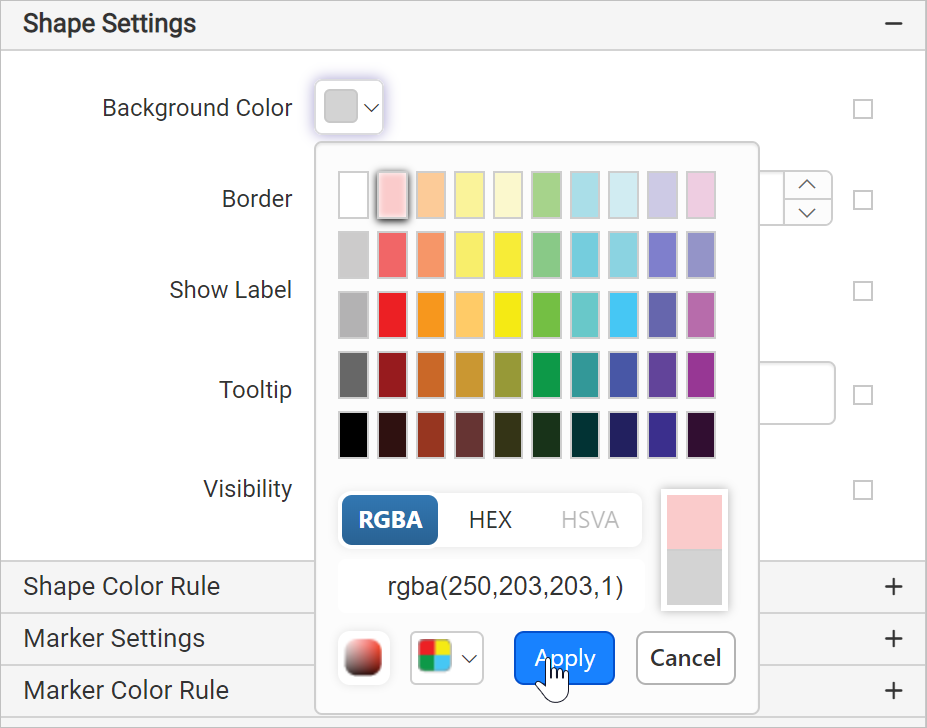
Background color property can be used to set the background color for the shapes in map surface.
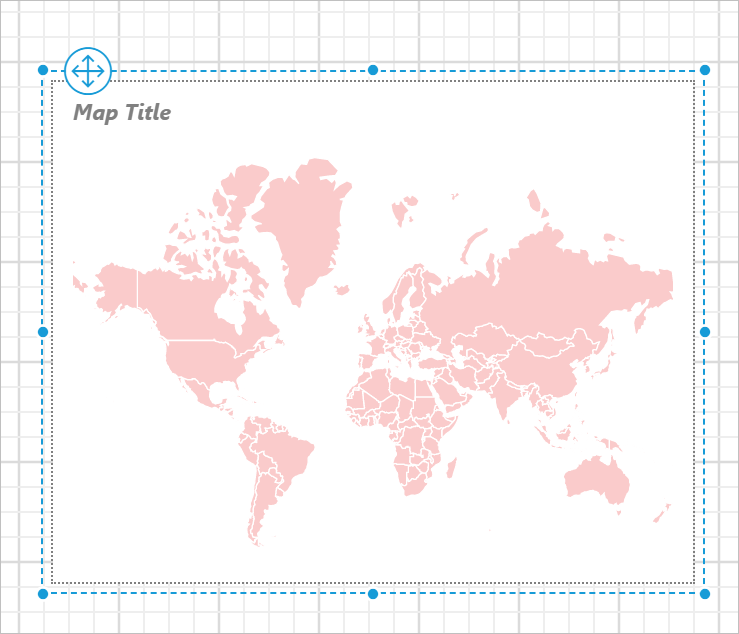
Now, the background color property will be applied to the map shapes.
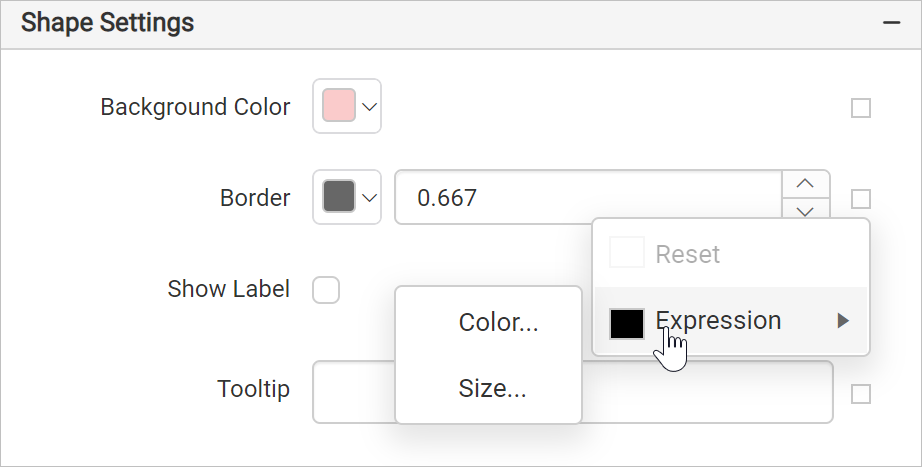
You can also apply background color based on dynamic values, by using the Expressions. Refer Set Expressions and Reset Expressions section to open set/reset expression menu in properties panel.
When you apply any of the map shape color rules, it will take precedence over basic shape settings.
Border
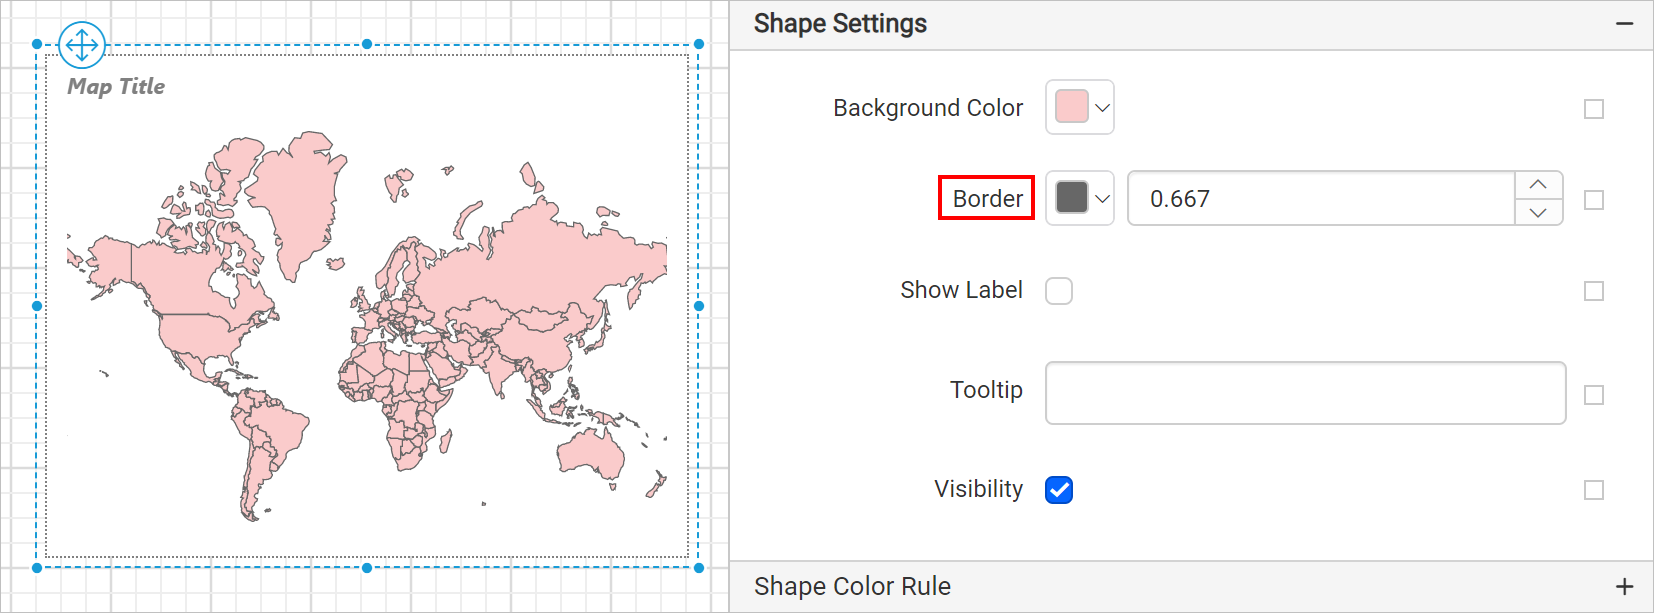
Border property can be used to draw border around each shapes in the map surface. You can set color and size of the border using this property. The border will be applied around the map shapes as shown in below image,
You can also set border properties based on dynamic values, by using the Expressions. Refer Set Expression and Reset Expression section to open set/reset expression menu in properties panel.
Label
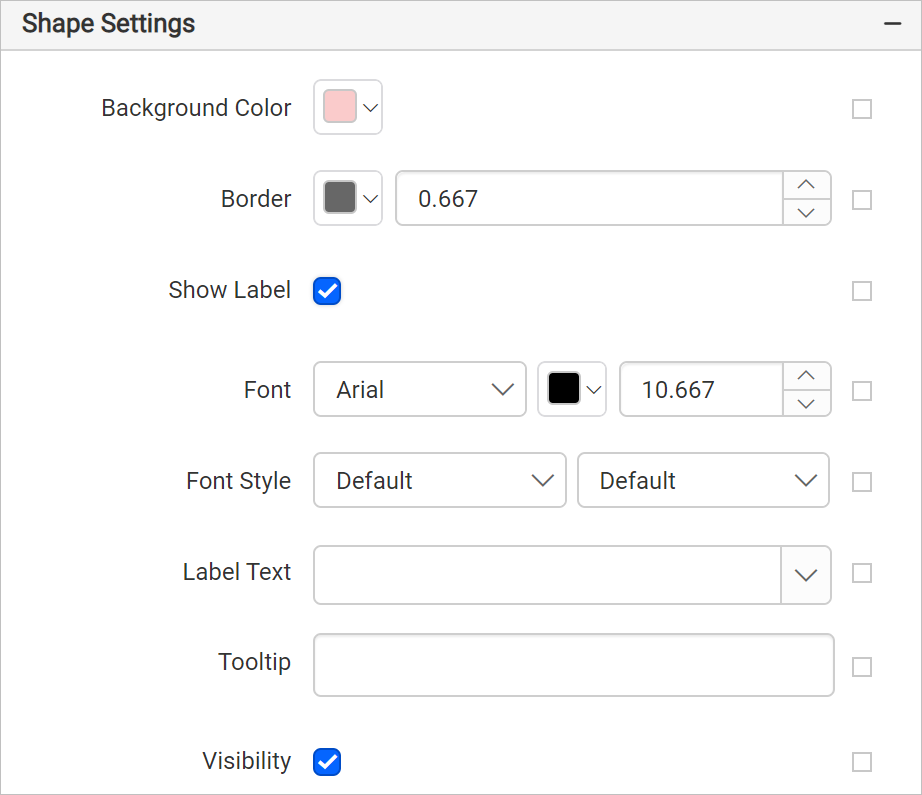
Show label property can be used to toggle the label visibility for map shapes. To enable label for shapes, toggle the Show Label checkbox. Once you enable label, other properties required for label customization will start displaying under Shape Settings category.
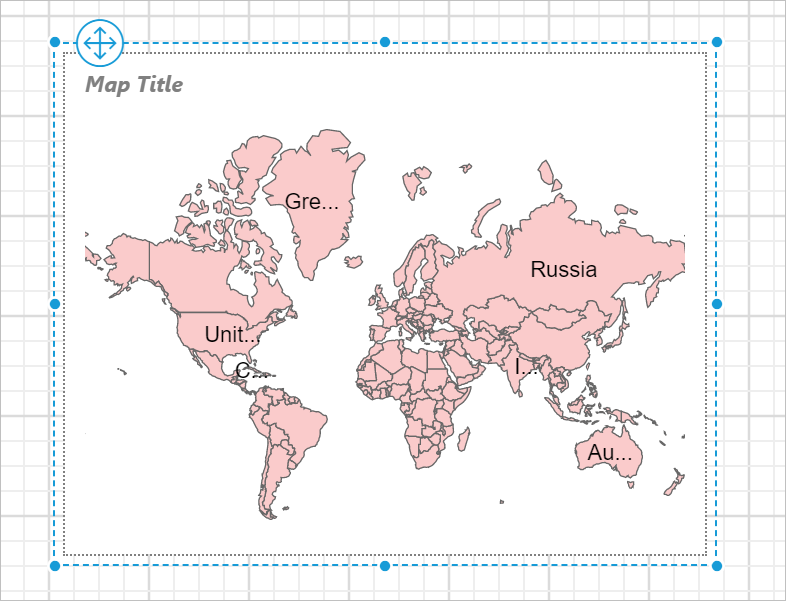
The labels will get enabled in map surface like below,
Font
You can customize the label font family, size, and style using the font properties,
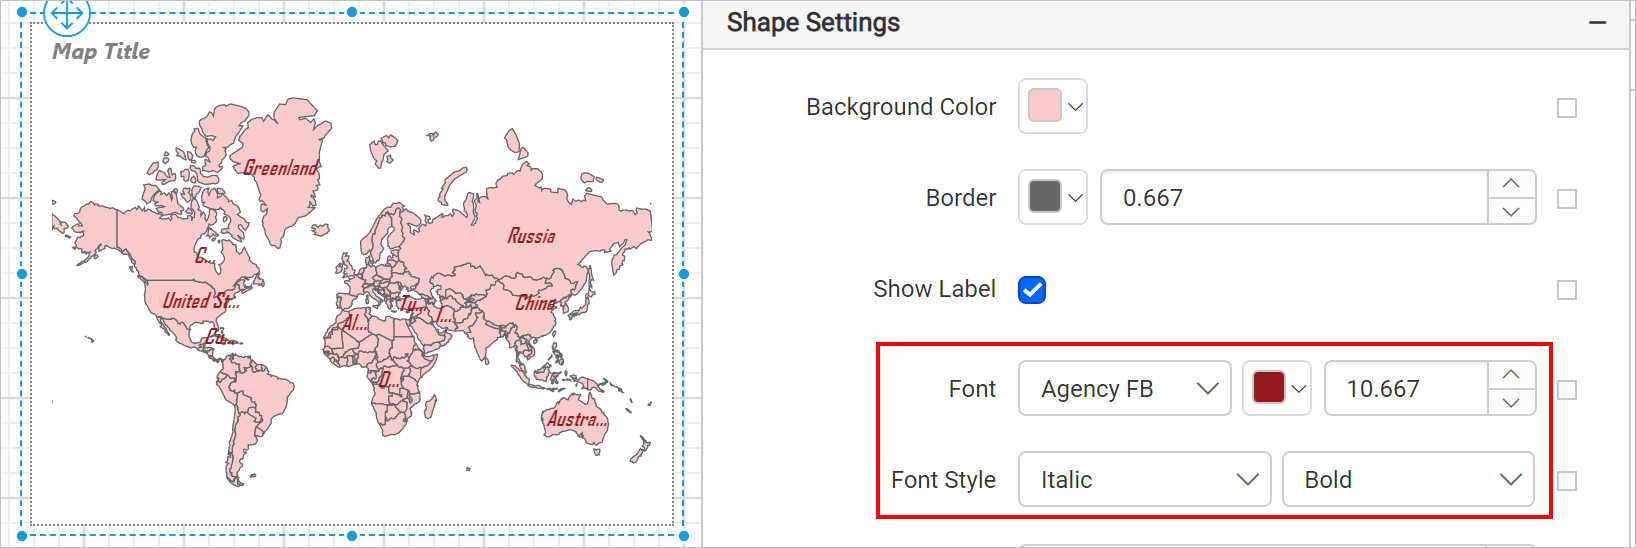
You can also apply font style and weight properties based on dynamic values, by using the Expressions. Refer Set Expressions and Reset Expressions section to open set/reset expression menu in properties panel.
Text
The available shape data fields and analytical data fields will be listed in the Label Text property drop-down.
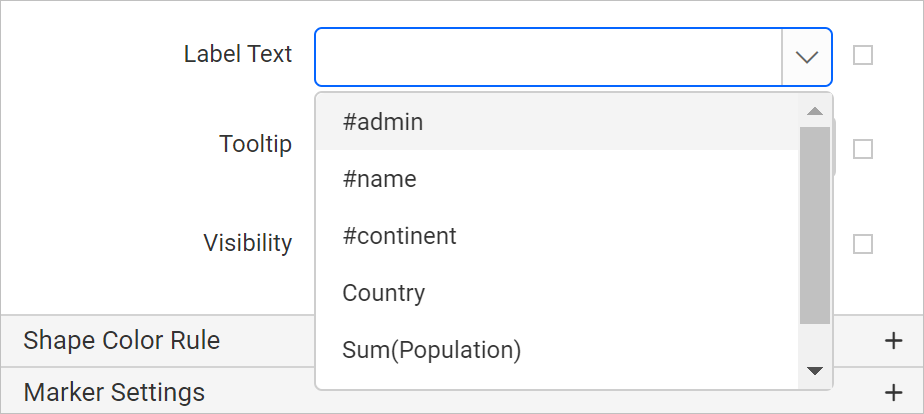
The fields prefixed with
#are shape fields.
Choose the required field or enter a static text in the label text property. If you choose shape or analytical field, respective fields values will be displayed in respective shapes on the map surface. If you enter static text, the same text will be displayed in all shapes on the map surface.
You can also apply label text based on dynamic values, by using the Expressions. Refer Set Expressions and Reset Expressions section to open set/reset expression menu in properties panel.
Tooltip
You can configure a tooltip for shapes using the ToolTip property. It can be used to display information, such as descriptive text or data related to the specific shape. When you hover over the each shape in a rendered report, information will be shown in the tooltip.
You can enter a static text or set an expression that evaluates to a value. Refer Set Expressions and Reset Expressions section to open set/reset expression menu in properties panel.

Visibility
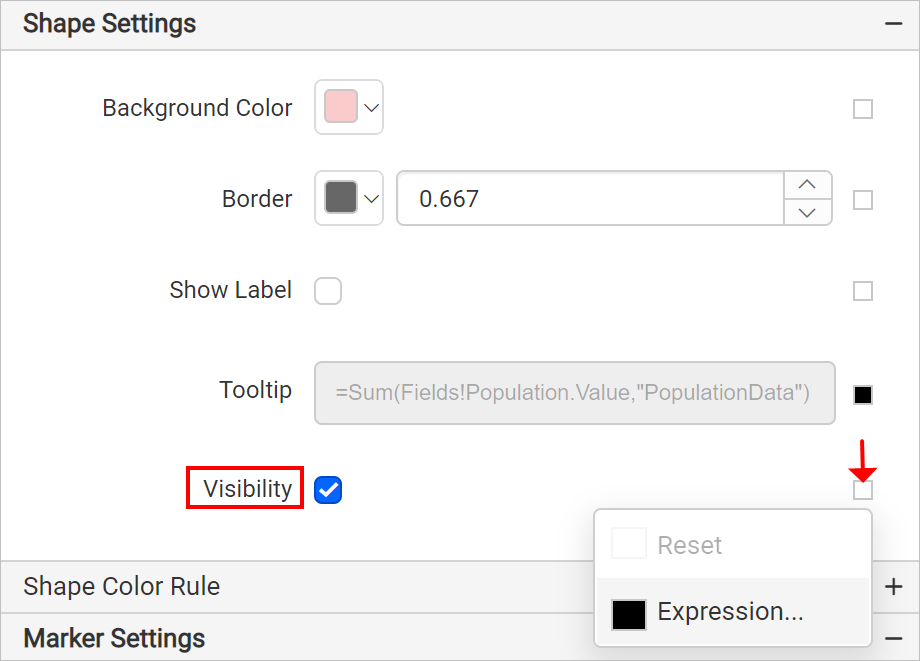
Visibility property can be used to conditionally show or hide the map shapes on report preview or export action. To show/hide shapes in the map surface, toggle the Visibility checkbox.
You can also set the visibility of map shapes based on dynamic values using expressions. Refer Set Expressions and Reset Expressions section to open set/reset expression menu in properties panel.
