Switch Series Chart Type
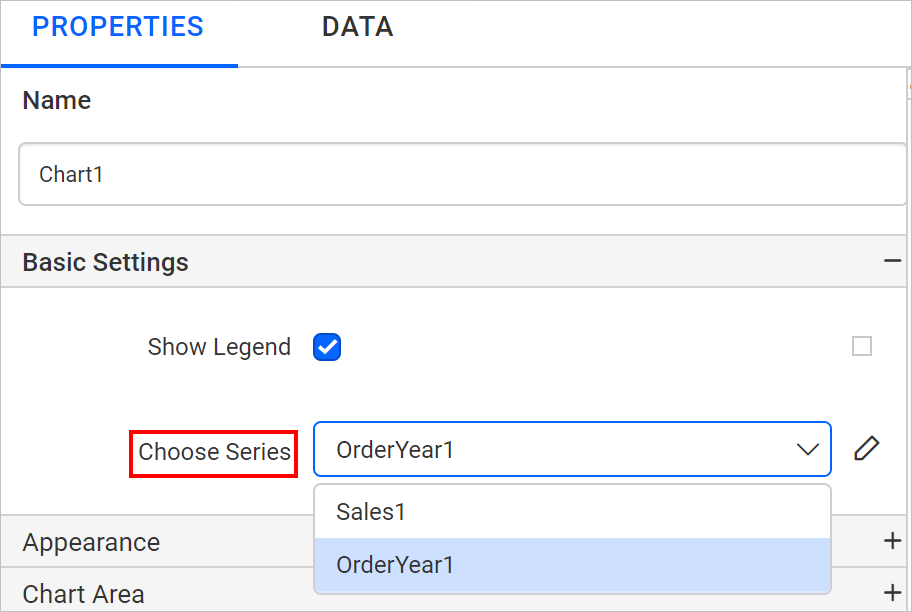
This section explains how to change the series chart type of chart report item during the report design using the chart type switcher in Bold Reports® Designer. You can change the series chart type using the Chart Type dropdown under series properties. To open specific series properties, choose the series name in Choose Series dropdown.
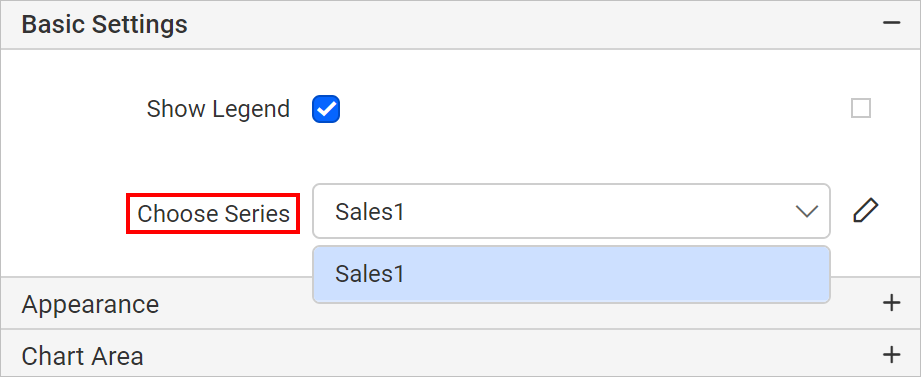
Clicking on the Edit icon, will display properties to customize the respective series.
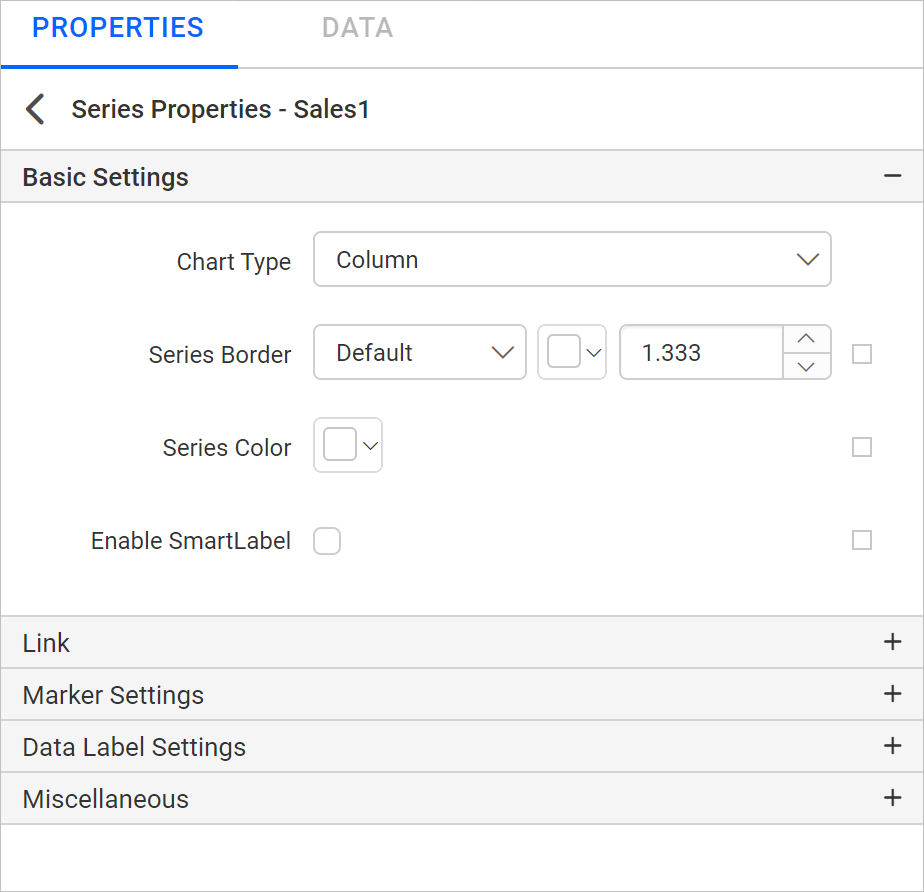
Chart type switcher is listed under Basic Settings.
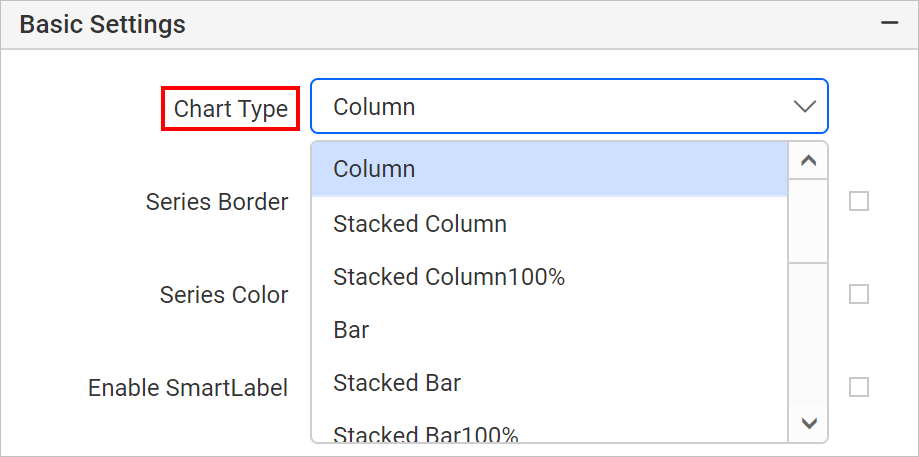
Based on the present series chart type, compatible types will be listed under chart type dropdown. For example, if the existing series chart type is pie chart, the chart type dropdown will have types as shown below.
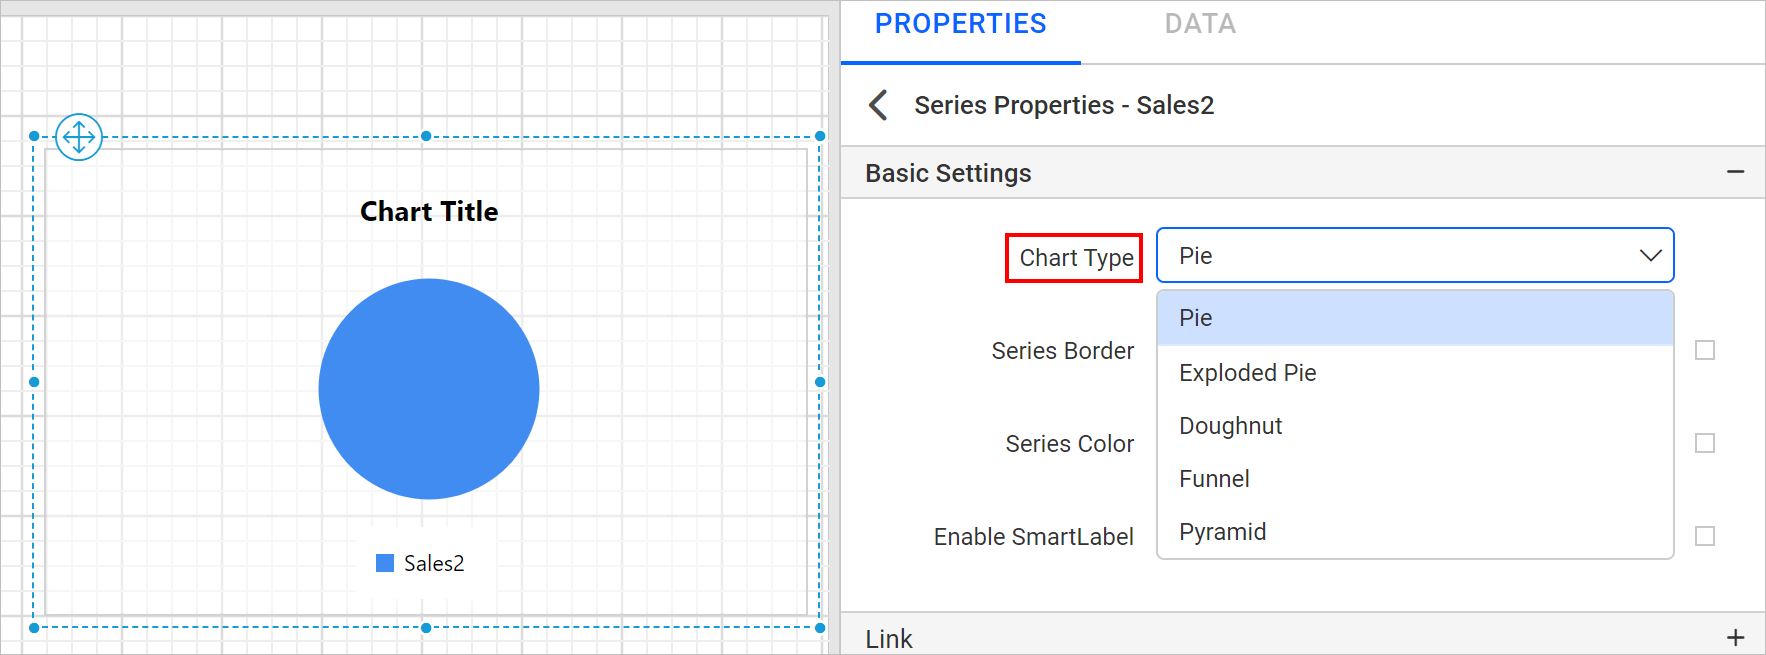
Chart with single series
If the chart has single series, then changing the series chart type will directly change the chart to expected chart type. For example, if the report has a column chart with single series.
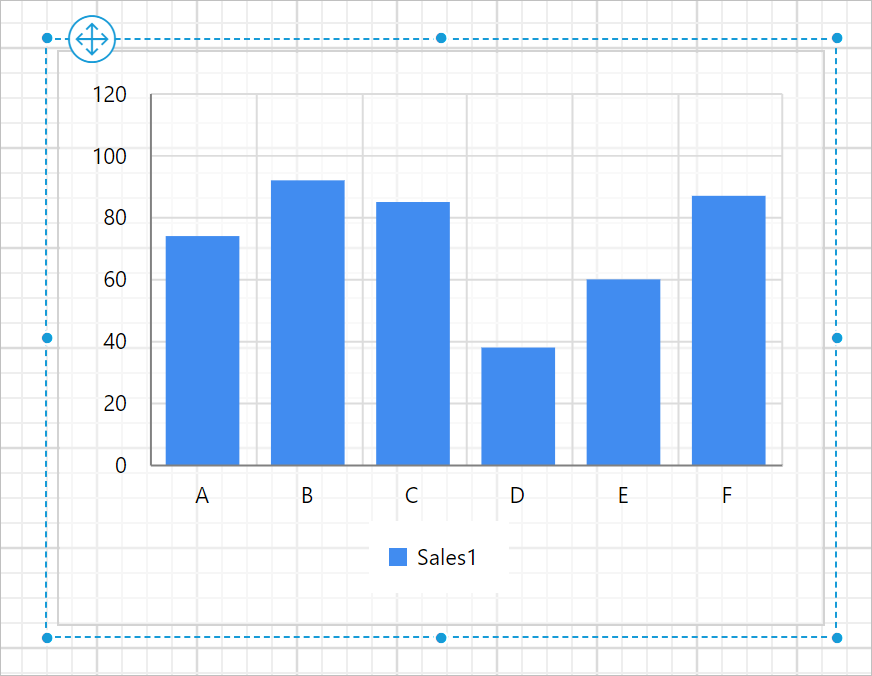
To change series chart type to Line, choose Line in chart type dropdown.
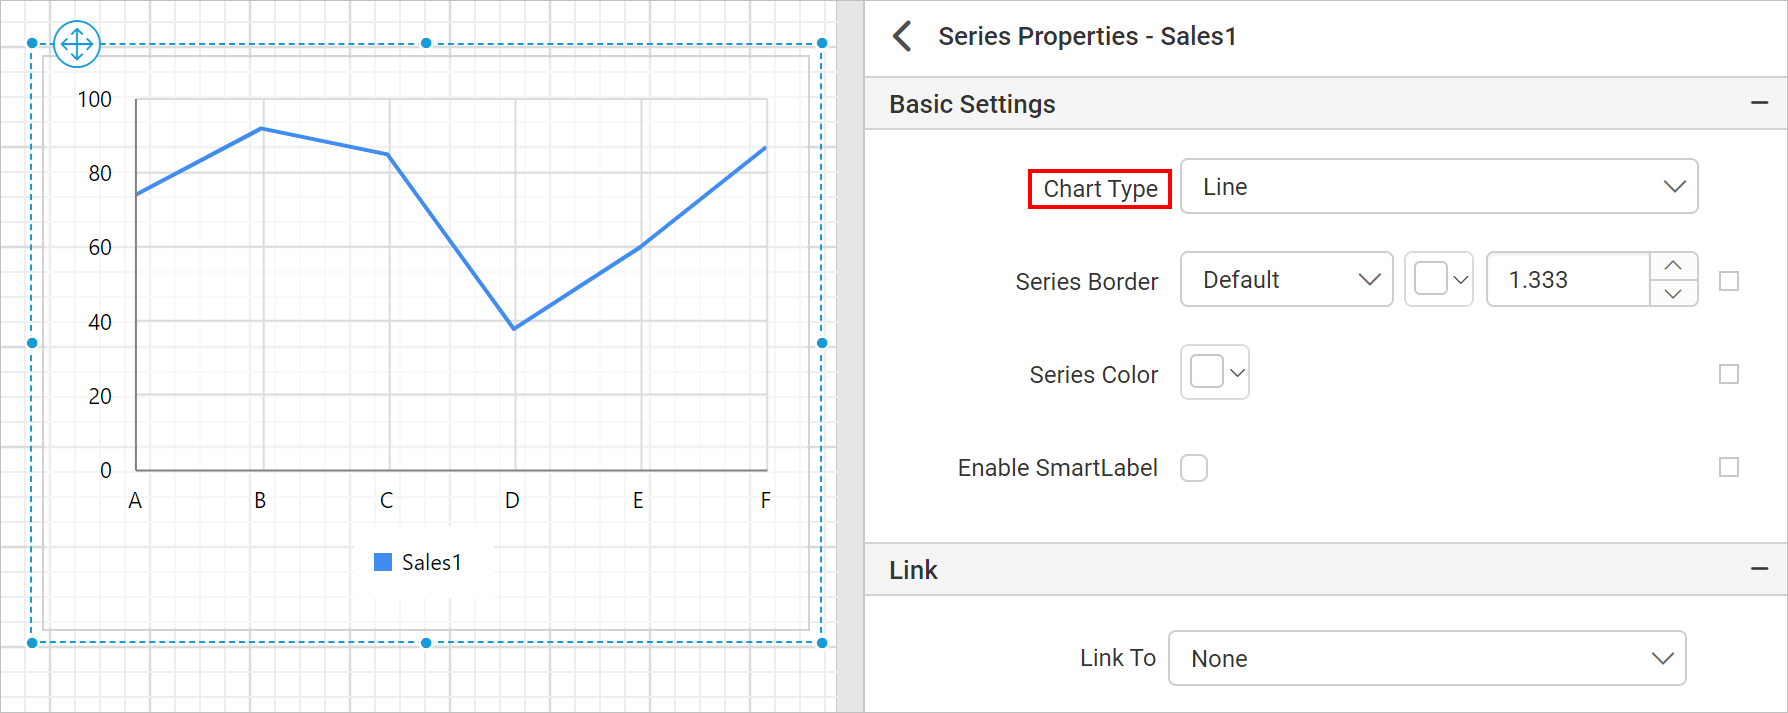
Chart with multiple series
A chart containing multiple series may exhibit different behaviors during series chart type switching, depending on the source and target chart types. This document outlines the scenarios where either individual chart series type switching (affecting only the selected series) or combined chart series type switching (affecting all series collectively) takes place.
Individual Chart Series Type Switching
Only the selected series is switched to the new chart type for the following source and target types.
| Source Series Chart Type(s) | Target Series Chart Type(s) |
|---|---|
| All Column types | All Line and Area types |
| All Line types | All Column, Area and other Line types |
| All Area types | Column and Line types |
| Range Column | Range Area, Smooth Range Area and vice versa |
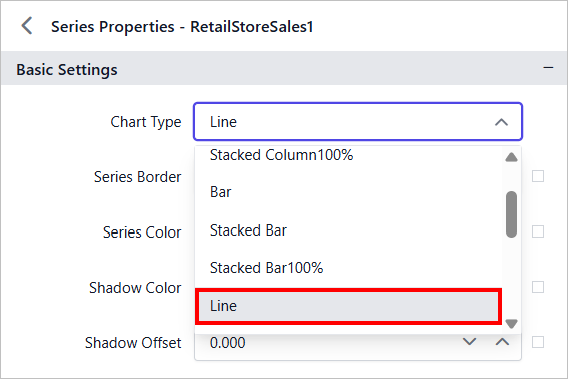
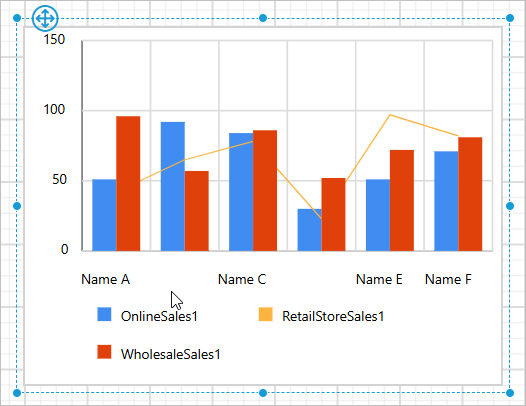
For example, if the report has a column chart with multiple series.
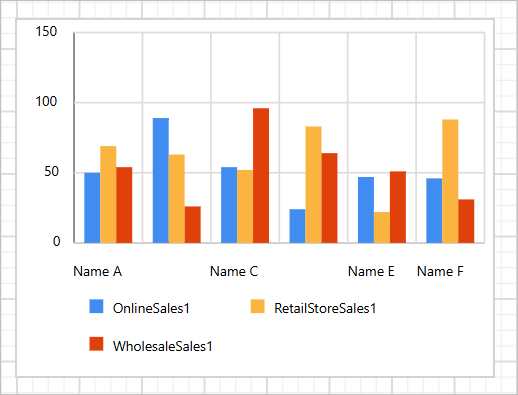
Choose a series for which you want to change its type.
To change chart series type to Line, choose Line in chart type dropdown.
Combined Chart Series Type Switching
-
All series chart types in the chart will be switched to the target chart type, provided that the source and target types belong to the same category. Please refer the following table to find the category of different charts.
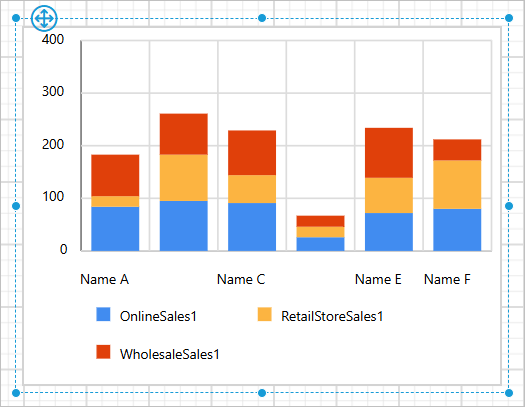
Chart Category Chart Types Proportion Charts Pie, Exploded Pie, Doughnut, Pyramid, Funnel Column Charts Column, Stacked Column, Stacked Column 100 Bar Charts Bar, Stacked Bar, Stacked Bar 100 Area Charts Area, Smooth Area, Stacked Area, Stacked Area 100 Polar and Radar Chart Polar, Radar For example, if the report has a column chart with multiple series.
Choose a series for which you want to change its type.
To change chart series type to
Stacked Column, chooseStacked Columnin chart type dropdown.
-
All series chart types will be converted to the new type for the following source and target combinations. A warning dialog will be displayed to confirm this action before it proceeds.
Source Series Chart Type(s) Target Series Chart Type(s) Range Column, Range Area, Smooth Range Area Range Bar All Column, Area and Line types All Bar types For example, a column chart with multiple series.
Choose a series for which you want to change its type.
To change series chart type to
Bar, chooseBarin chart type dropdown.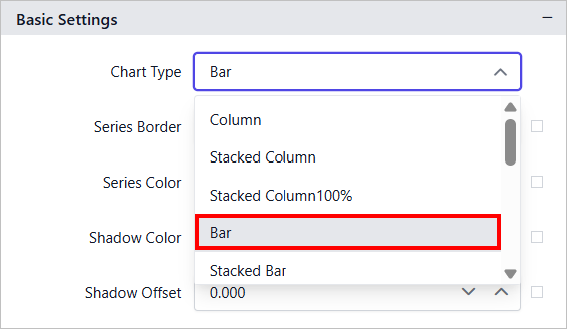
A confirmation dialog will be displayed like below.
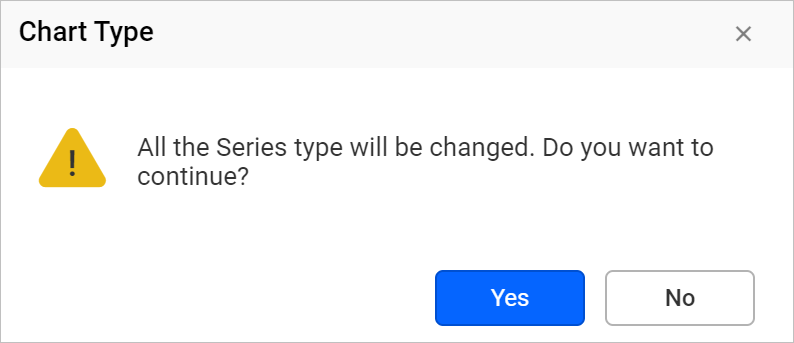
Clicking
Yeswill change existing series types toBar.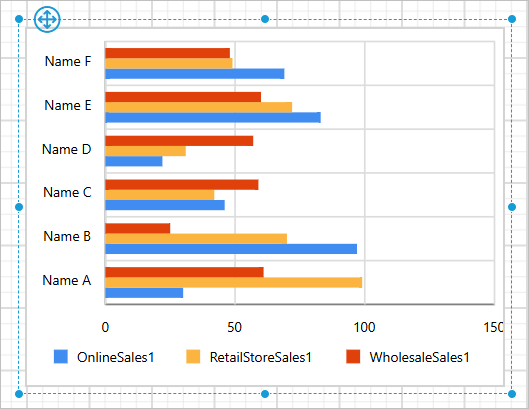
Clicking
Nowill let the respective series unchanged.