Create a RDL report
This section describes simple steps to design a RDL report using the Standalone Report Designer. First, launch the Bold Reports Designer application shortcut from your desktop/start menu.
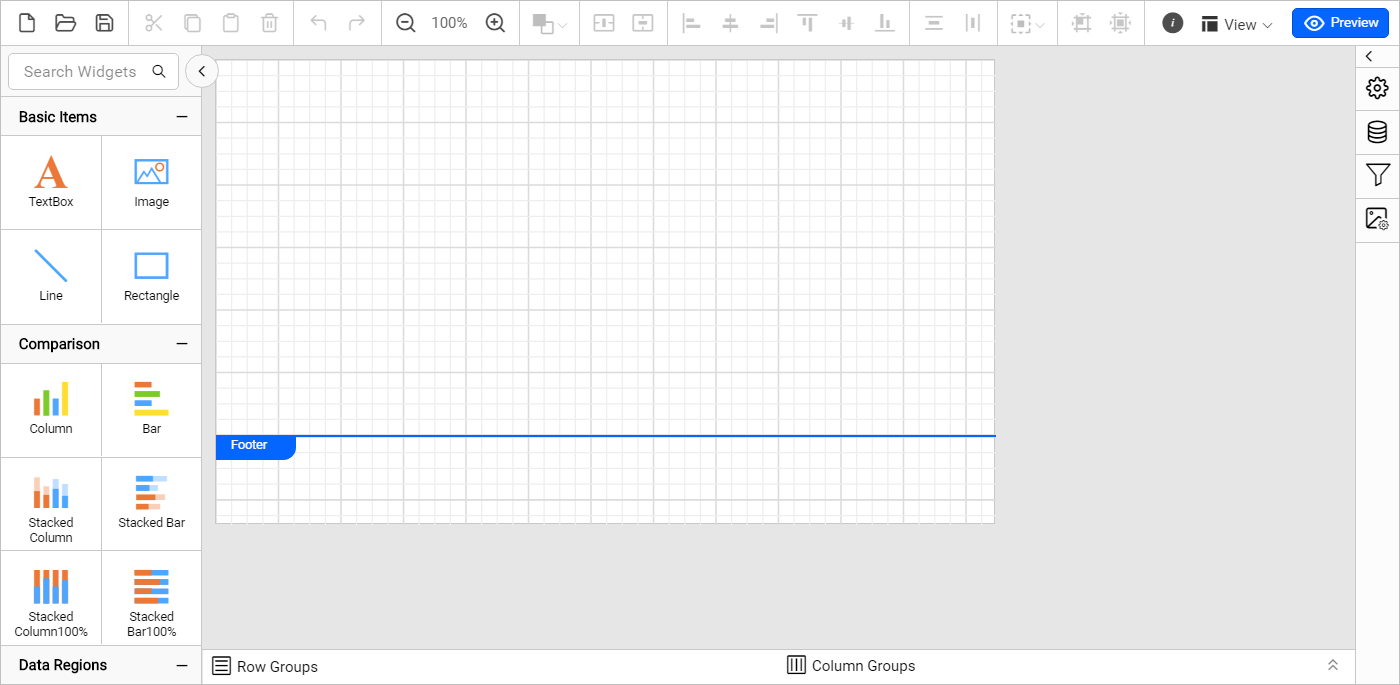
The Bold Reports® Designer will be launched with a new blank report.
Create Data
- To add a data, click on the Data icon in the
Data Configurationpanel. It opens theDatapanel.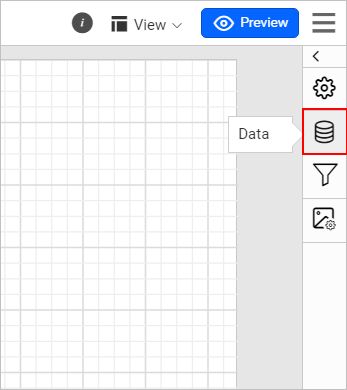
- Click on the
New Databutton in the data panel.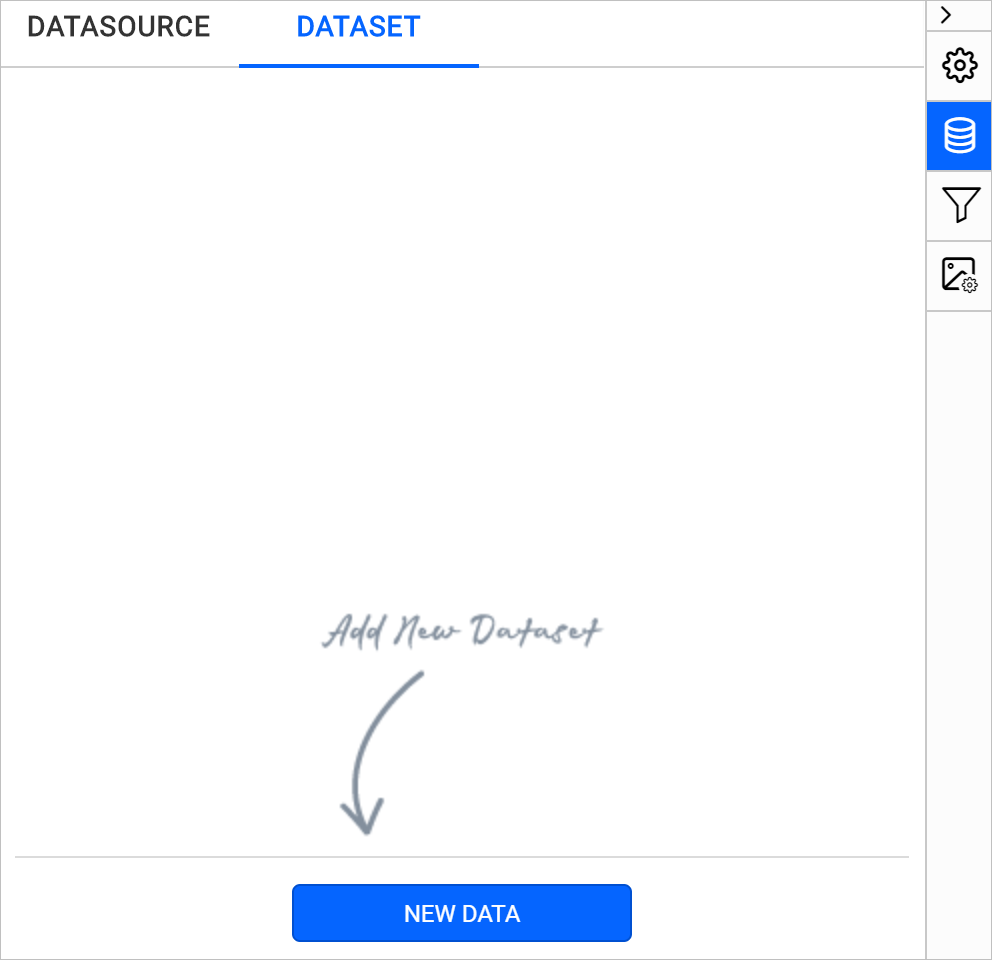
- Choose the
SQLtype to connect the data.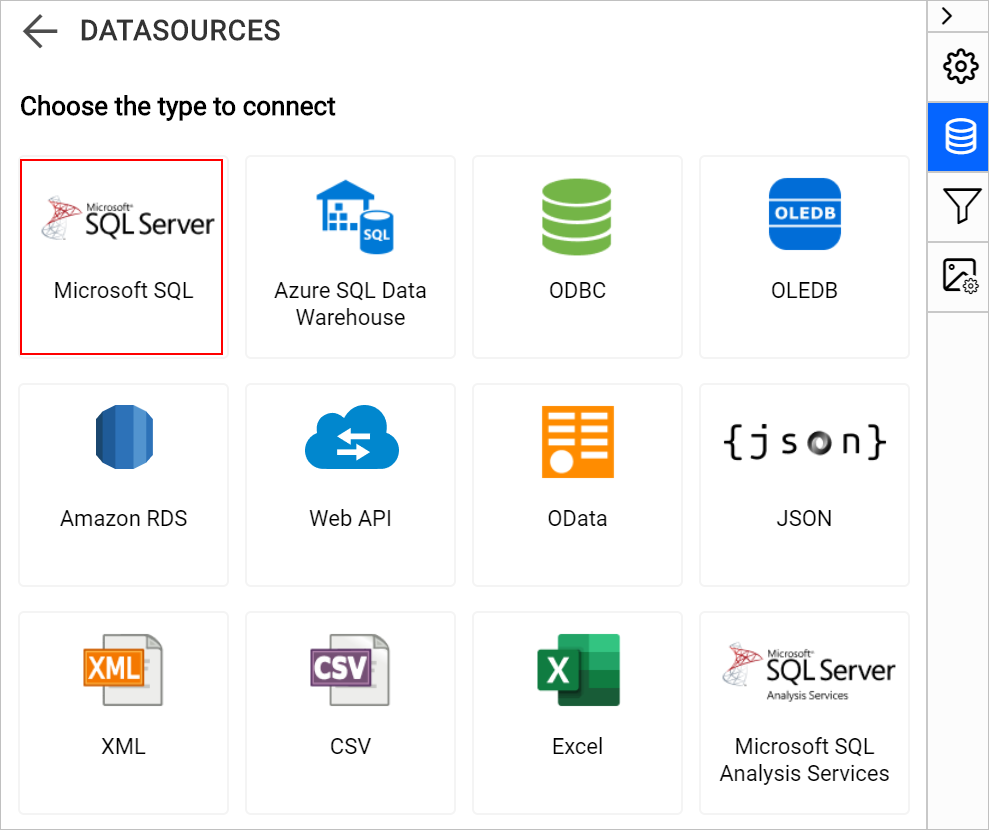
- In the new data source panel,
- In the Name field, specify the data source name without any special characters.
- In the Server Name field, you need to select an existing server in the local network from the dropdown list or specify the specific remote server name like
myserver.domain.com. - In the Authentication Type field, choose Windows or SQL Server authentication.
- If you have chosen SQL Server authentication, specify the username and password of the server.
- In the Database field, choose or enter an existing valid database, e.g., AdventureWorks.
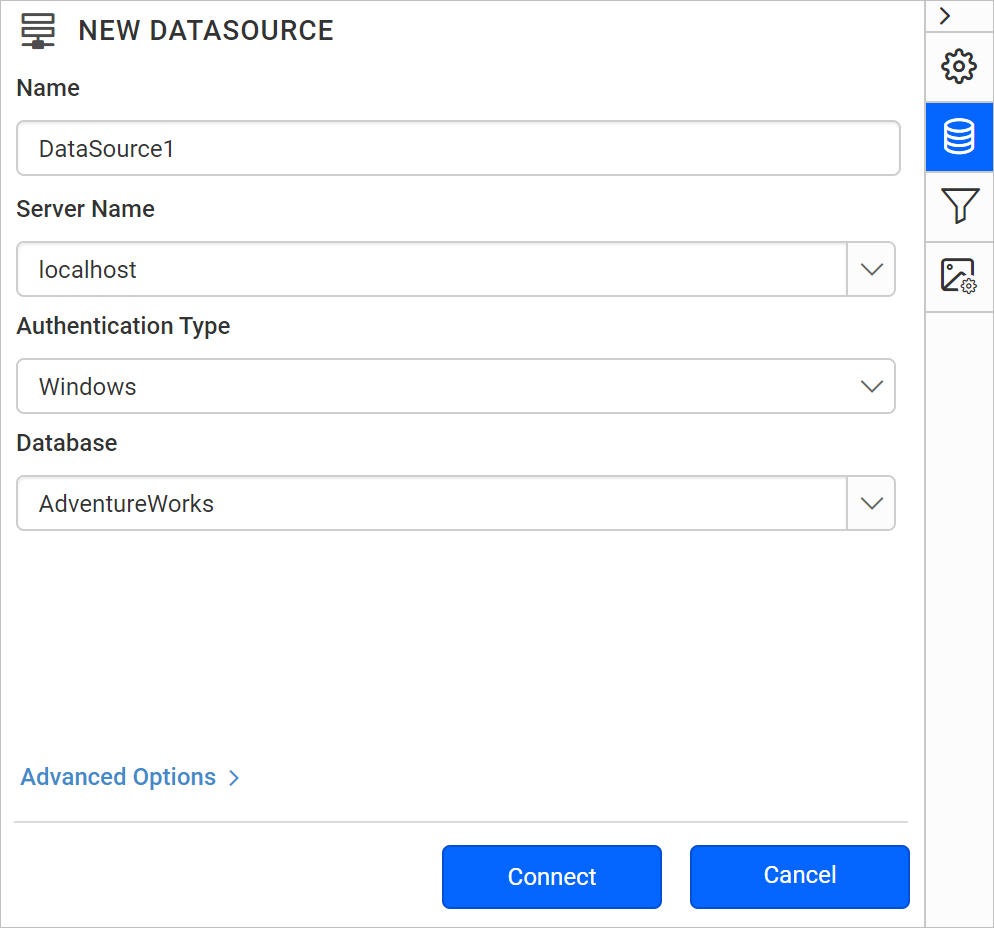
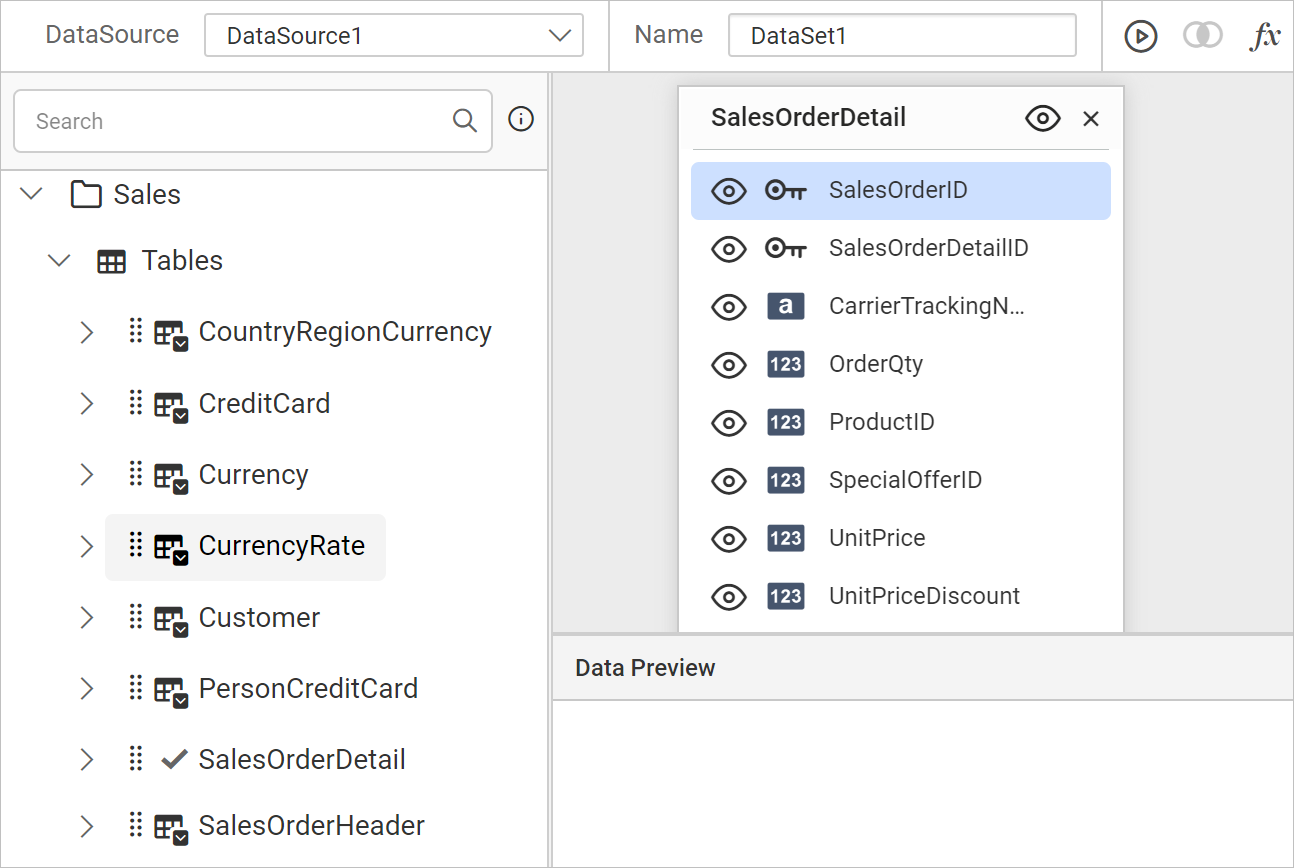
- Click the
Connectbutton. Now the following view will be displayed.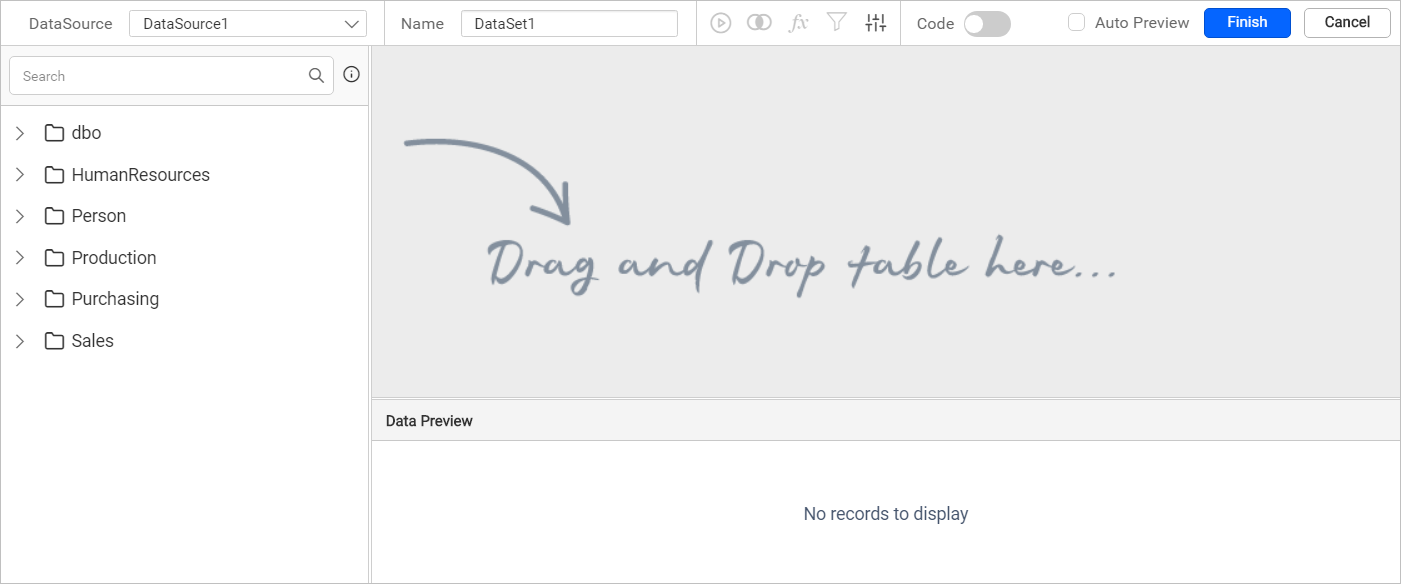
Here, an AdventureWorks database is used for the demonstration.
Edit dataset name
You can edit the name of the Data in the Name field that is available in the toolbar pane.

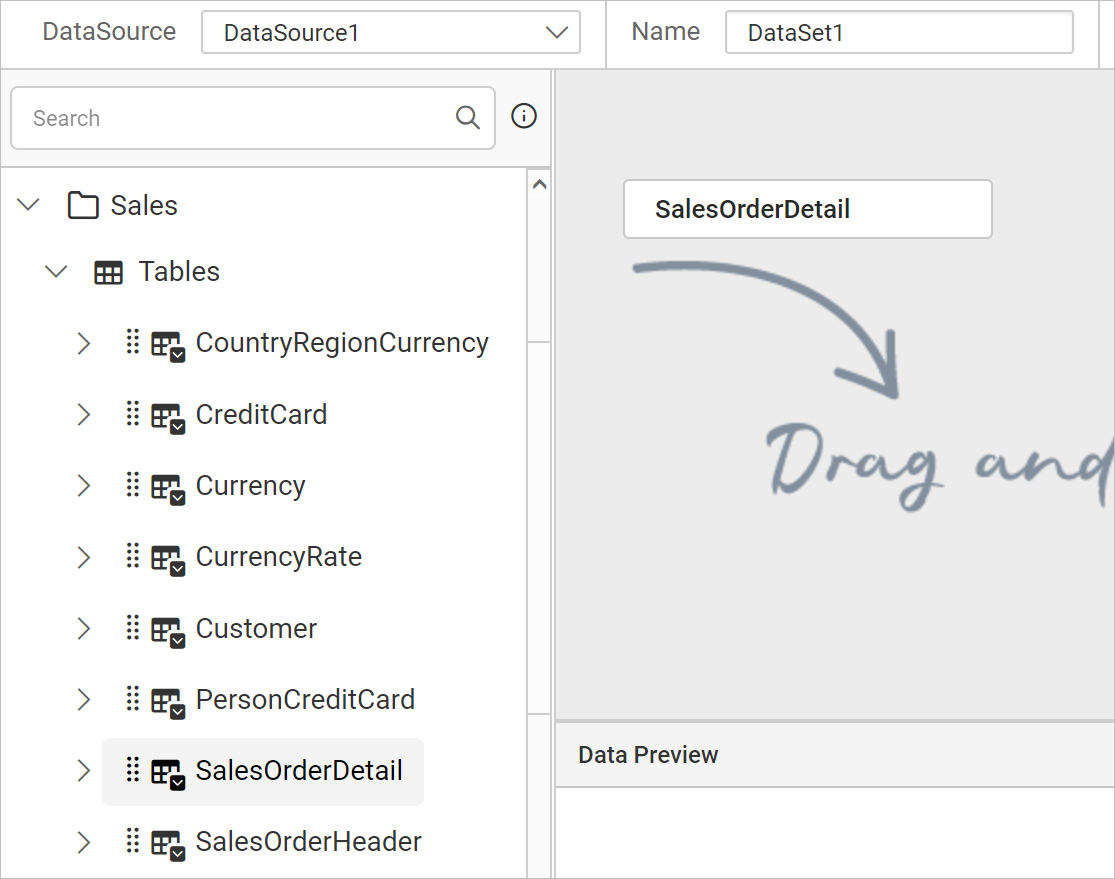
Drag and drop table in query designer
The left pane holds the tables, views, and procedures associated with the connected database. Drag your preferred table or view from the left pane and drop into the center pane labeled with Drag and Drop table here like below:
Now, the table will be dropped into the design area as shown below.
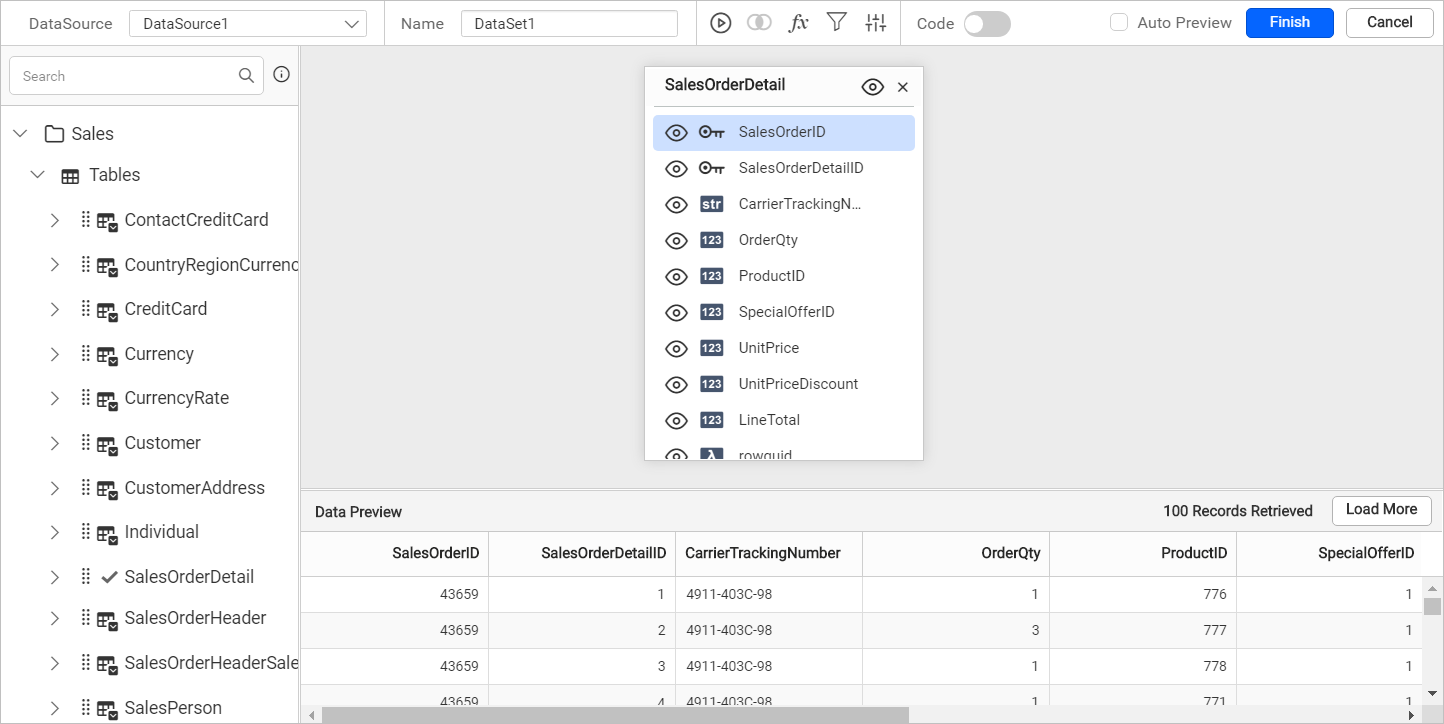
Execute query
- You can execute and visualize the data by using the
Runoption in the tools pane.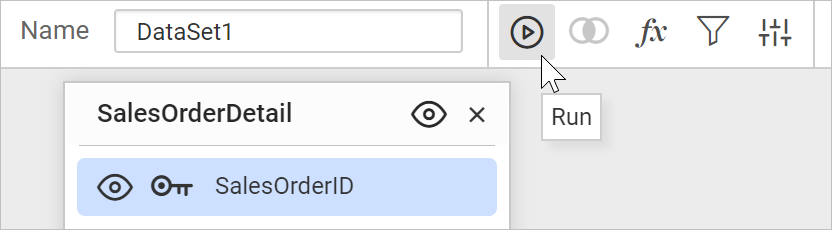
- Now, the data will be retrieved based on the specified query.
Save Data
- Click on the
Finishbutton in the tools pane.
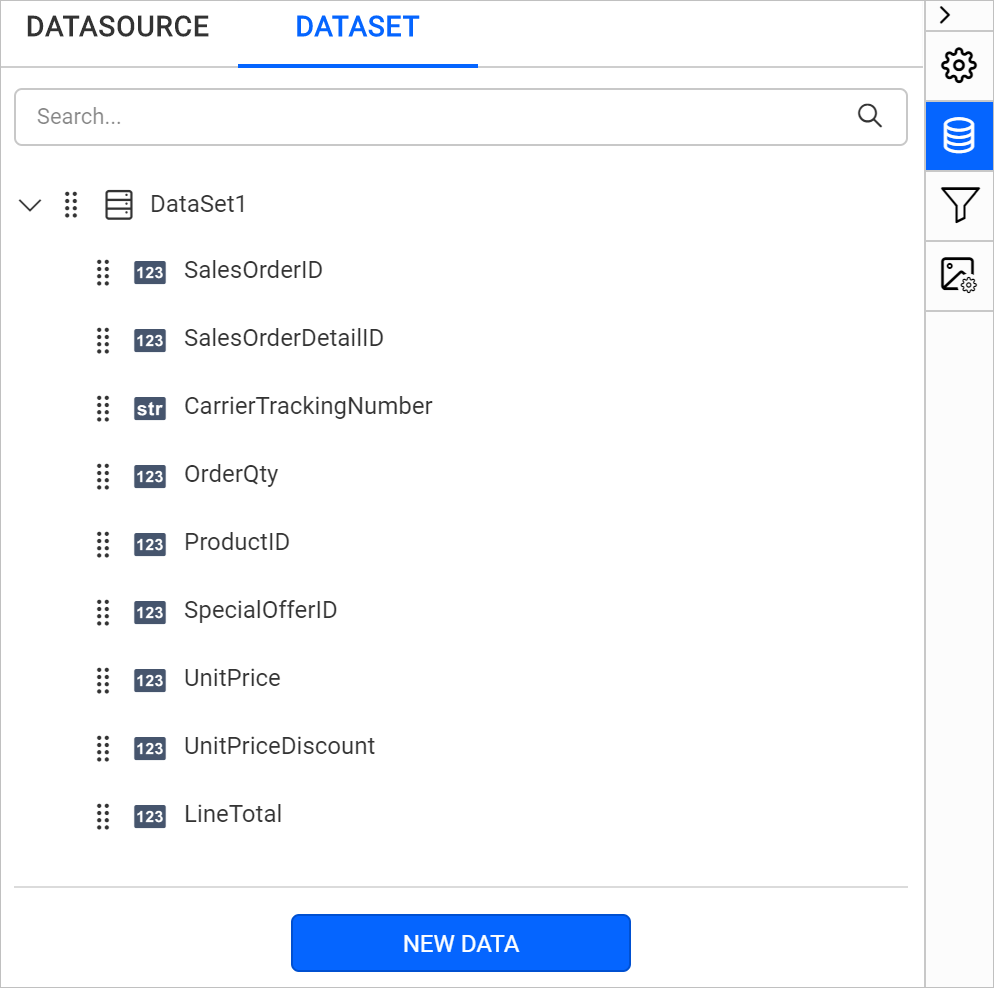
- Your dataset should now be listed on the
Datapanel as shown below.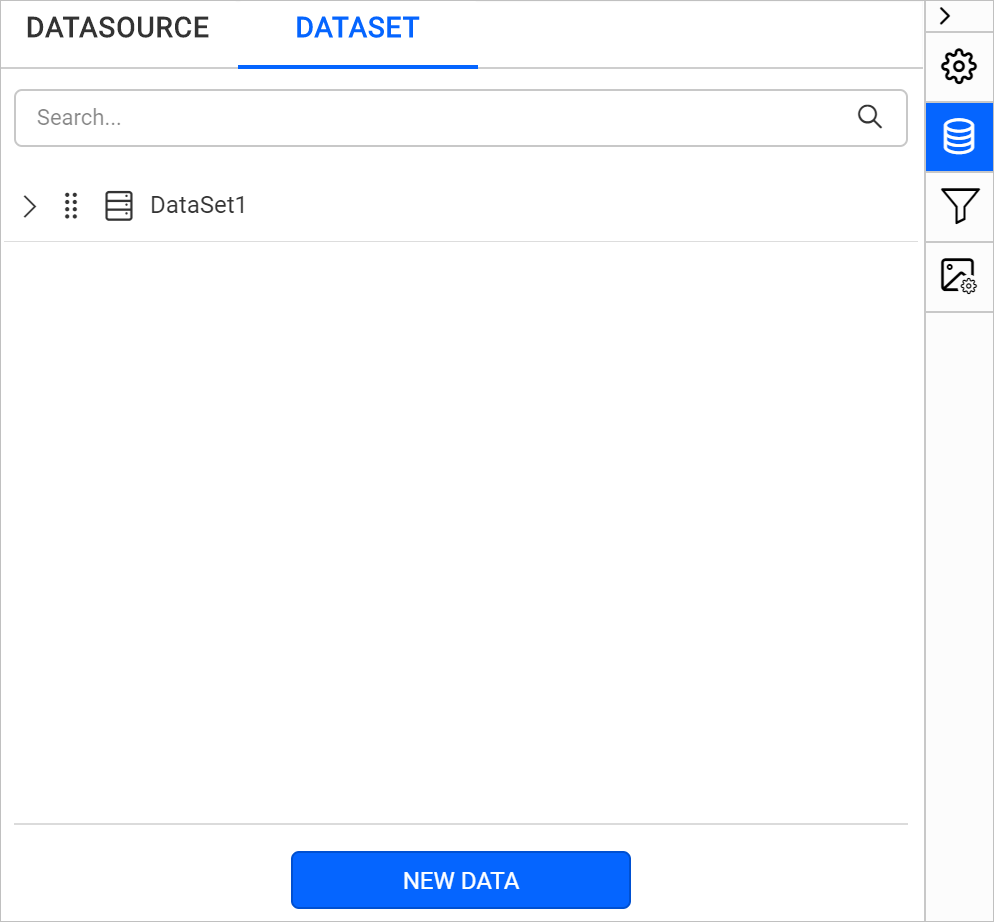
- Expand the icon to view the data fields.
Add table report item
The left pane in the design view consists of basic items, data regions, data visualization, and sub reports to design an interactive report.
Here, the
Tablereport item is used for a demonstration.
- Select the
Tableitem underData Regionsin the item panel, then drag and drop it to the design area.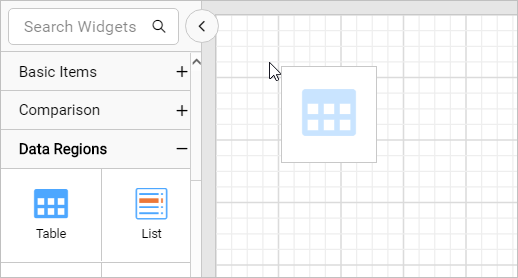
- The above action will render the
Tablewith two rows and three columns in the design area.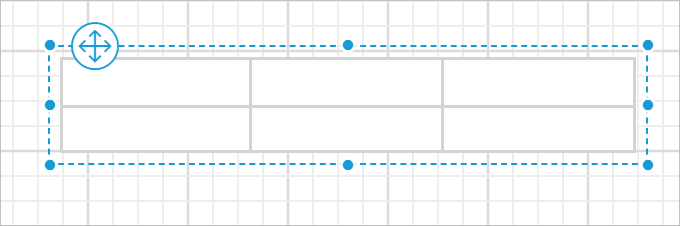
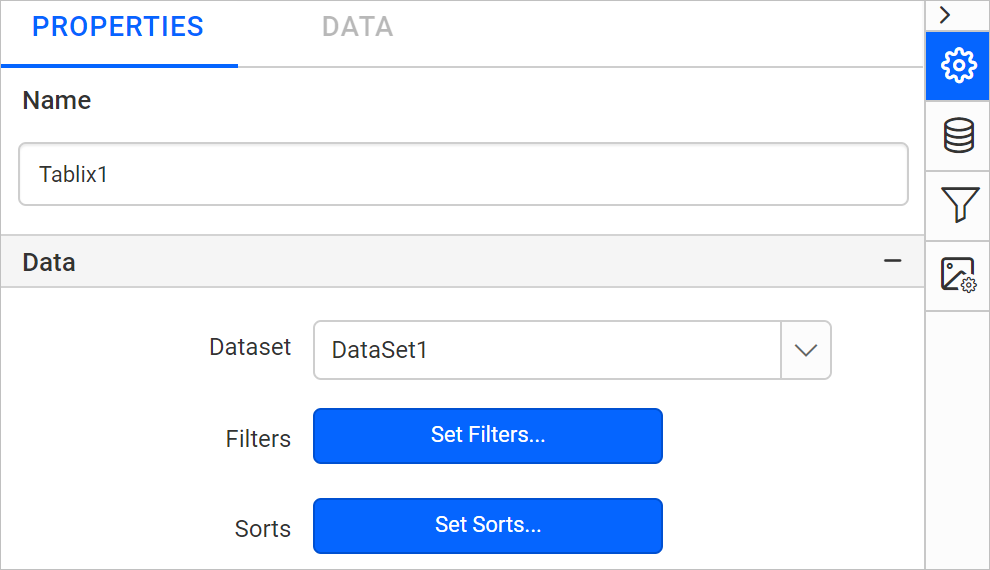
Assign data
This step is applicable only for the report items that belongs to
data visualizationanddata regioncategory.
Assign the dataset to the Dataset property of the table.
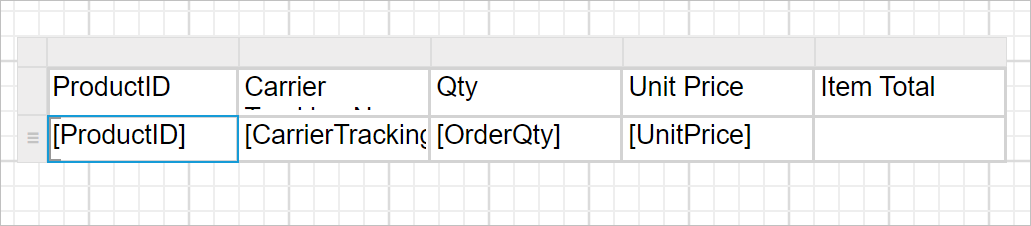
Add column header
- Select the first cell in the table, click the
Text Editoricon to open the dialog, and enterProductIDas the column header text. - To set the column header text as
ProductID, follow the steps outlined in the Set header text using data assign menu section.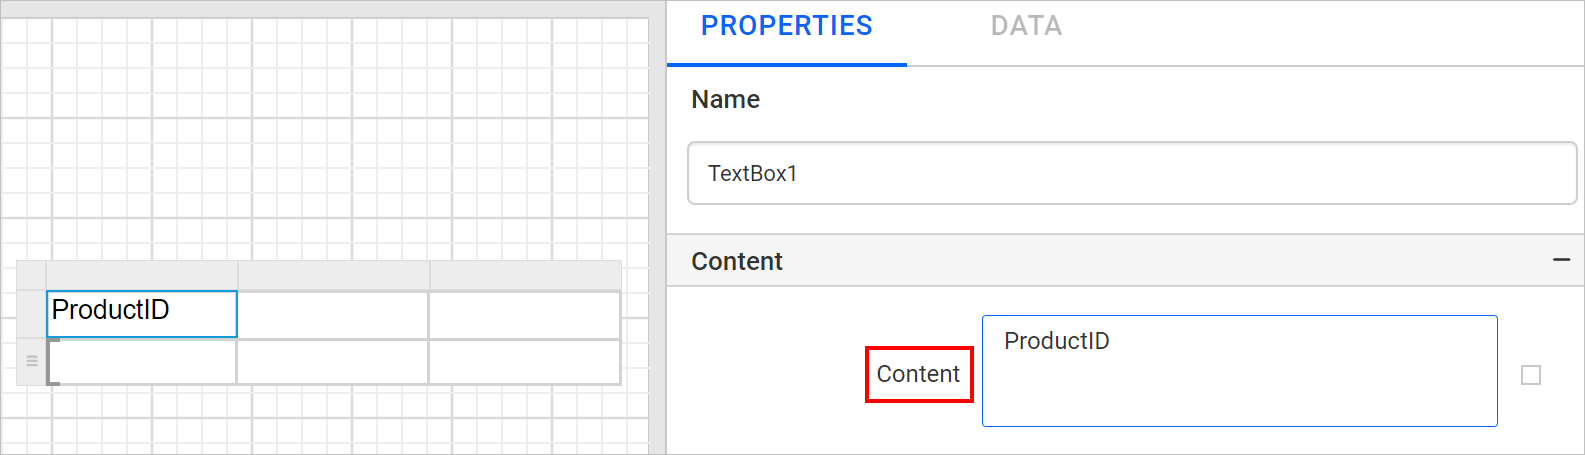
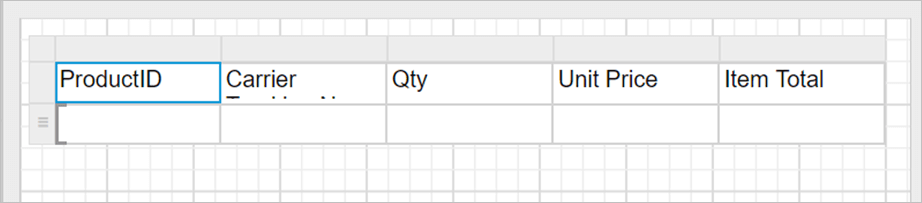
- Similarly, you can add required column header text to other cells in the table.
Assign data fields in table cell
- Select the table cell and click on the
Data assignmenu icon to open data assign menu.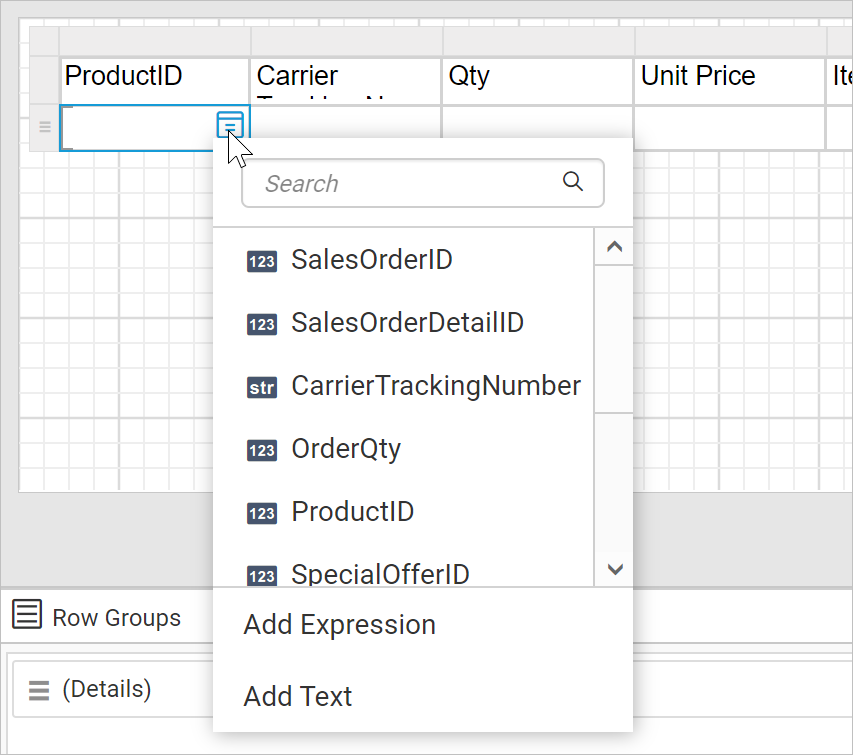
- Assign the
ProductIDfield in the table cell.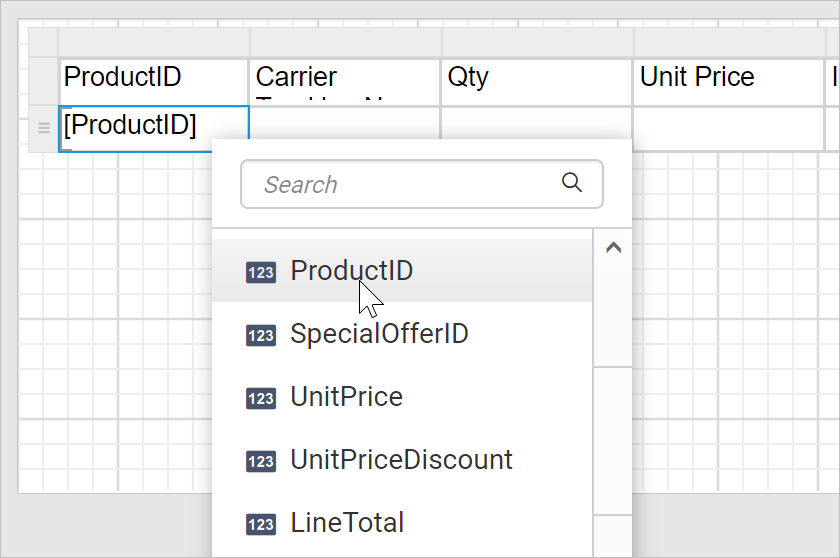
- Similarly, you can assign the required data fields to the table cell.
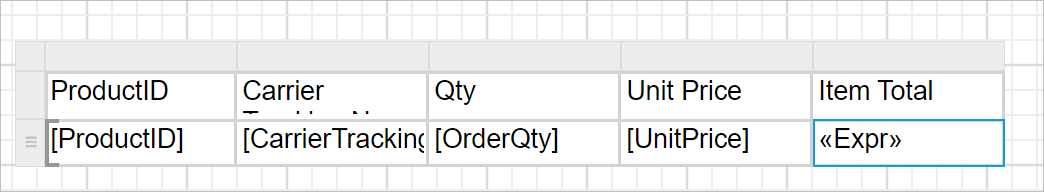
- To add the
=Fields!OrderQty.Value*Round(Fields!UnitPrice.Value,2)expression into a selected Tablix cell, follow the steps outlined in the Set expression using data assign menu section. - Now, the table will look like below,
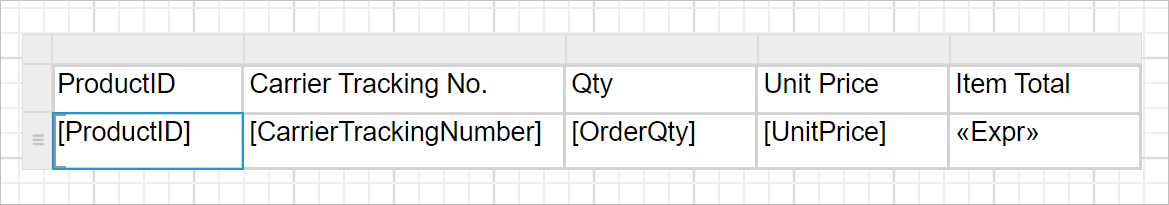
Resize the column
To improve the report readability, we can resize the table row height and column width.
- Place the mouse pointer on the respective column border.
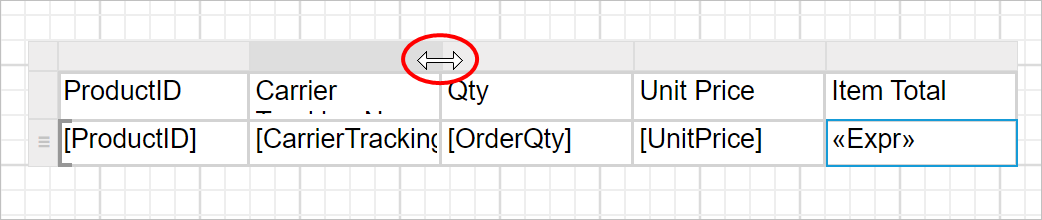
- Drag the column gripper horizontally to adjust the column width.
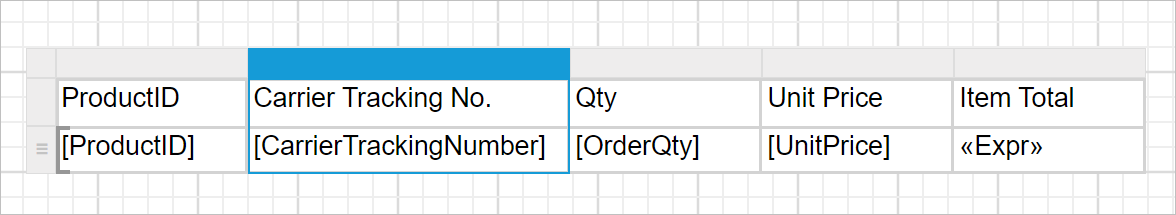
Resize the row
- Place the mouse pointer on the respective row border.
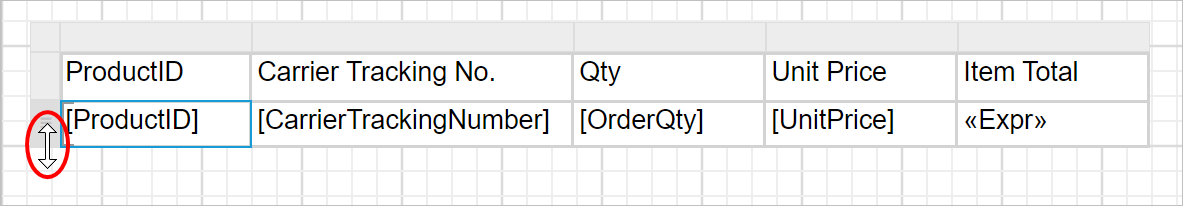
- Drag the row gripper vertically to adjust the row height.
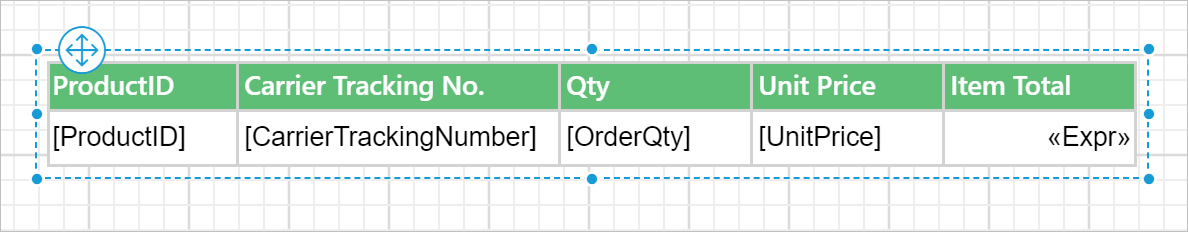
Customize the appearance
Open the PROPERTIES pane. This pane holds some general settings and some specific to the report item. Configure the desired settings on the table for better report design and to improve report readability.
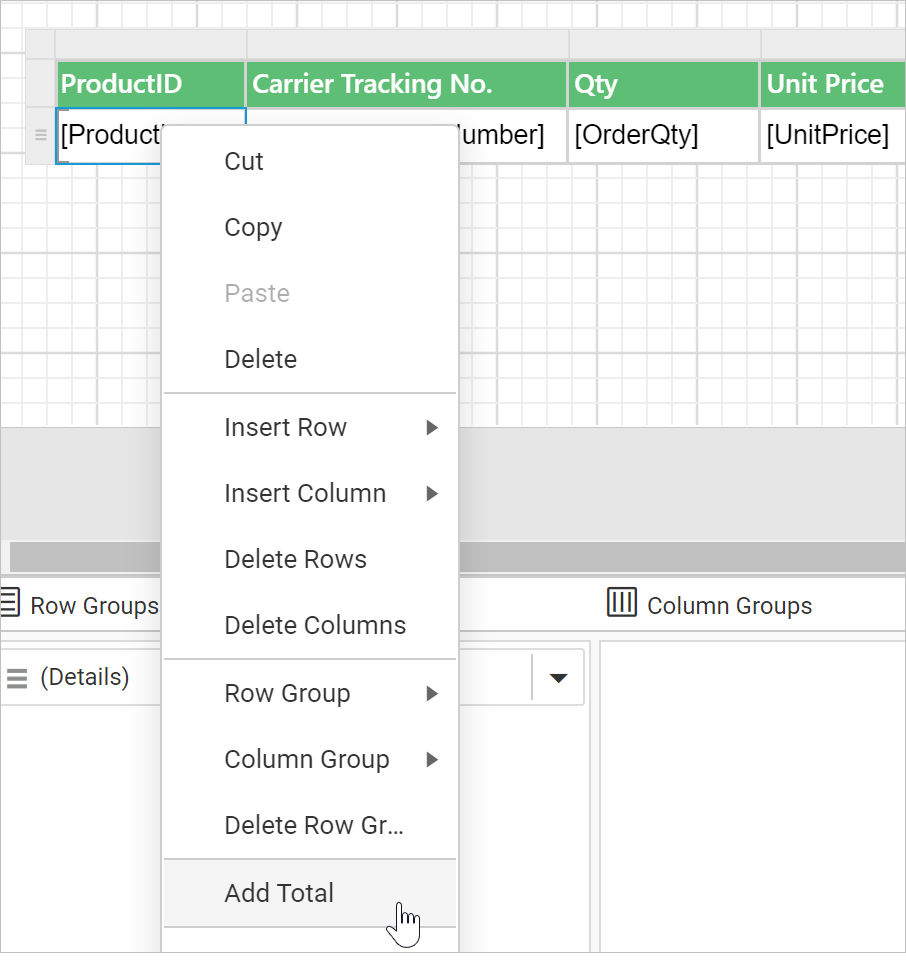
Add total
-
Select the second row, first cell and Right click -> Add Total
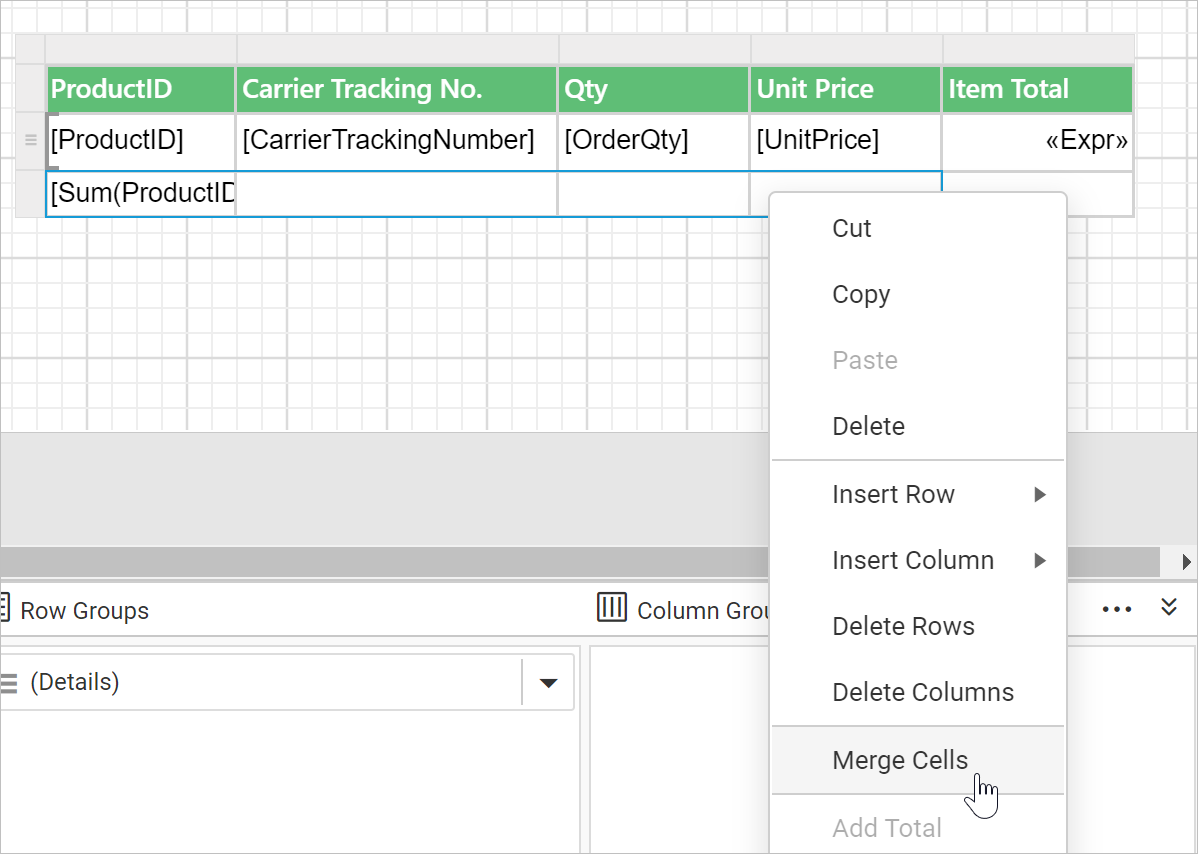
-
Now, select the third row, first four columns and Right click -> Merge cells
-
Modify the cell content to
Totalusing theMulti-Text Run Editordialog, and align the content toRightside.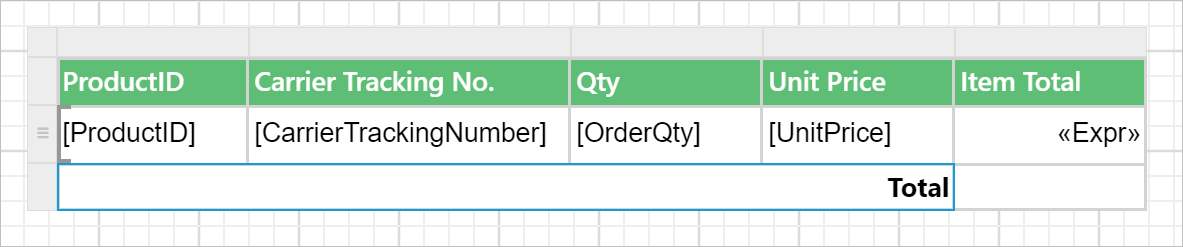
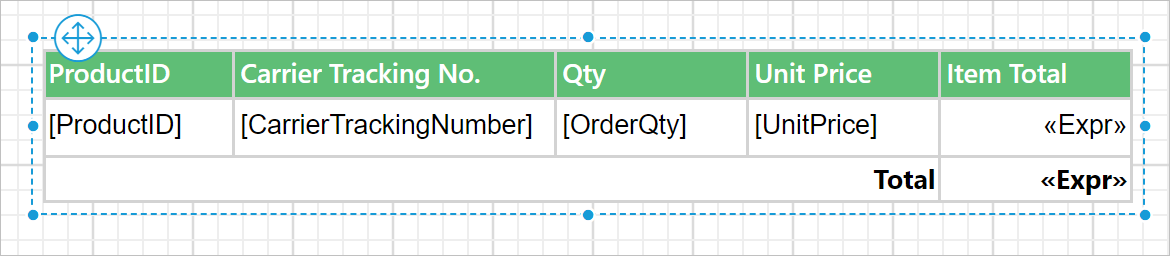
-
Select the last cell in the third row, and to add the expression
=Sum(Fields!OrderQty.Value*Round(Fields!UnitPrice.Value,2)), follow the steps outlined in the Set expression using data assign menu section.
Now, the table design will look like below.
Save report
Once you are done with the report design to save a report, refer to the How to save report section.
Preview report
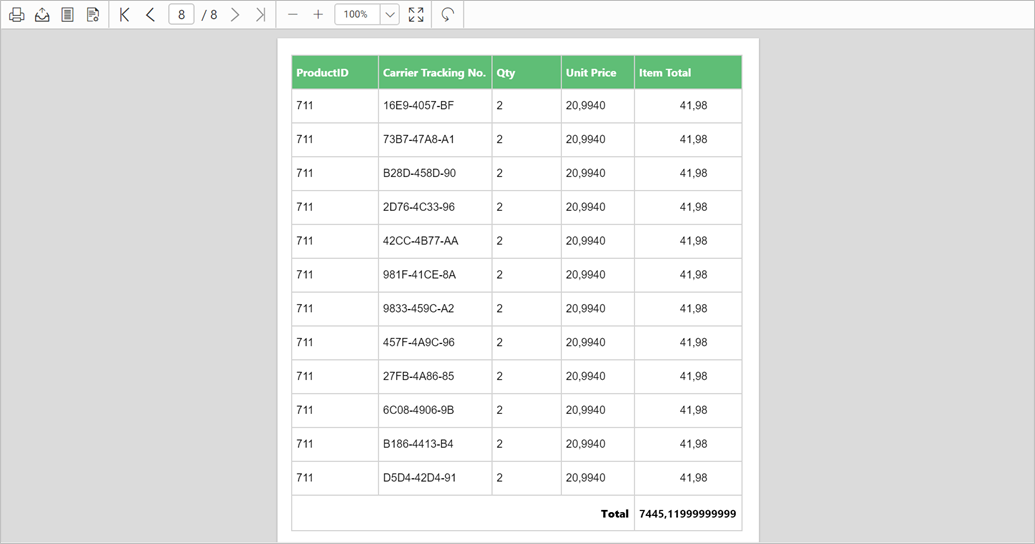
- To see the report preview, click on the Preview button in the tools pane.
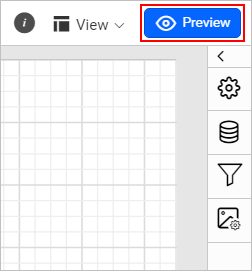
- Now, the report preview can be visualized as shown below.
Download the above report design from the link.