Indicator
Indicator report items are minimal representation of gauge used to visualize the state of a data. It is mostly used in Tablix to visually display the state of the cell data.
Add an indicator to the report
- The indicator report item is listed in the item panel under the
KPIcategory.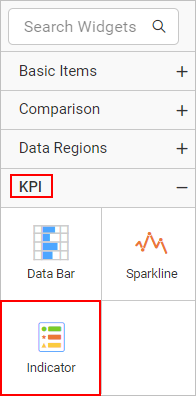
- Drag and drop the indicator report item into the design area from the item panel.
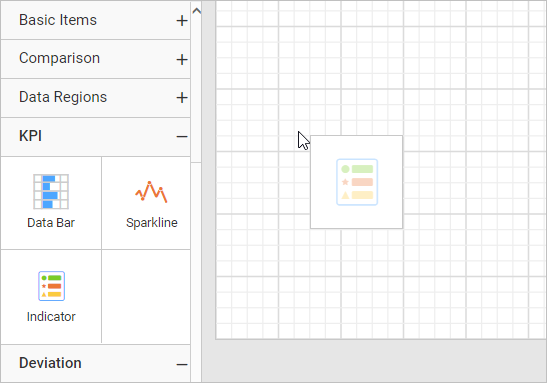
- After dropping the indicator item in the design area, the respective item properties will be listed in the properties panel.
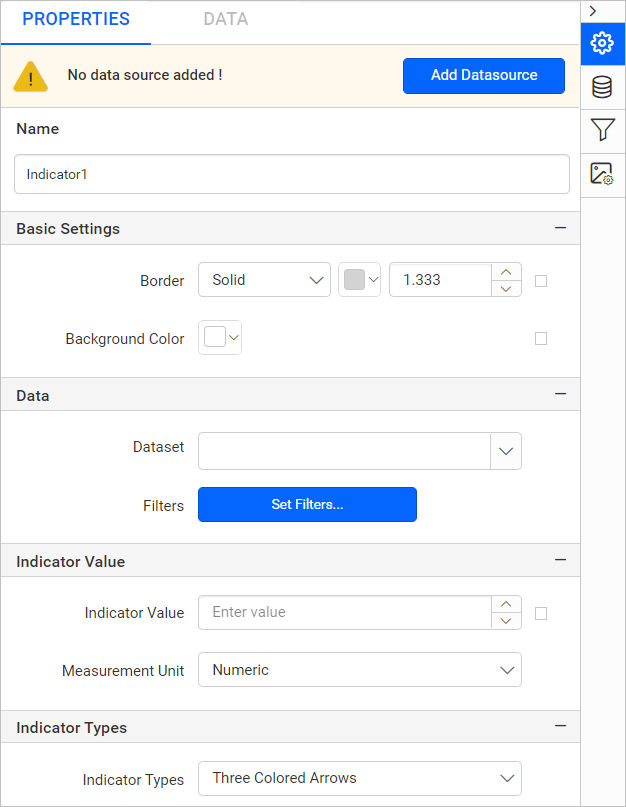
Properties
Refer to the Properties panel section before proceeding with the following properties.
Basic settings
The border style, color, width, and background color properties are used to style the indicator and customize its appearance in the report design. These properties are listed under the Basic settings category in the properties panel.
Border
Border properties are used to add or customize the border around an indicator item to visually separate items in the report design. To set border properties to the indicator item using properties panel, refer to the Border Properties section.
Background color
Using the background color property, you can customize the indicator background color. To set background color using properties panel, refer to the Background color section.
Position
The position property is used to set the width, height, left and top position of the indicator in the report design. To handle these properties using properties panel, refer to the Position section.
Data
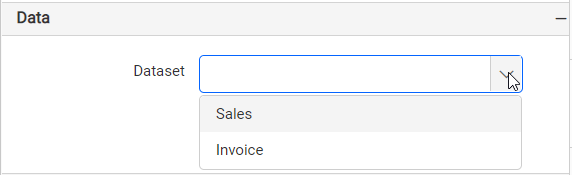
Dataset
This property is used to assign the dataset to the indicator report item. The available datasets in the report will be listed in the Dataset property dropdown. You can choose the desired dataset from the drop-down.
Refer to the Create Data section to add dataset to your report.
Indicator value
This property is used to assign value for indicator states. You can also set the indicator value based on dynamic values using expressions.
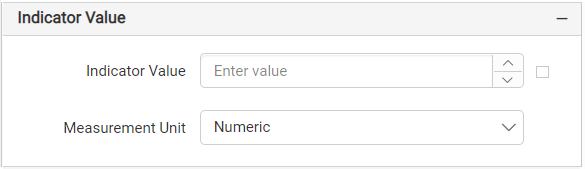
Measurement unit
You can select Percentage or Numeric from the dropdown for indicator value measurement. If You select Percentage option, Minimum and Maximum properties will be visible in the property panel.
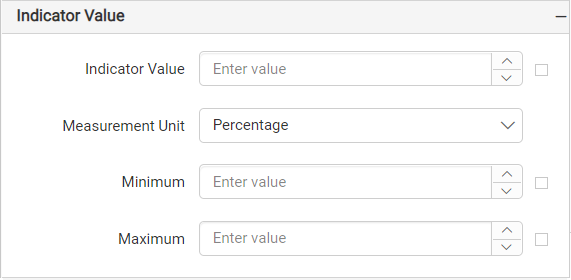
Minimum
The minimum property is used to assign minimum value to the indicator. You can also set the minimum property value based on dynamic values using expressions.
Maximum
The maximum property is used to assign maximum value to the indicator. You can also set the maximum property value based on dynamic values using expressions.
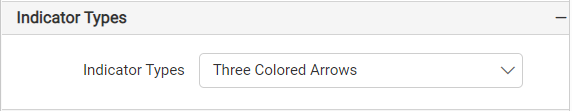
Indicator types
This property is used to select different types of predefined indicator states from the dropdown.
Indicator states
This property is used to customize the states of indicator.
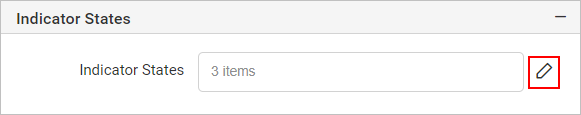
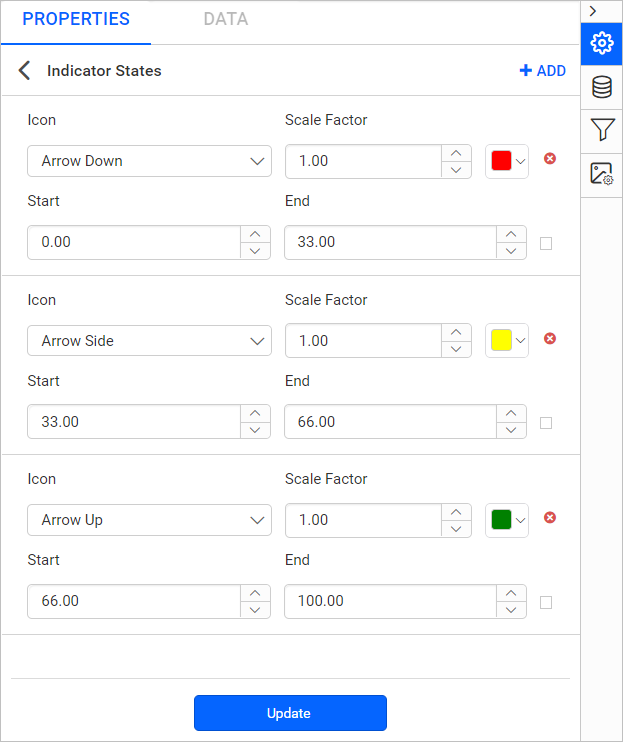
Customizing a state
-
Customizing an icon- You can choose different icon for each state from the dropdown underIconfield. -
Customizing a color- You can choose different color for each state from the color picker underColorfield. -
Customizing start value- You can assign start value for each state from the numeric textbox underStartfield and also set the start value based on dynamic values using expressions. -
Customizing end value- You can assign end value for each state from the numeric textbox underEndfield and also set the end value based on dynamic values using expressions. -
Customizing scale factor value- You can assign scale factor value for each state from the numeric textbox underScale Factorfield and also set the scale factor value based on dynamic values using expressions.
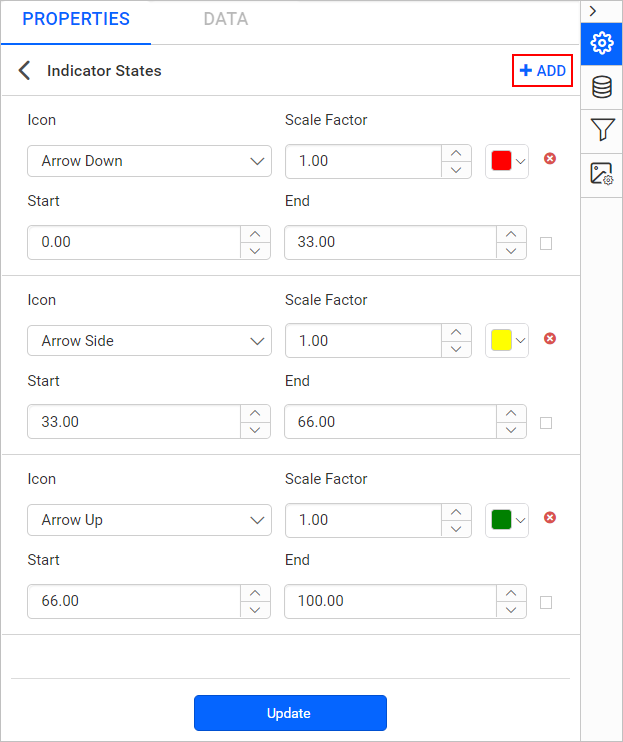
Adding a new state
You can add a new state by clicking the Add icon. The new state will be created with the following values
- Icon - Circle
- color - No Color
- Start - ”
- End - ”
- Scale Factor - 1
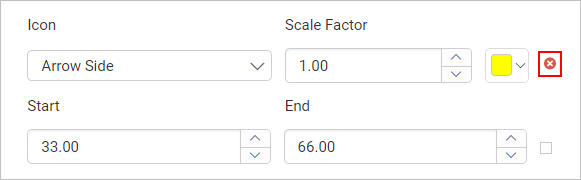
Deleting a state
You can delete a state by clicking the delete icon.
Data Element
Data element can be used to control visibility of a report item when exporting the report in XML format. The Data element properties are listed in the properties panel, under the Data Element category.
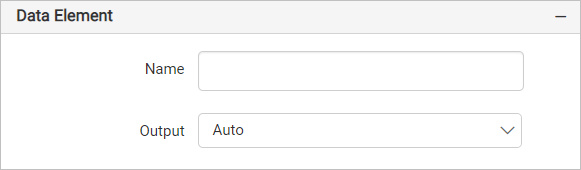
Name
You can assign a custom name for the indicator element using the Name field. The indicator will be exported with the provided name.
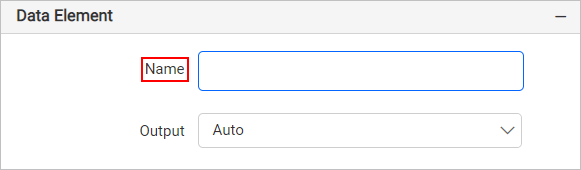
Note: The name cannot contain spaces, and it must begin with a letter followed by letters, numbers, or the underscore character (_).
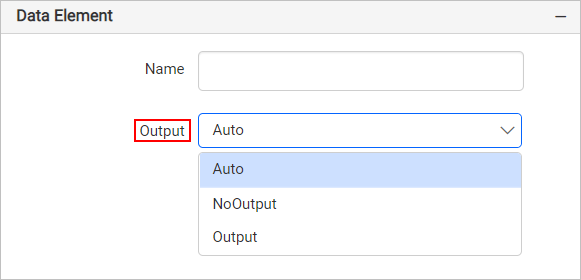
Output
On exporting the report, the visibility of the indicator can be controlled using the Output property. Choosing the following options for the Output property will perform the respective operations:
- Auto or Output - Exports the indicator report item
- NoOutput - Does not export the indicator report item
Visibility
The visibility property is used to conditionally show or hide the indicator report item on report preview or export action. To set visibility of indicator item using properties panel, refer to the Visibility section.
Miscellaneous
Page name
The page name property is used to name the first worksheet of the Excel workbook, when exporting the report to excel format.
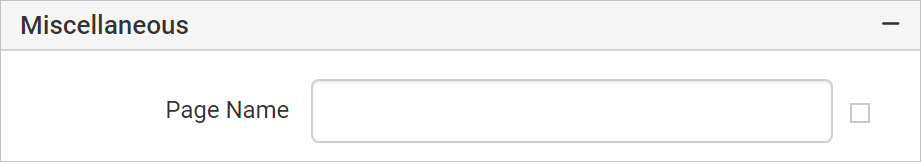
You can set the static or dynamic text as page name. To set and reset dynamic text, refer Set Expression and Reset Expression section.
Custom attributes
This property can be used to set the values for indicator custom properties. To create and assign values for custom properties using properties panel refer Custom Properties section.
Document Map
A document map is a navigational feature that displays a separate side pane with set of navigational links in hierarchical structure when you view a report. A user can click the content in the list, to navigate to the report page that displays that item. Refer Document Map section to configure document map in the report design.
You can set the static or dynamic text as value for document map property. To set and reset dynamic text, refer Set Expression and Reset Expression section.
Bookmark
Bookmark links allows the users to navigate to different parts of a SSRS report. You can add bookmarks to each textbox, image, table or chart or to the unique group values displayed in a tablix which can direct the users to specified locations in the report. The value of bookmark property can be your own strings or an expression. Refer Bookmark section to configure bookmark in the report design.
You can set the static or dynamic text as value for bookmark property. To set and reset dynamic text, refer Set Expression and Reset Expression section.
Tooltip
Tooltip property can be used to display informative text or value, when the user hovers over on the report item in report preview. To set tooltip for indicator report item using properties panel refer Tooltip section.
Set expression
An expression can be set to few properties of the indicator report item to process the property values based on expressions. To set expressions to the indicator report item properties, refer to the Set Expression section.
Reset expression
To Reset the expression applied to a property, refer to the Reset Expression section.
Advanced properties
A few properties of the indicator report contain nested properties. To open and handle the nested properties, refer to the Advanced Properties section.
- Add an indicator to the report
- Properties
- Basic settings
- Border
- Background color
- Position
- Data
- Dataset
- Indicator value
- Measurement unit
- Minimum
- Maximum
- Indicator types
- Indicator states
- Customizing a state
- Adding a new state
- Deleting a state
- Data Element
- Visibility
- Miscellaneous
- Page name
- Custom attributes
- Document Map
- Bookmark
- Tooltip
- Set expression
- Reset expression
- Advanced properties