Create a RDLC report
Report Definition Language Client-side, is the extension of the report file. The RDLC files does not require the SQL Server Reporting Services to process the reports.
This section describes step by step procedure to create an RDLC report in JavaScript Report Designer.
Create an application
Create a Web Report Designer javascript application, by following the steps provided in Add Web Report Designer to a javascript application section.
Set report type property
On report designer control initialization, set the reportType property as RDLC.
Add the following code in the <body> tag of the web Report Designer HTML page.
<!-- Creating a div tag which will act as a container for ejReportDesigner widget.-->
<div style="height: 600px; width: 950px; min-height: 400px;" id="designer"></div>
<script type="text/javascript">
$(function () {
$("#designer").ejReportDesigner({
serviceUrl: "/api/ReportingAPI",
reportType: ej.ReportDesigner.ReportType.RDLC
});
});
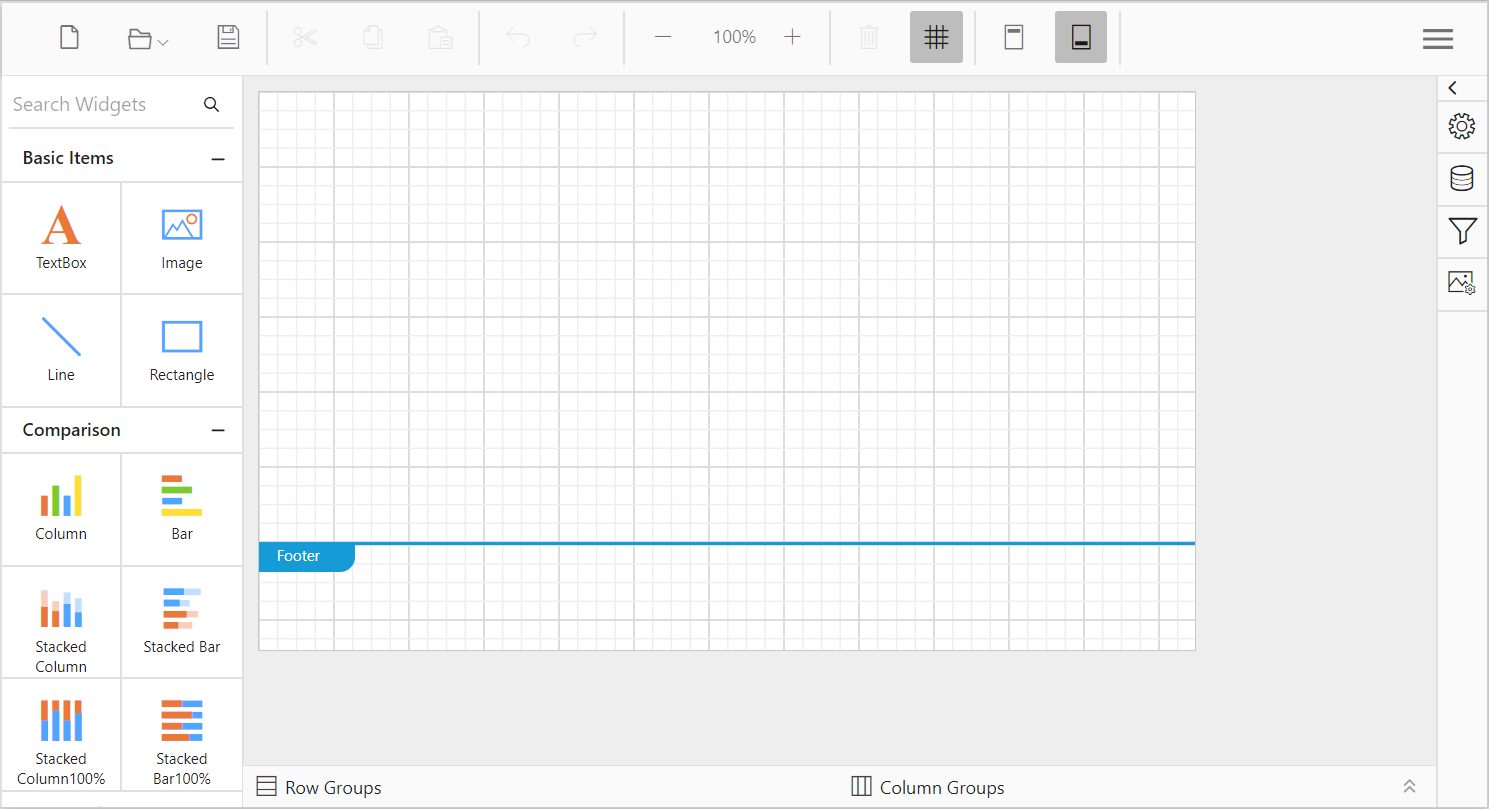
</script>When you run the application the report designer will be rendered like below.
Create data
- Click the
Dataicon in the configuration panel to open aDataconfiguration panel.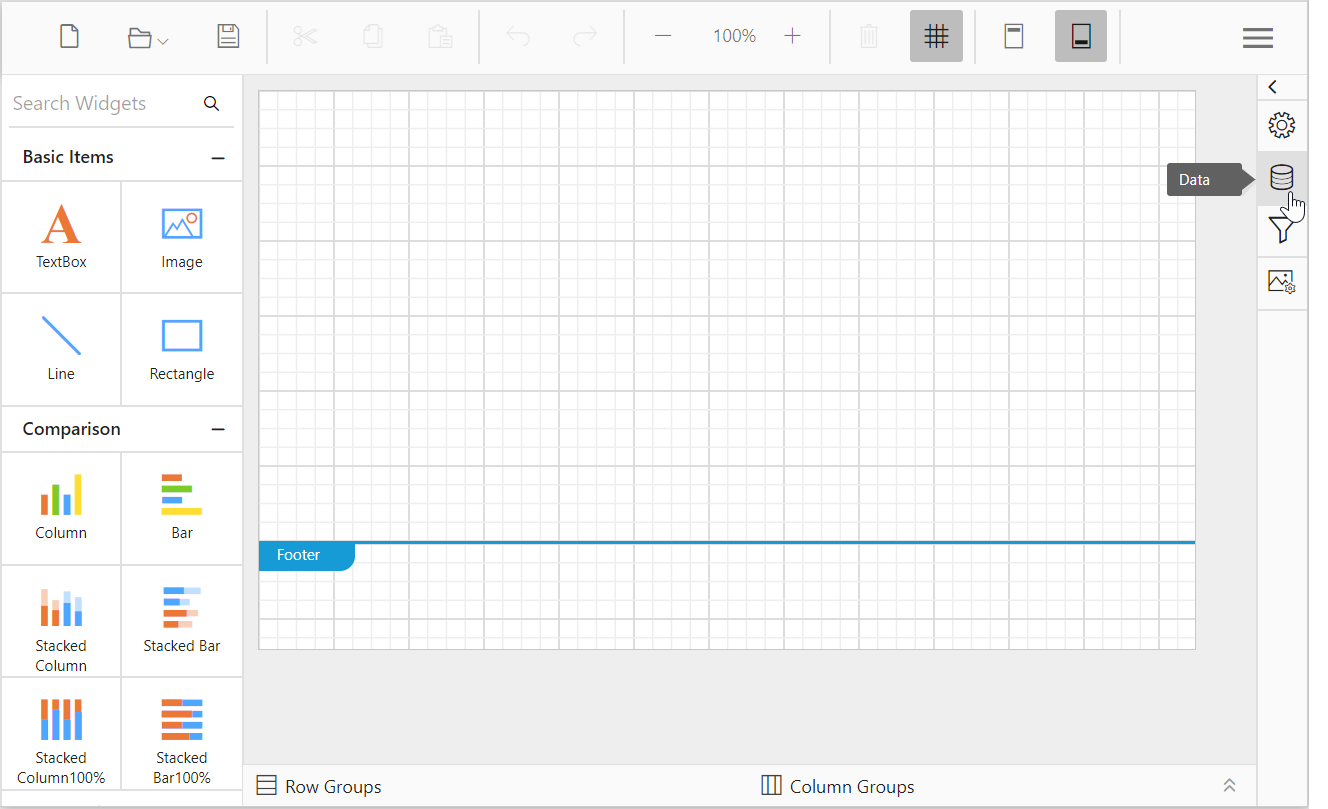
- Click on the
NEW DATAbutton inDATApanel.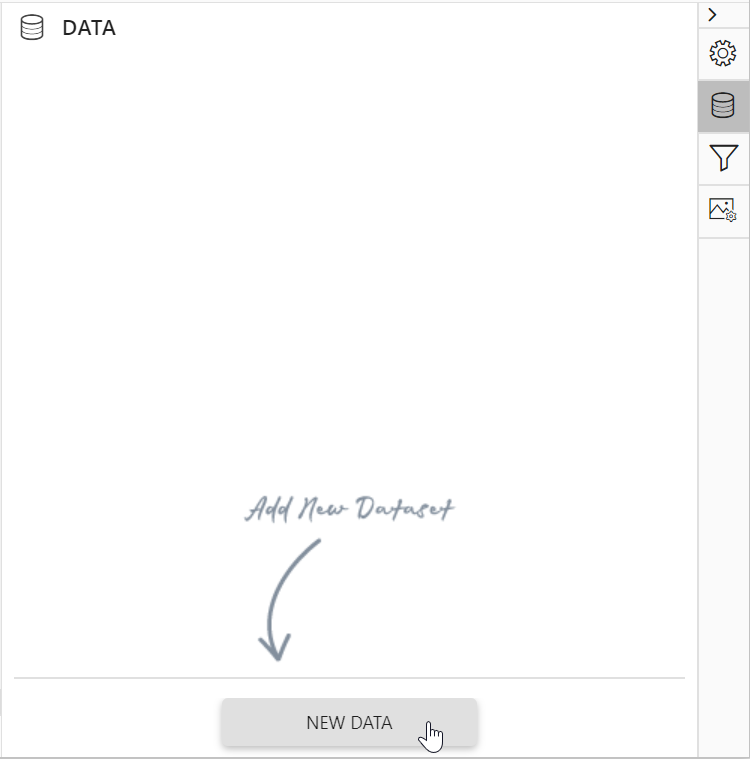
- Now, the
Data Fieldsdialog will be opened like below.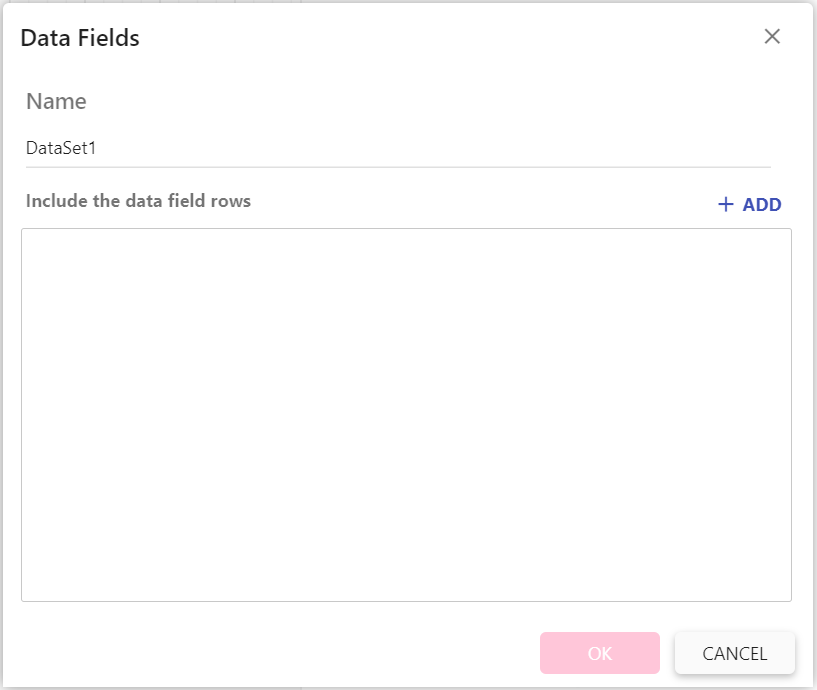
- Edit the name of the
Datain the Name field, if required. - To create fields for the dataset, click on the
ADDbutton.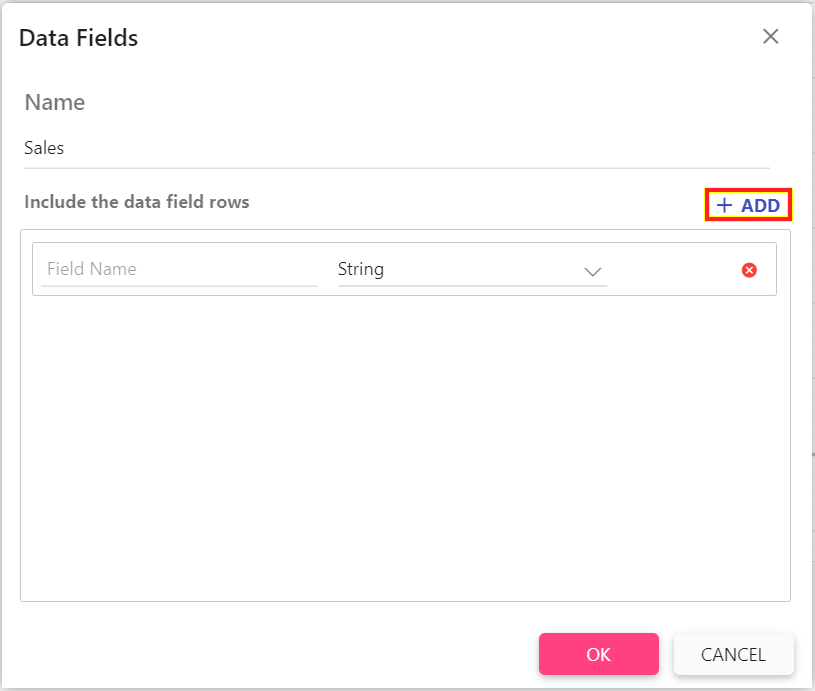
- Provide the
Field Namein the first drop-down list. - In the second drop-down list, choose the datatype for the respective field.
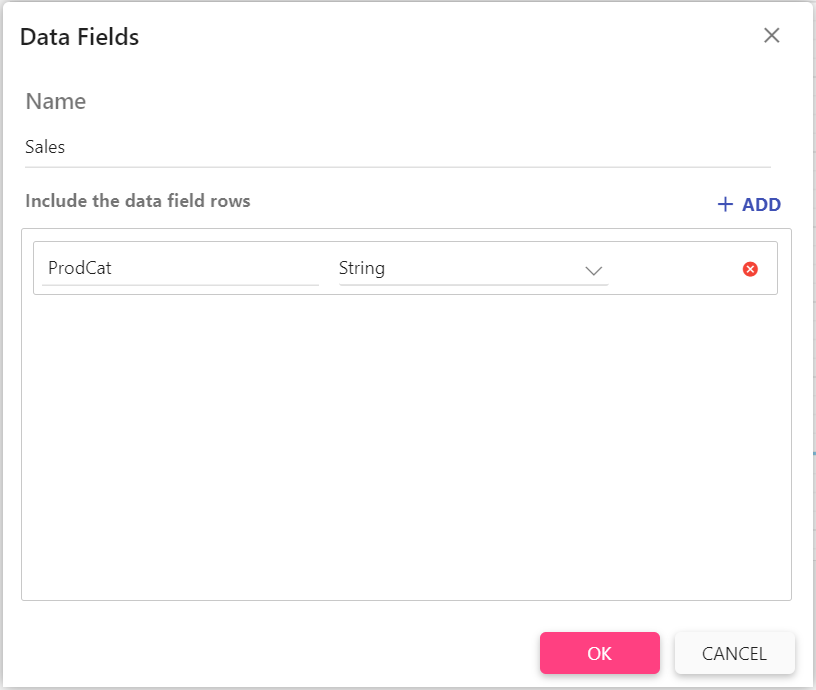
- Similarly, you can create multiple fields for the dataset.
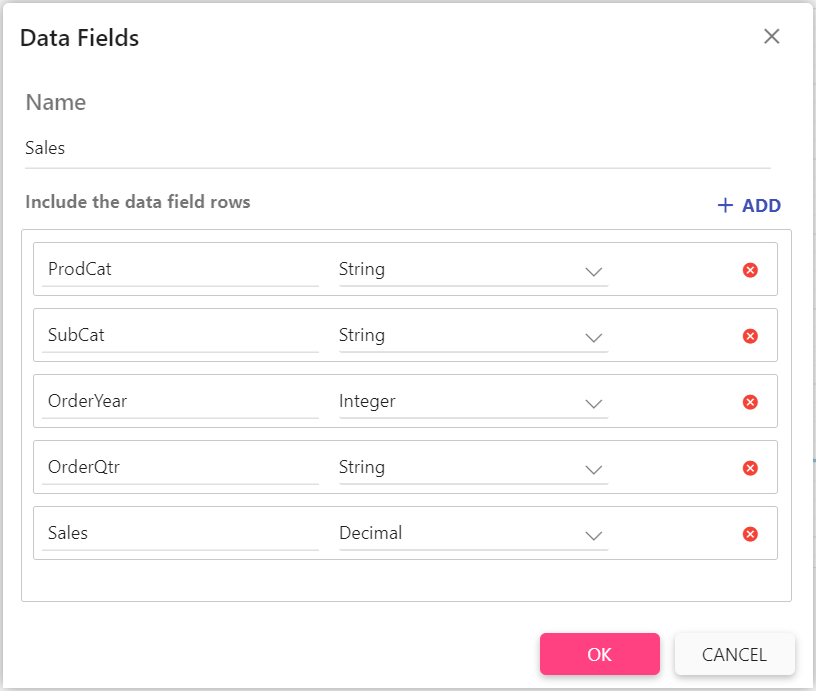
- Click on the
OKbutton. Now, the dataset will be listed under theDATApane like below.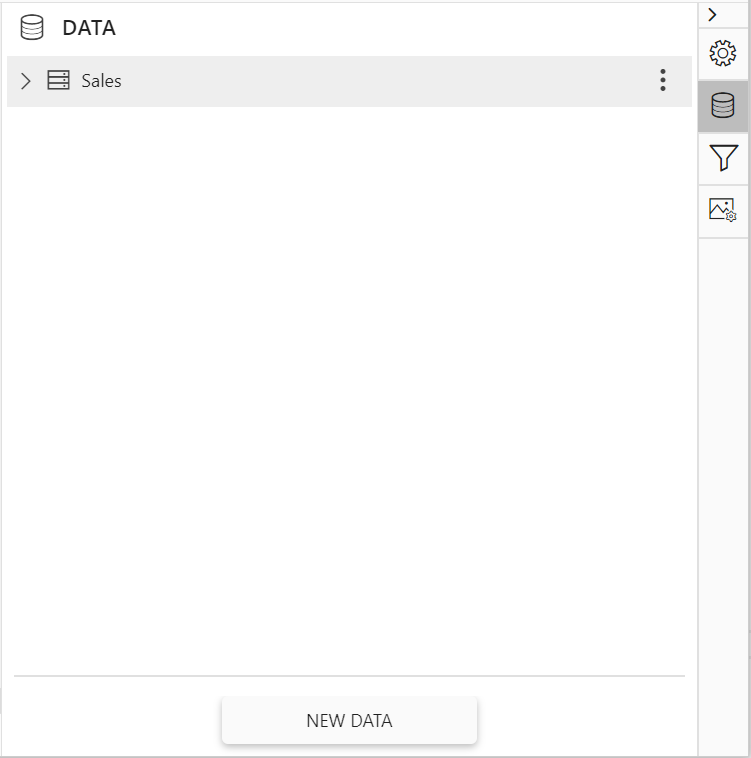
Assign data
- Drag and drop a chart report item to the design area.
- Switch to the
DATAtab in the properties panel.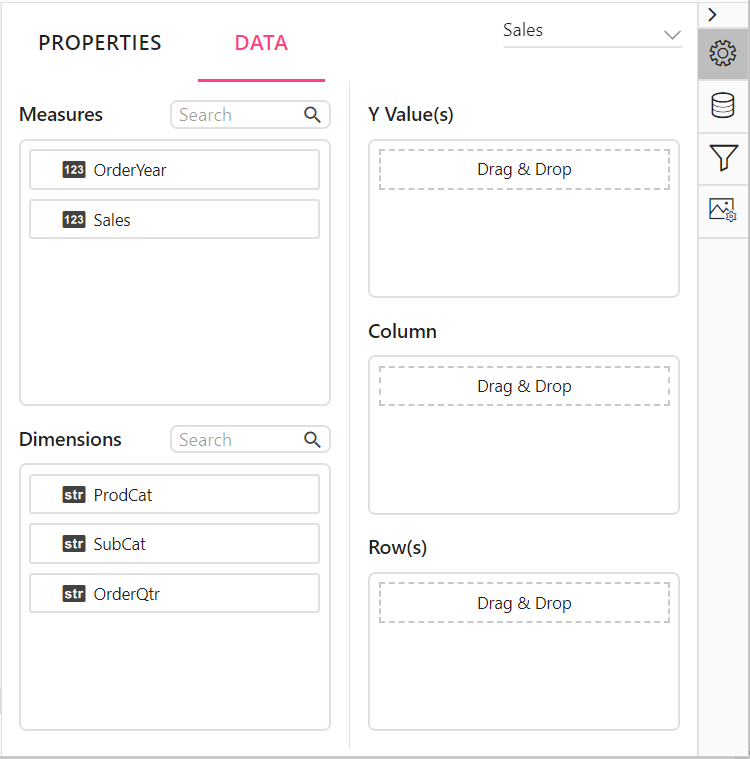
- Select and drag the numeric column (measure element) or the numeric expression column from the
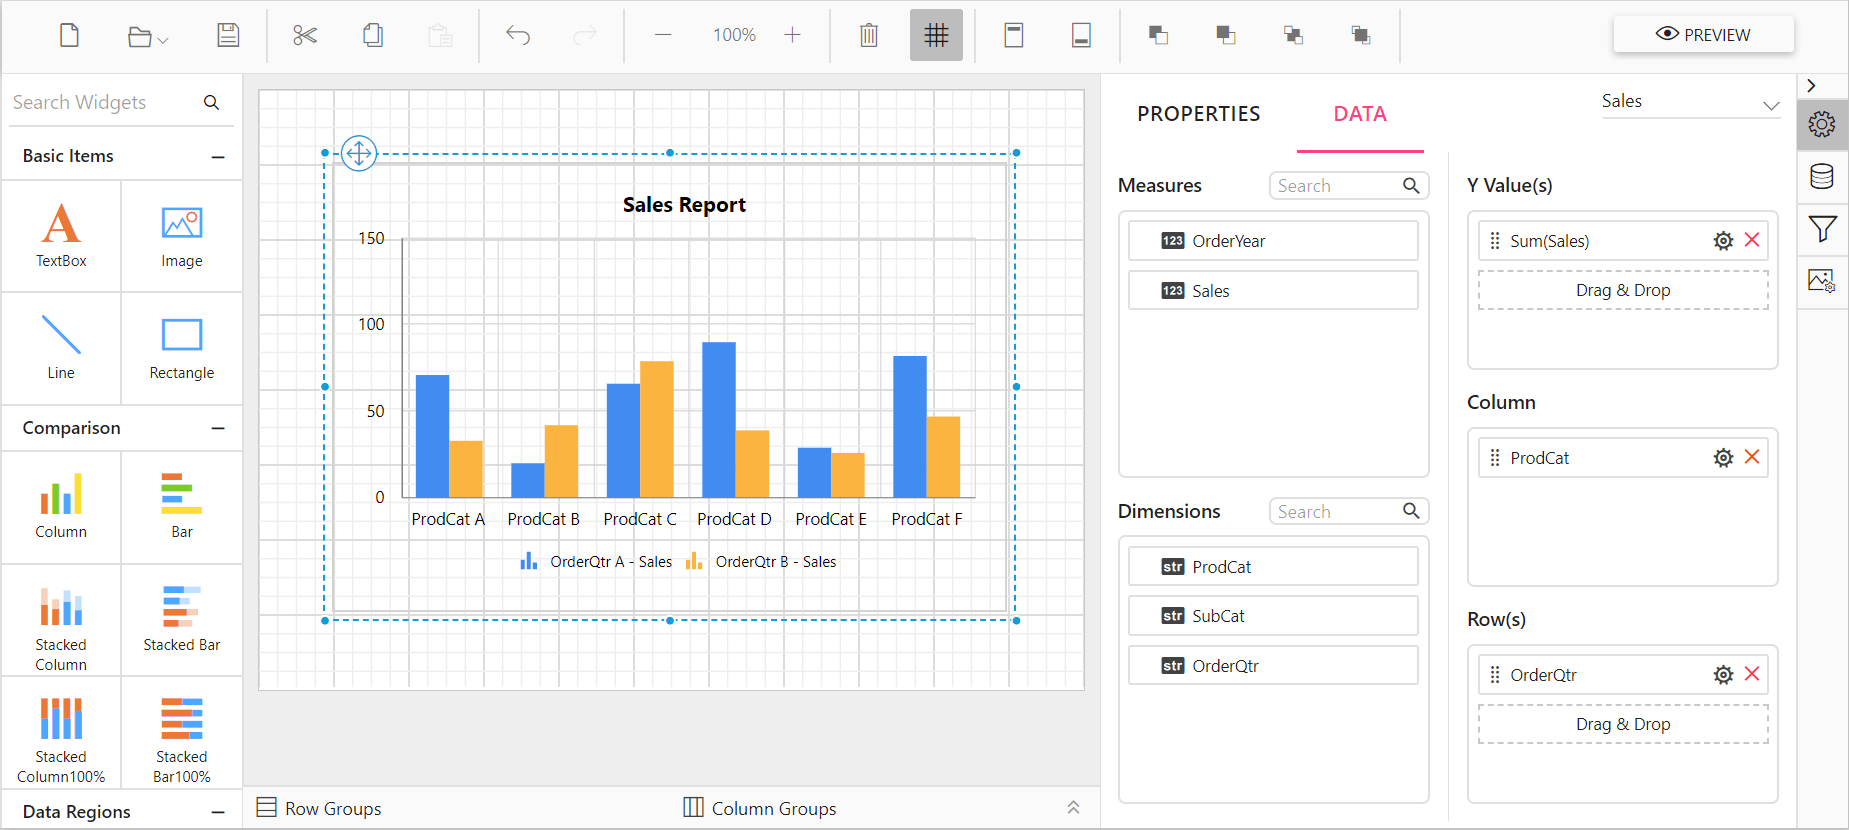
Measuresection and drop it in theY Valuessection. - Select and drag the dimension element from the
Dimensionssection to measure against any of the selected numeric column(s) inY Value(s)section, and drop into theColumn(s)section.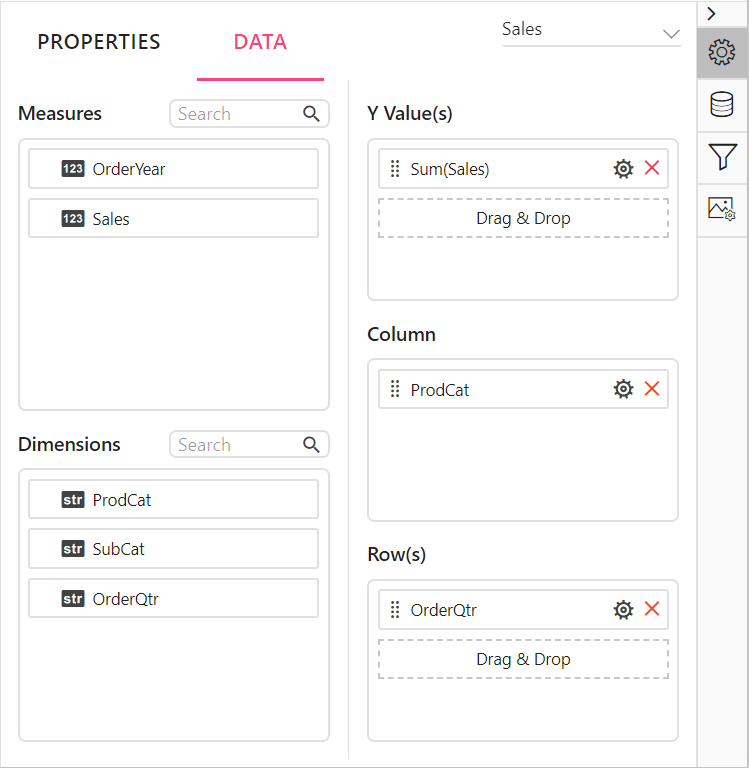
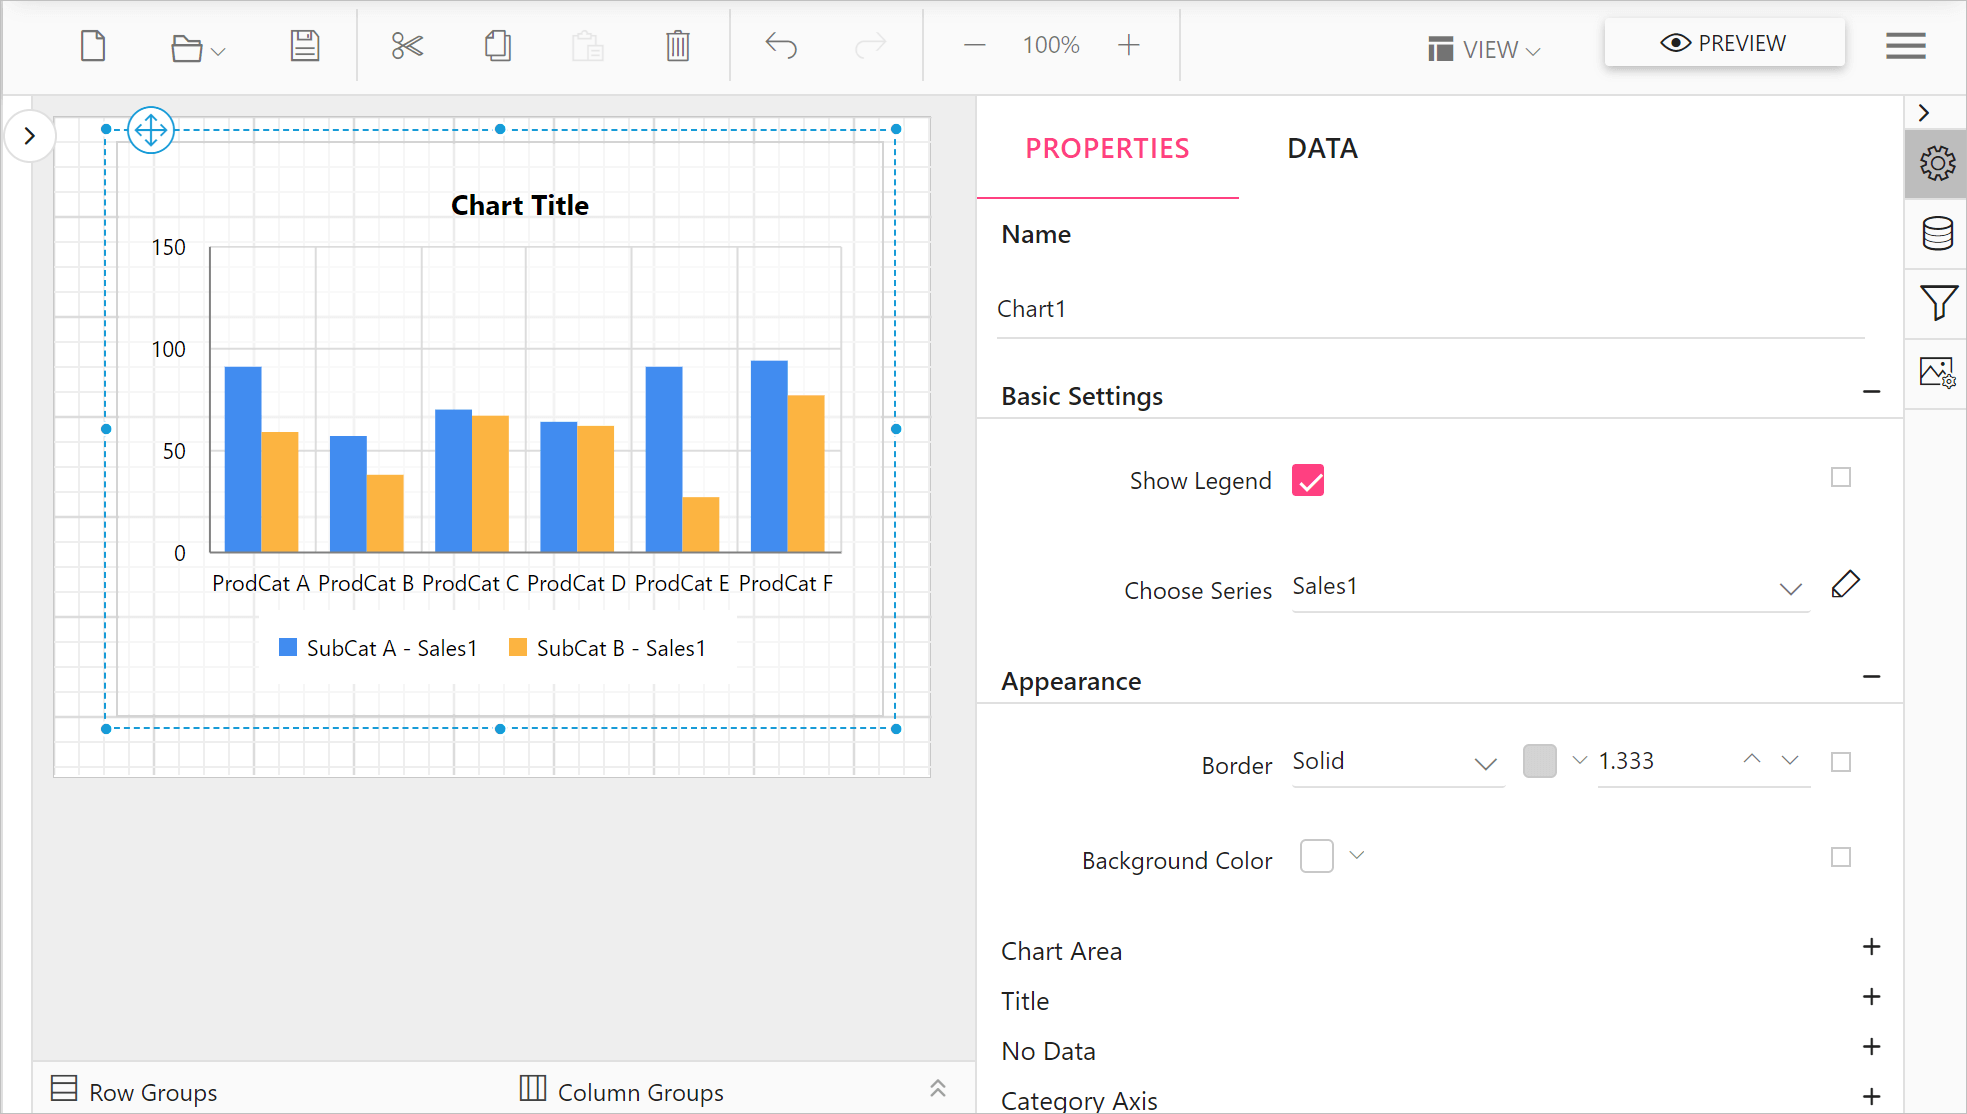
- Now, the final design will look like below.
Preview report
-
Click on the
Previewbutton in the toolbar. Now, the following view will be displayed.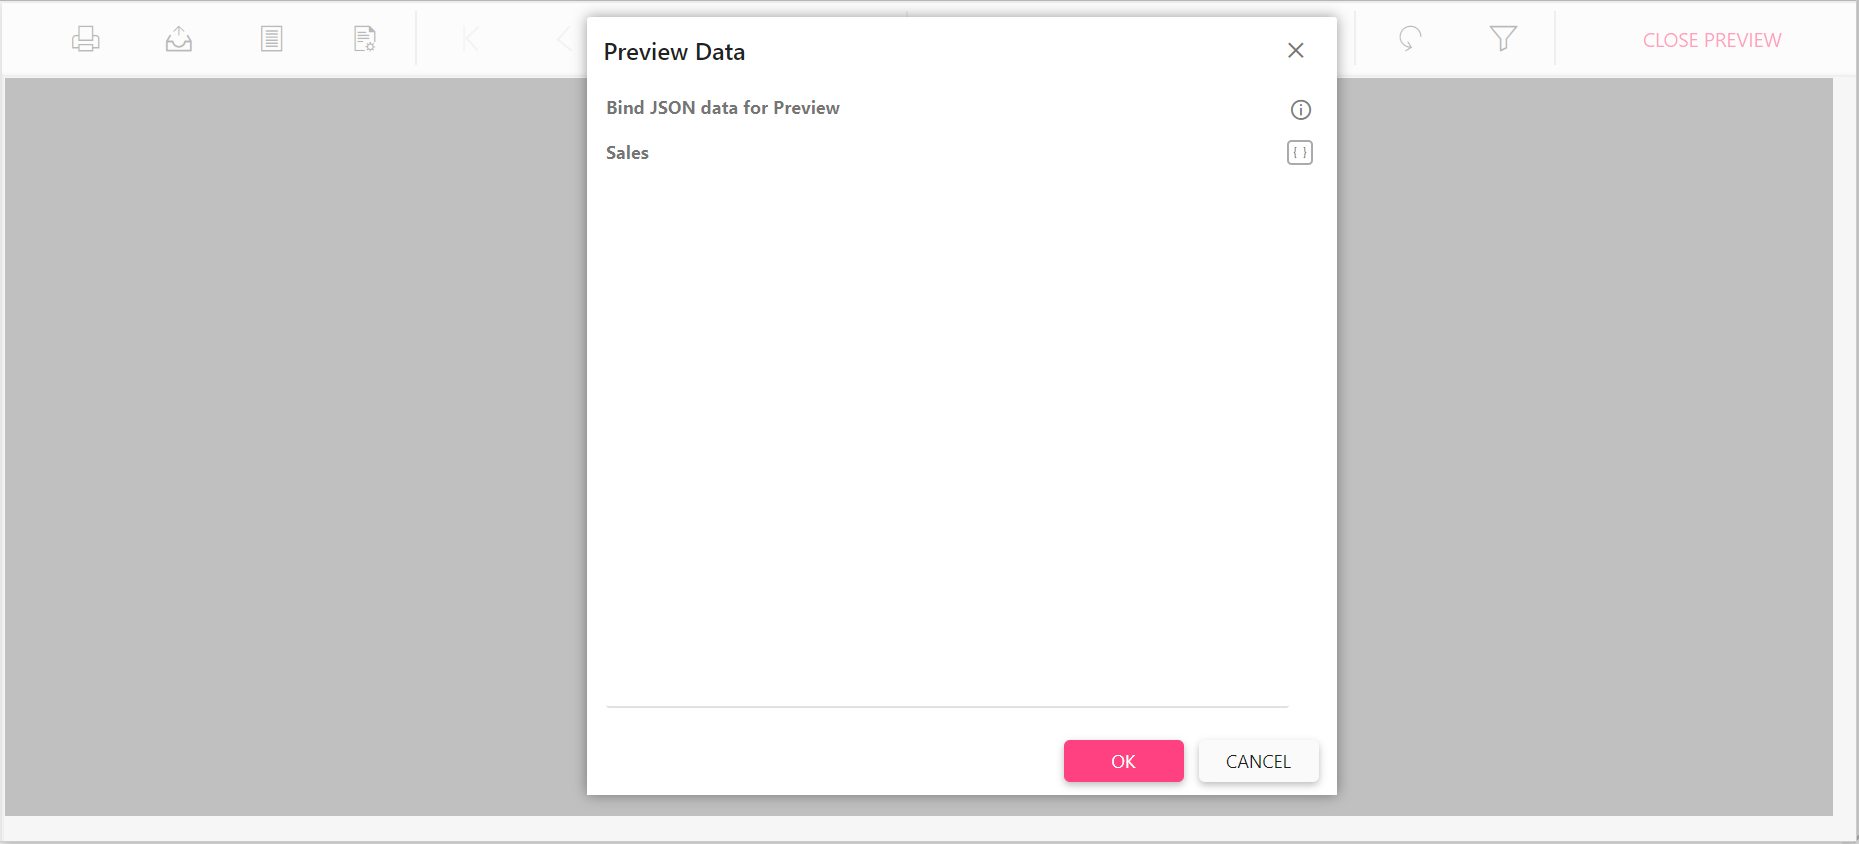
-
To bind data to the widgets, provide valid JSON array collection as shown in following sample code.
[{
"ProdCat": "Accessories", "SubCat": "Helmets", "OrderYear": "2002", "OrderQtr": "Q1", "Sales": 4945.6925
},
{
"ProdCat": "Components", "SubCat": "Road Frames", "OrderYear": "2002", "OrderQtr": "Q3", "Sales": 957715.1942
},
{
"ProdCat": "Components", "SubCat": "Forks", "OrderYear": "2002", "OrderQtr": "Q4", "Sales": 23543.1060
},
{
"ProdCat": "Bikes", "SubCat": "Road Bikes", "OrderYear": "2002", "OrderQtr": "Q1", "Sales": 3171787.6112
},
{
"ProdCat": "Accessories", "SubCat": "Helmets", "OrderYear": "2002", "OrderQtr": "Q3", "Sales": 33853.1033
},
{
"ProdCat": "Components", "SubCat": "Wheels", "OrderYear": "2002", "OrderQtr": "Q4", "Sales": 163921.8870
},
{
    "ProdCat": "Bikes", "SubCat": "Road Bikes", "OrderYear": "2003", "OrderQtr": "Q2", "Sales": 4119658.6506
},
{
    "ProdCat": "Clothing", "SubCat": "Socks", "OrderYear": "2003", "OrderQtr": "Q3", "Sales": 6968.6884
},
{
    "ProdCat": "Bikes", "SubCat": "Road Bikes", "OrderYear": "2003", "OrderQtr": "Q4", "Sales": 3734891.6389
},
{
    "ProdCat": "Components", "SubCat": "Mountain Frames", "OrderYear": "2002", "OrderQtr": "Q3", "Sales": 608352.8754
}]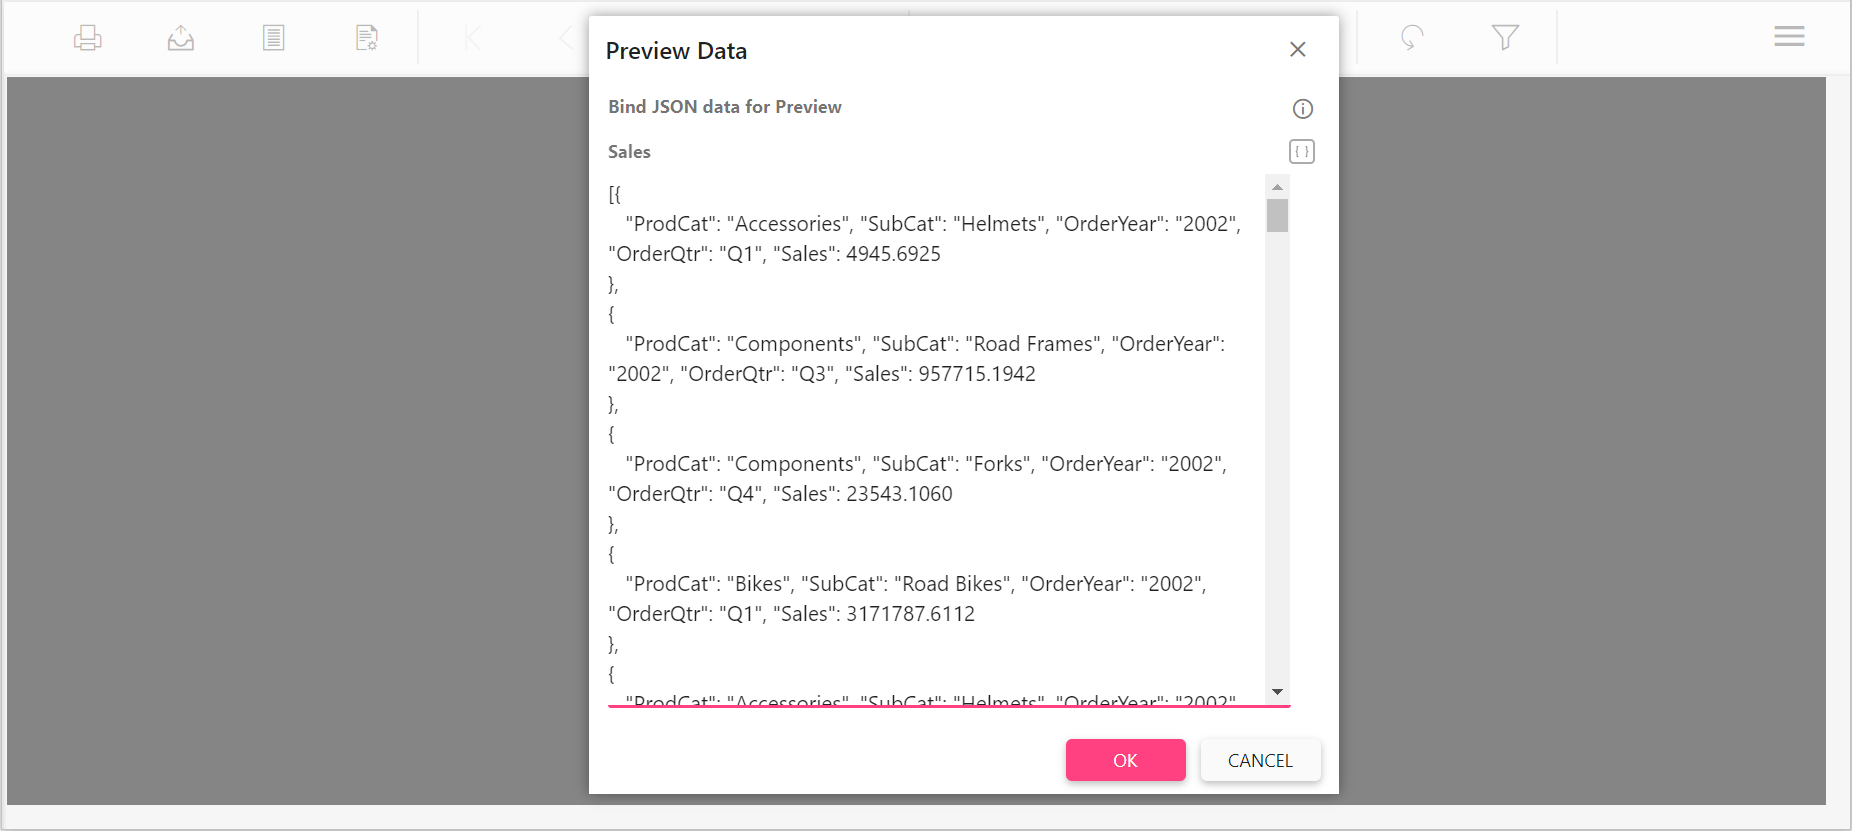
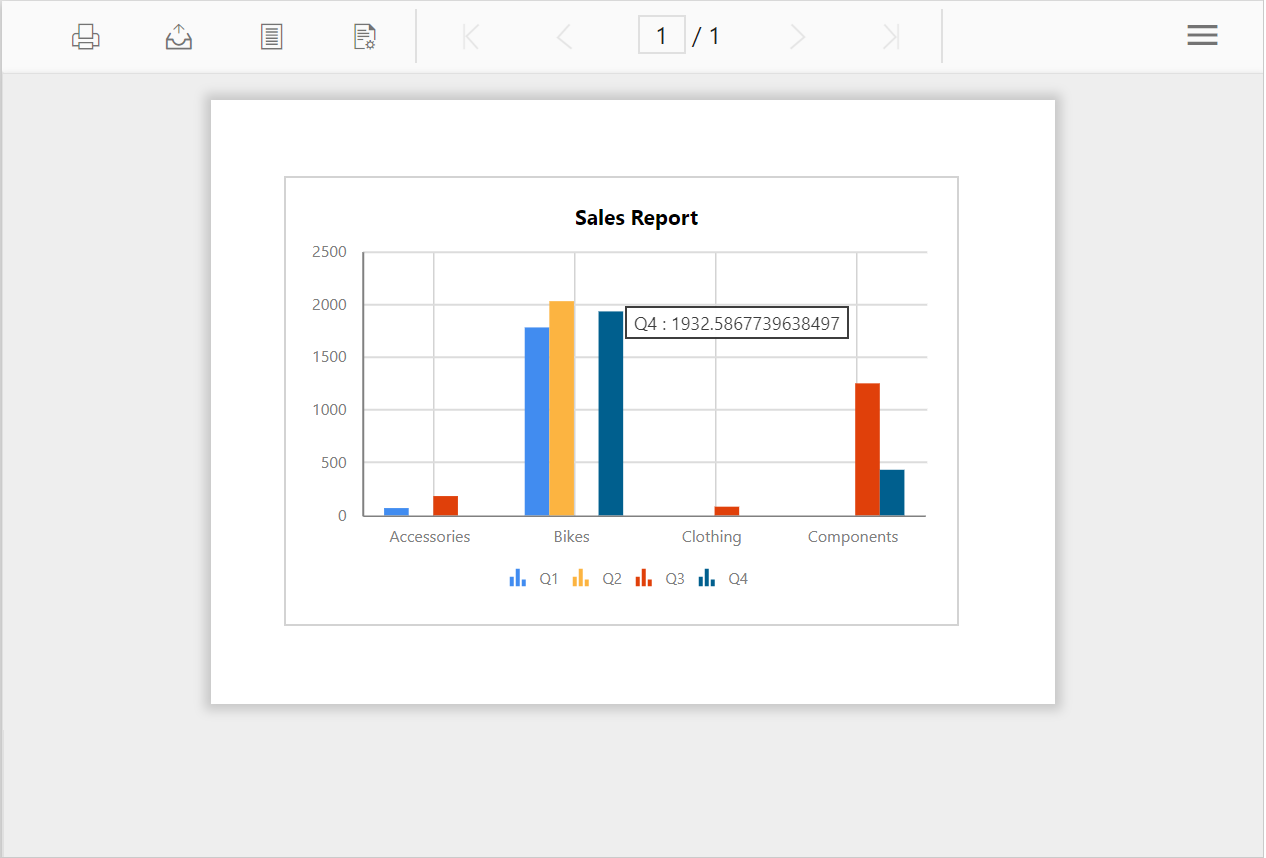
-
Now, the report preview will be displayed like below.