How to filter data based on user in a report
On an on-premise server, we can filter and display data based on the user who runs the report. In this section, we explain how to design a report in Bold Reports® Designer that displays the sales history of the salesperson running the report. Follow the step-by-step procedure to design such a report. First, we need to connect to the data and present it in a table format using the table report item.
Connecting to Data
To showcase the sales history, we have prepared sample data by creating a temporary table using SQL query in the query designer. You can also connect to your data from any of your server or local database.
- Click the
Dataicon in the configuration panel to launch theDataconfiguration pane.
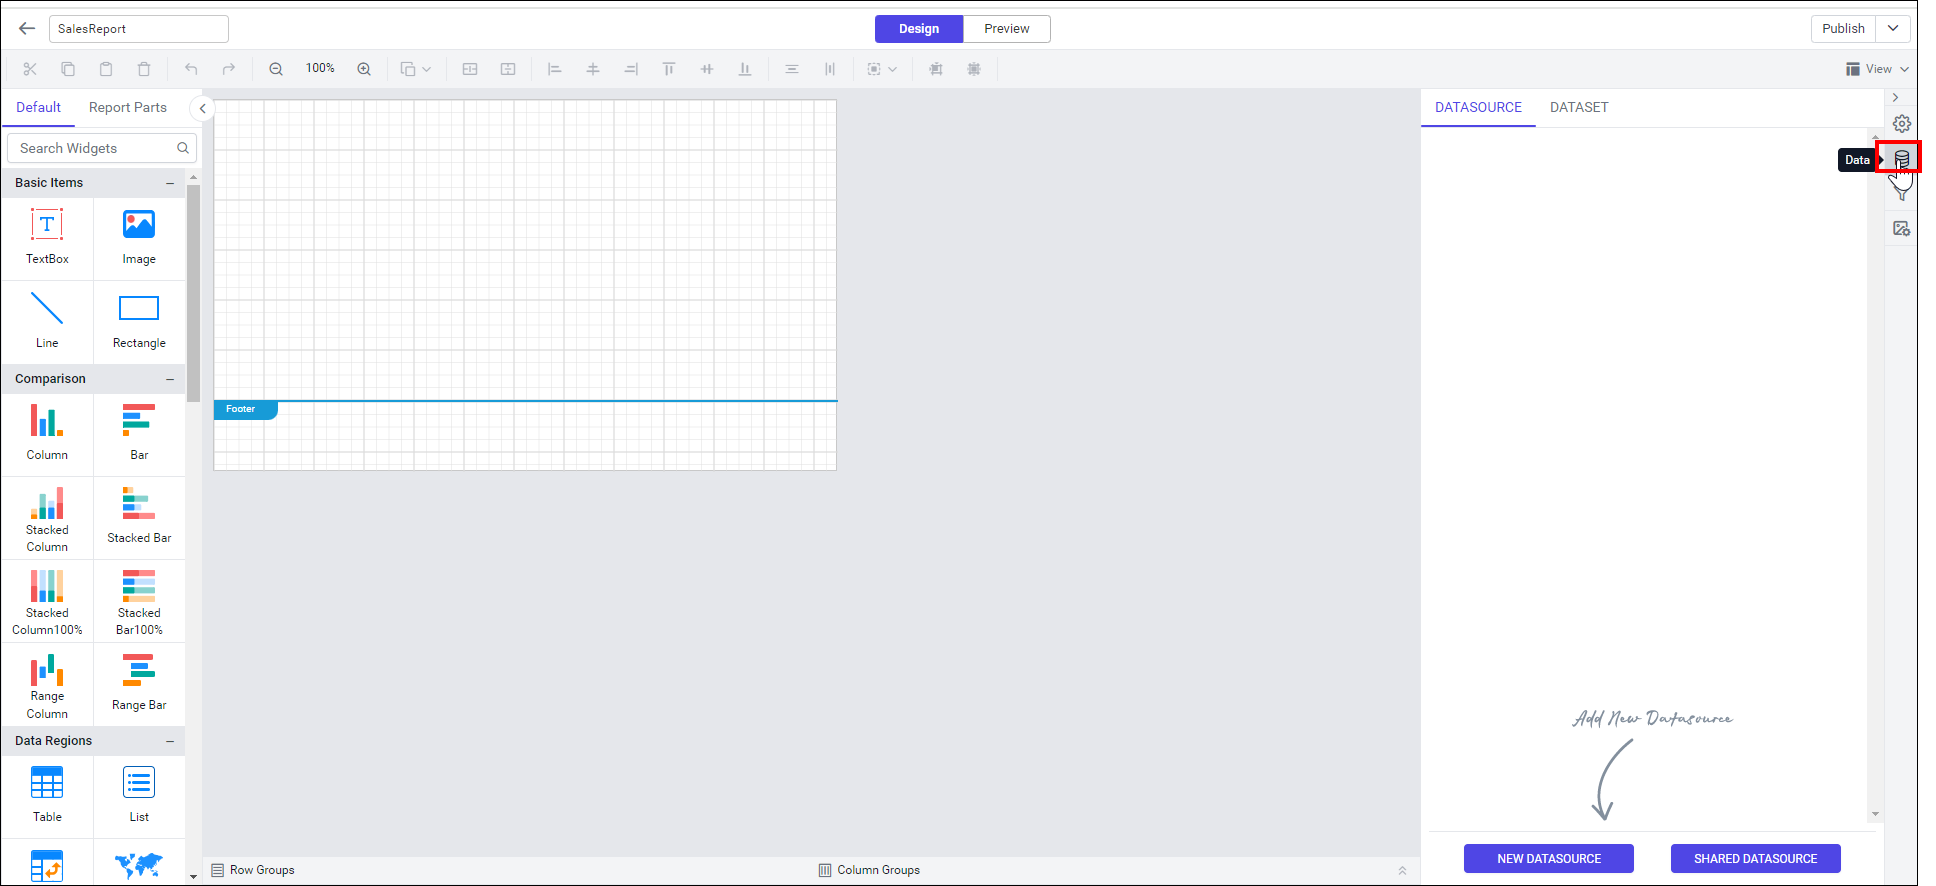 2. Click on the
 New Data button in Data panel.
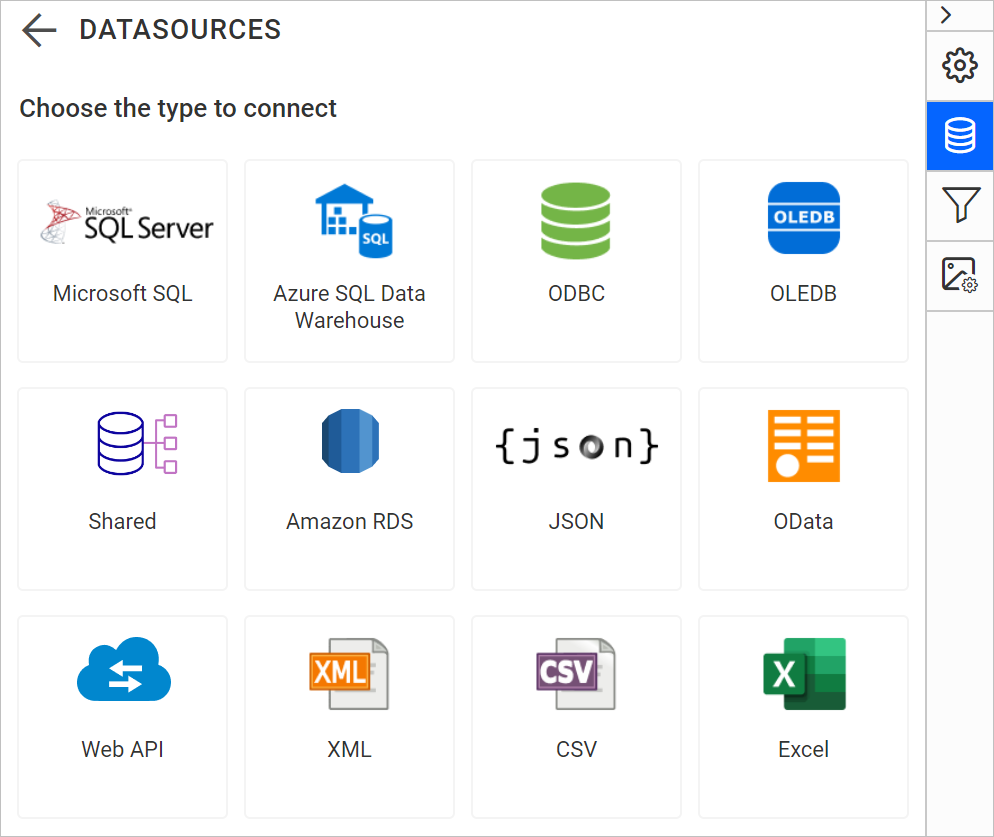
3. In the connection type panel, click the data source type that you want to connect. Here, SQL connection type is used to demonstrate.
 4. In the new data source configuration panel, fill the server name and related details. As I said earlier, we are going to create a data set by temporary table concept. So, you can provide credentials and connect with any of your server or local databases.
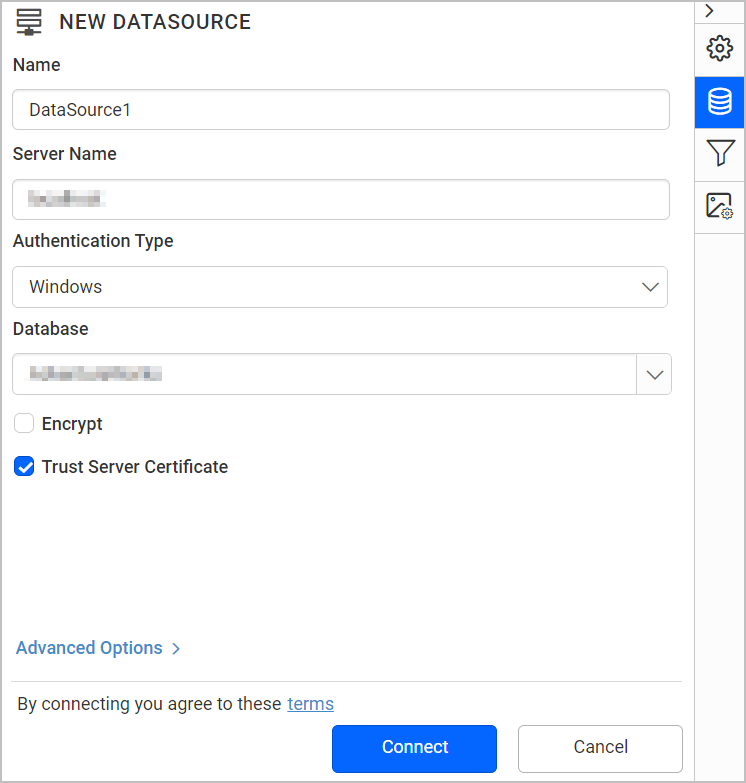 5. Click on the
 Connect button, now the following view will be displayed.
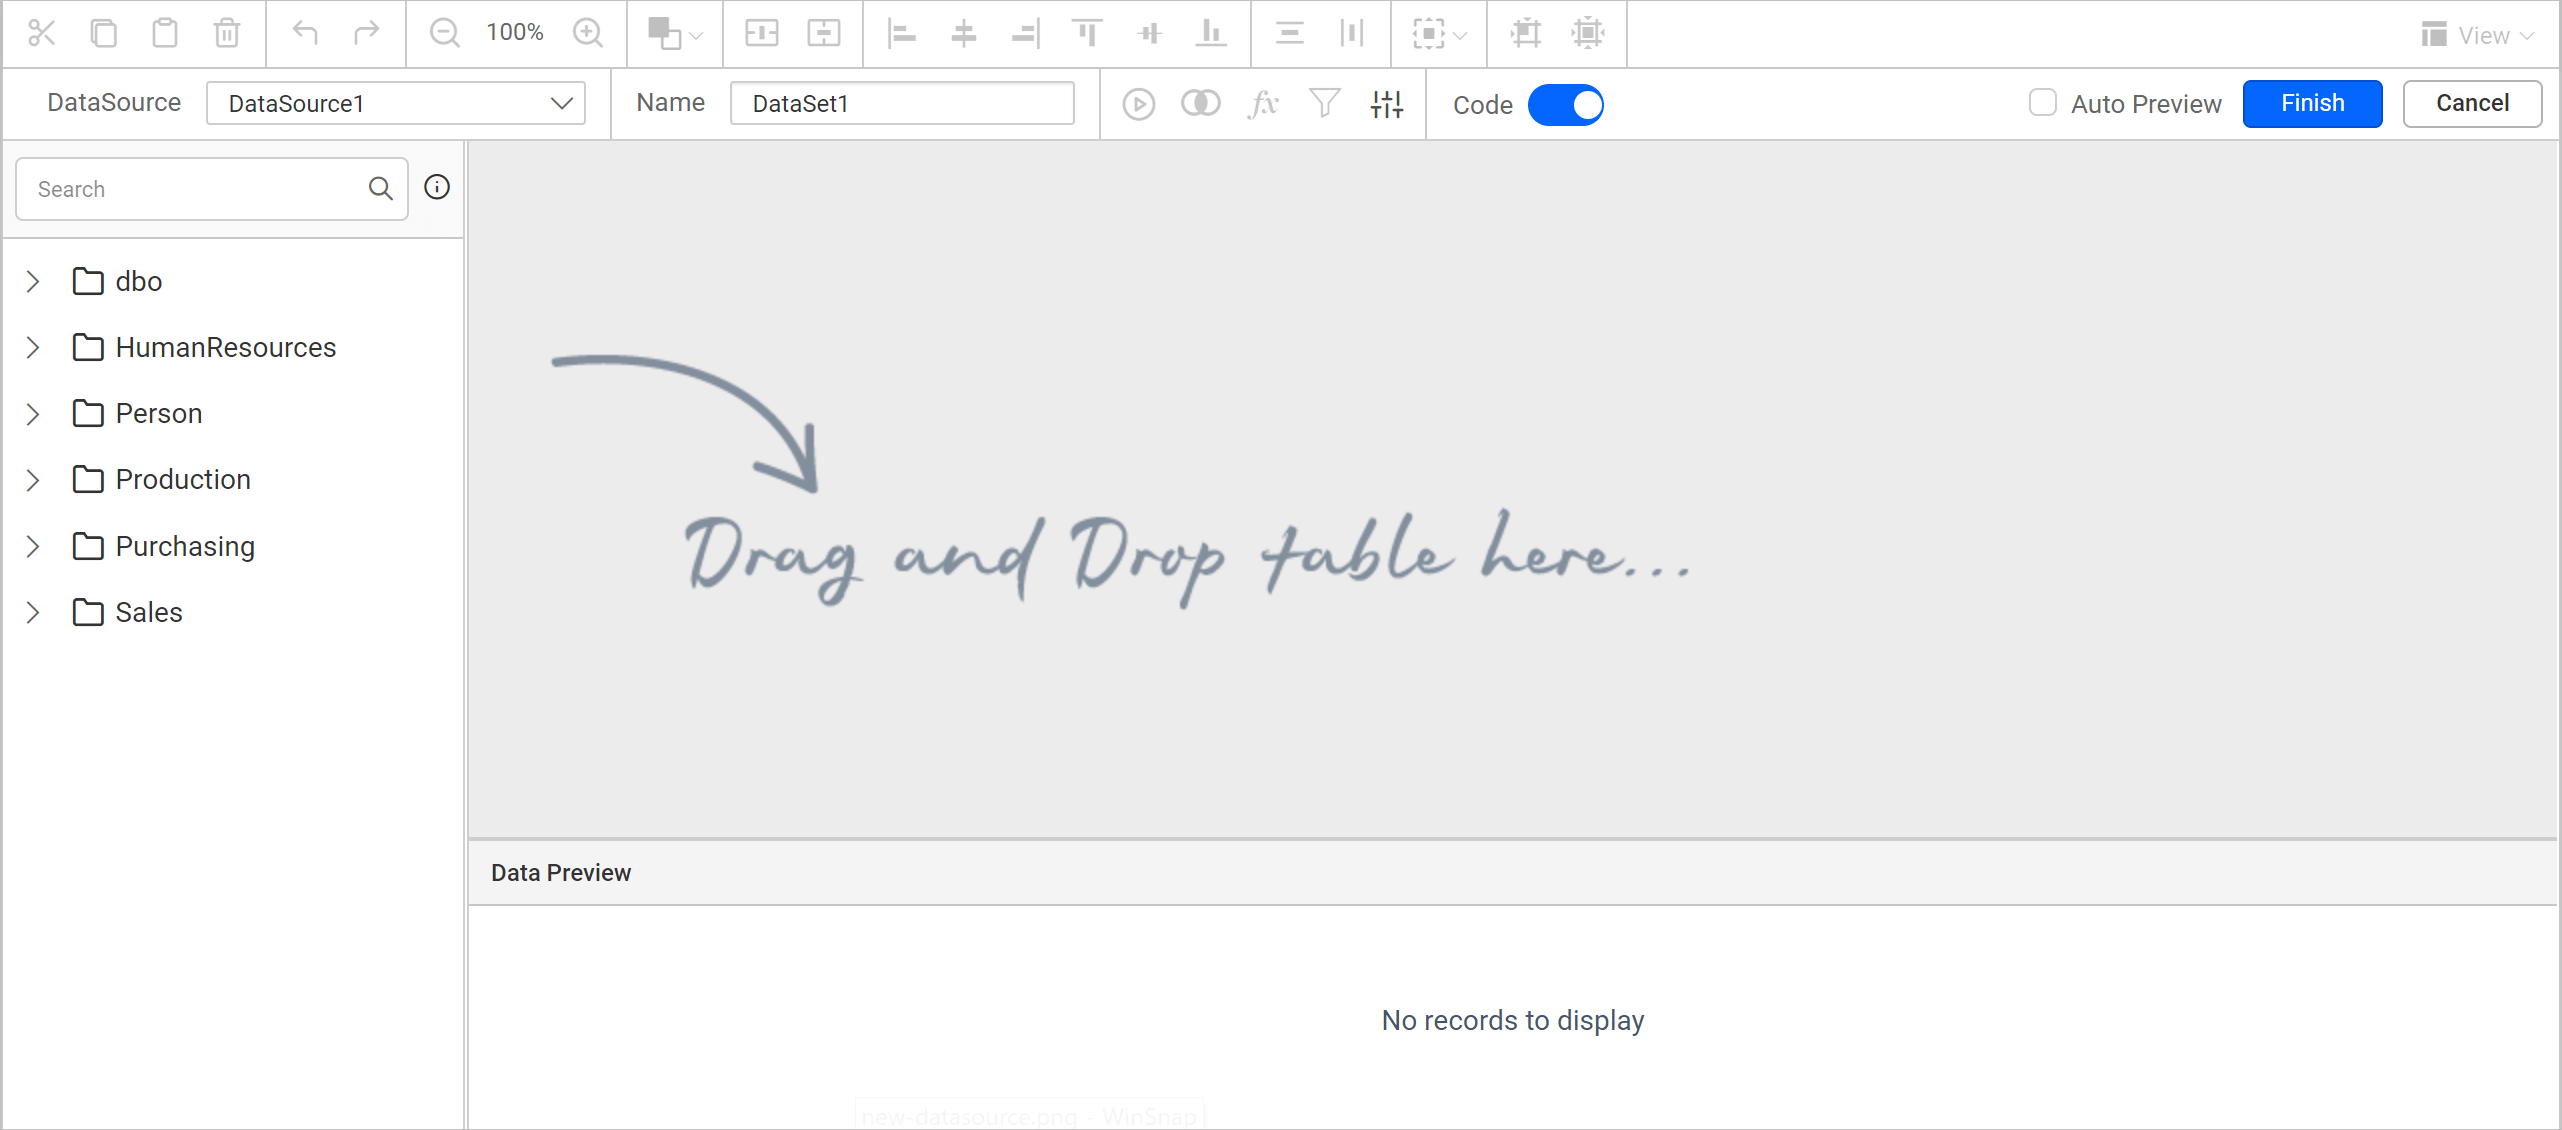 6. In the query builder, you can build query with existing tables in your database or use the below query.
DROP TABLE UserInfo
CREATE TABLE UserInfo
(
user_id INT IDENTITY PRIMARY KEY,
SalesPersonID VARCHAR(200) NOT NULL,
SalesPerson VARCHAR(100) NOT NULL,
CustomerName VARCHAR(100) NOT NULL,
ProductName VARCHAR(100) NOT NULL,
PurchaseDate DATETIME NOT NULL,
ExpiryDate DATETIME NOT NULL,
Amount Float,
LicenseType VARCHAR(100) NOT NULL
)
INSERT INTO UserInfo
VALUES ('[email protected]','Smith', 'James', 'WEB (Essential JS 2)', '3/1/2016', '3/1/2017','23456', 'Standard'),
('[email protected]','Smith', 'Jeff', 'WEB (Essential JS 1)', '9/8/2019', '9/8/2020','12323', 'Community'),
('[email protected]','Smith', 'Armstrong', 'Embedded Reporting Tools', '1/12/2018', '1/12/2020','79897', 'Standard'),
('[email protected]','Smith', 'Cromley', 'EnterpriseBI', '1/12/2018', '1/12/2020','45364', 'Platinum'),
('[email protected]','Smith', 'Richardson', 'EnterpriseBI', '2/11/2017', '2/11/2020','21467', 'Platinum'),
('[email protected]','Smith', 'Horton', 'Cloud BI', '9/11/2018', '2/11/2020','87897', 'Standard'),
('[email protected]','Smith', 'Washington', 'Embedded BI', '3/8/2019', '3/8/2020','13446', 'Platinum'),
('[email protected]','Smith', 'Victoria', 'WEB (Essential JS 2)', '3/8/2019', '3/8/2020','43566', 'Standard'),
('[email protected]','Smith', 'Eric', 'FILE FORMAT', '3/8/2004', '8/12/2005','67899', 'Community'),
('[email protected]','Smith', 'John', 'MOBILE', '8/8/2019', '8/8/2020','89800', 'Standard'),
('[email protected]','Anderson', 'Eric', 'WEB (Essential JS 2)', '1/1/2016', '1/1/2017','23456', 'Standard'),
('[email protected]','Anderson', 'James', 'WEB (Essential JS 1)', '10/8/2019', '10/8/2020','12323', 'Community'),
('[email protected]','Anderson', 'Victoria', 'Embedded Reporting Tools', '11/12/2018', '11/12/2020','79897', 'Standard'),
('[email protected]','Anderson', 'Charles', 'EnterpriseBI', '12/12/2018', '12/12/2020','45364', 'Platinum'),
('[email protected]','Anderson', 'Horton', 'EnterpriseBI', '5/11/2017', '5/11/2020','21467', 'Platinum'),
('[email protected]','Anderson', 'Richard', 'Cloud BI', '6/11/2018', '6/11/2020','87897', 'Standard'),
('[email protected]','Anderson', 'John', 'Embedded BI', '4/8/2019', '4/8/2020','13446', 'Platinum'),
('[email protected]','Anderson', 'Steffy', 'WEB (Essential JS 2)', '12/8/2019', '12/8/2020','43566', 'Standard'),
('[email protected]','Anderson', 'Pat', 'FILE FORMAT', '7/8/2004', '7/12/2005','67899', 'Community'),
('[email protected]','Anderson', 'Moffy', 'MOBILE', '5/8/2019', '5/8/2020','89800', 'Standard')
SELECT * FROM UserInfo
Note: The above query is static sample data created for demonstration purpose.
- Switch to the query mode and enter the query.
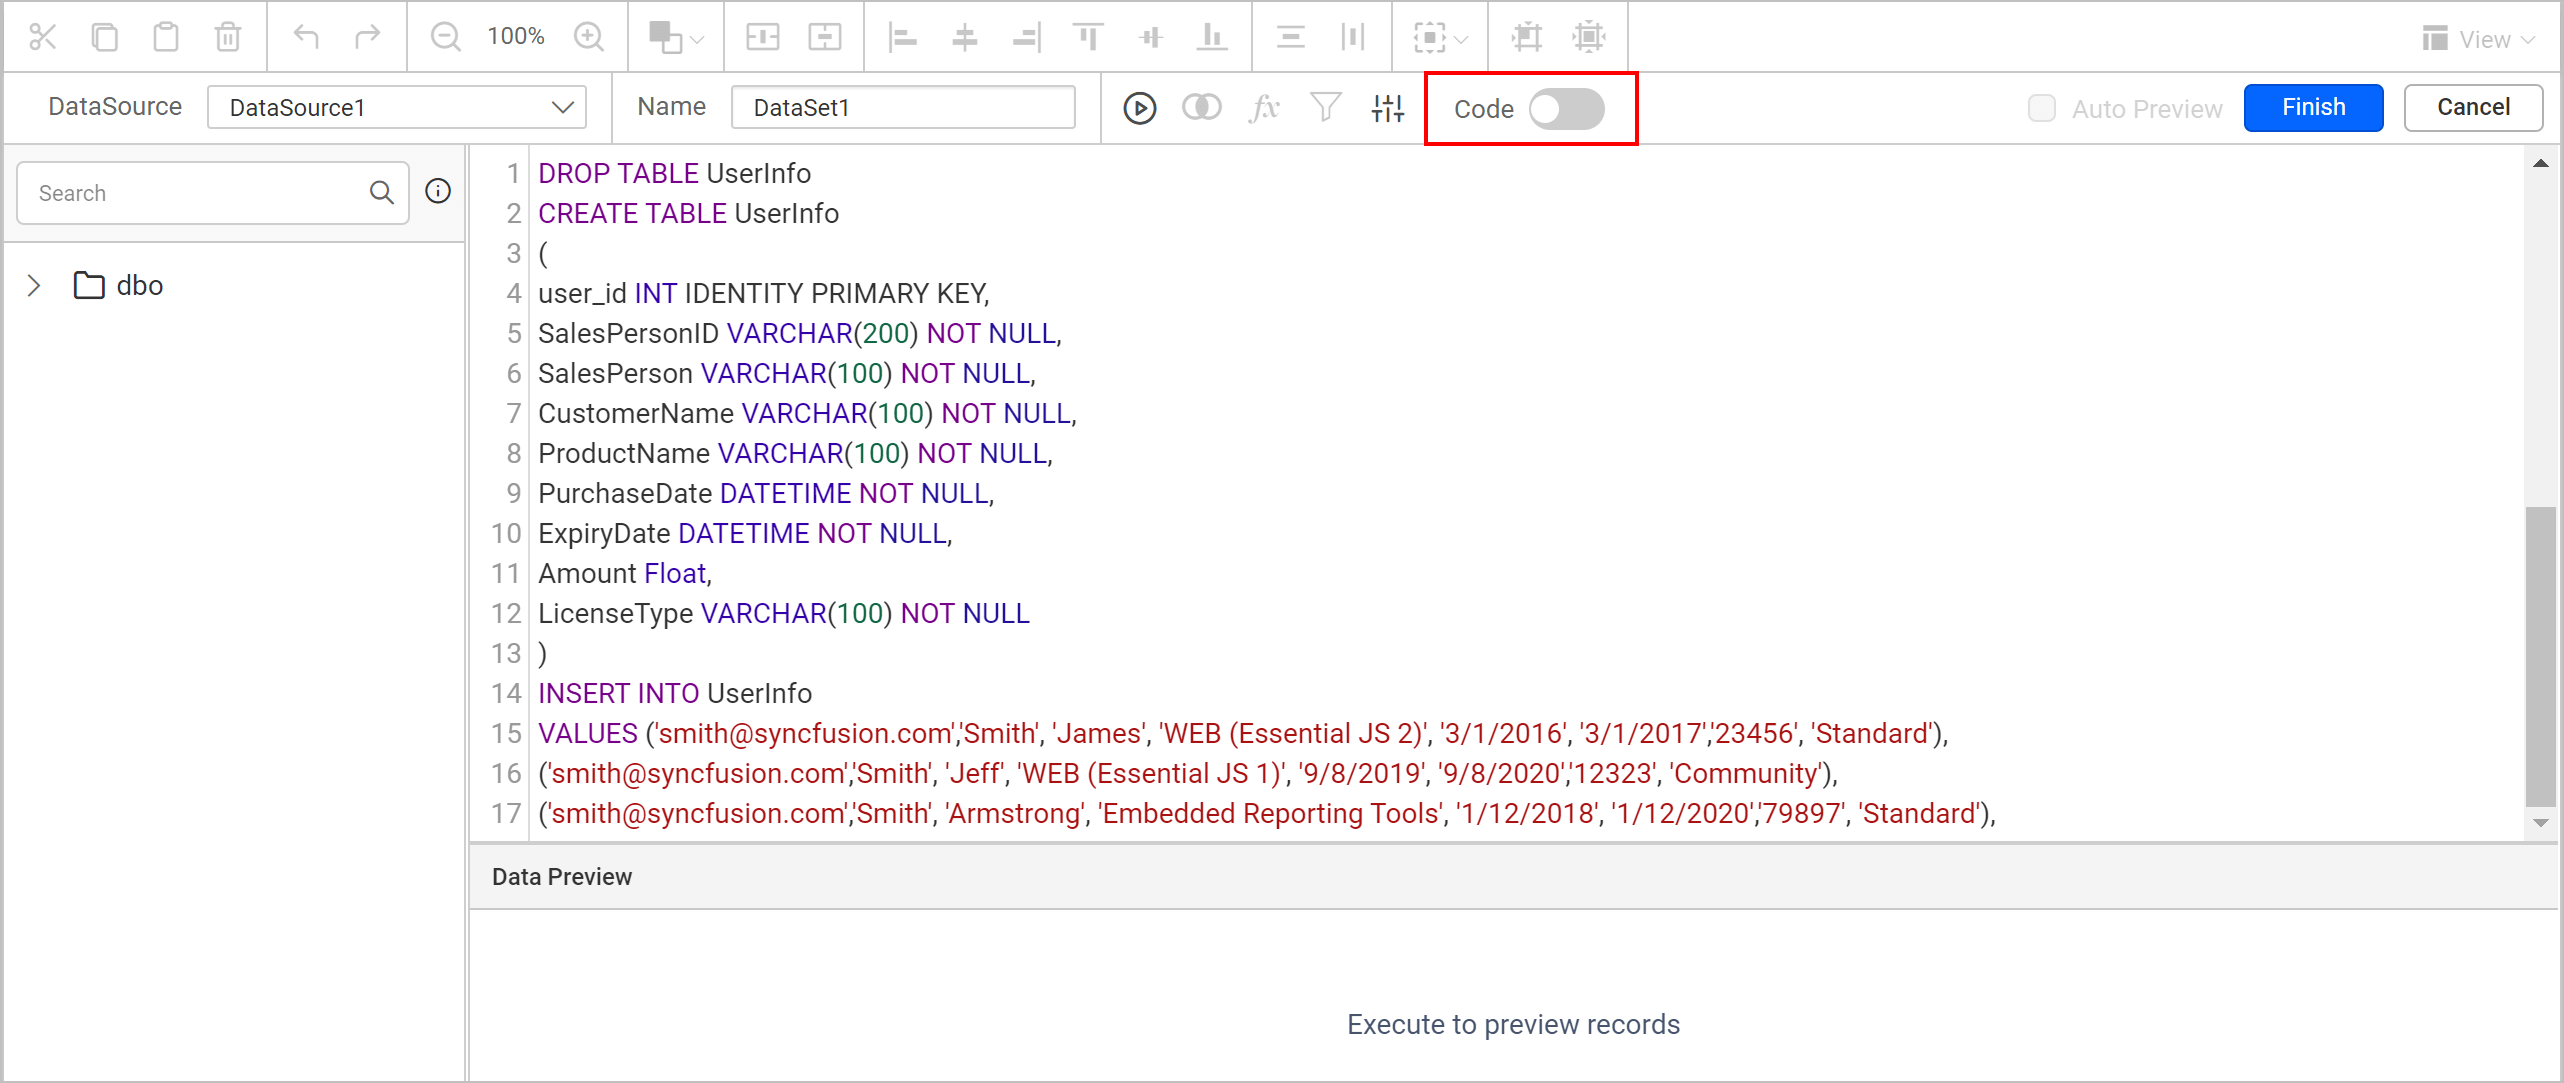
Create query parameter
To filter the user specific data, create a parameter at query level. Add the below WHERE clause statement in the query mode.
WHERE SalesPersonID = @useridFilter data using user collection
The User collection provides detail about the user who ran the report. To filter the sales history, passing the sales person id as value for user_id parameter. Follow the below steps to assign the value for parameter.
- Click on the Parameter icon in the query designer toolbar.
![]() 2. By default, the Parameters dialog will be open with
2. By default, the Parameters dialog will be open with @user_id parameter.
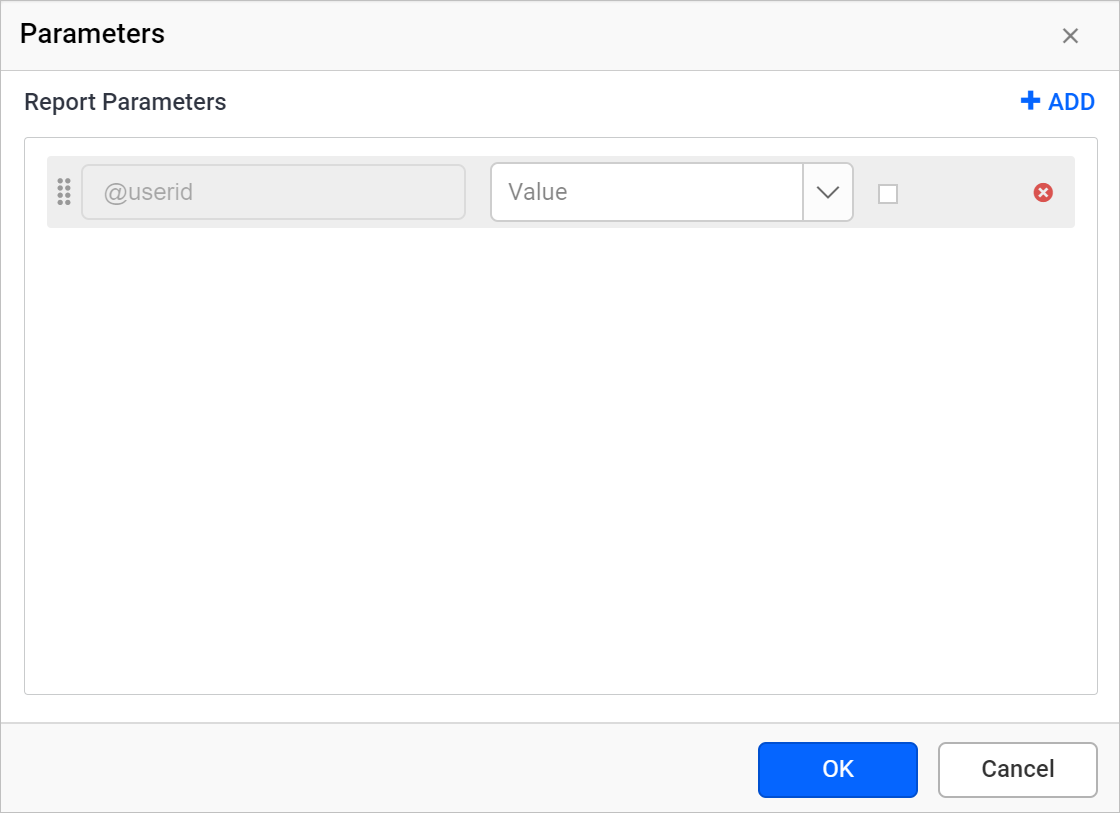 3. Click on the small square icon next to the
 Value field.
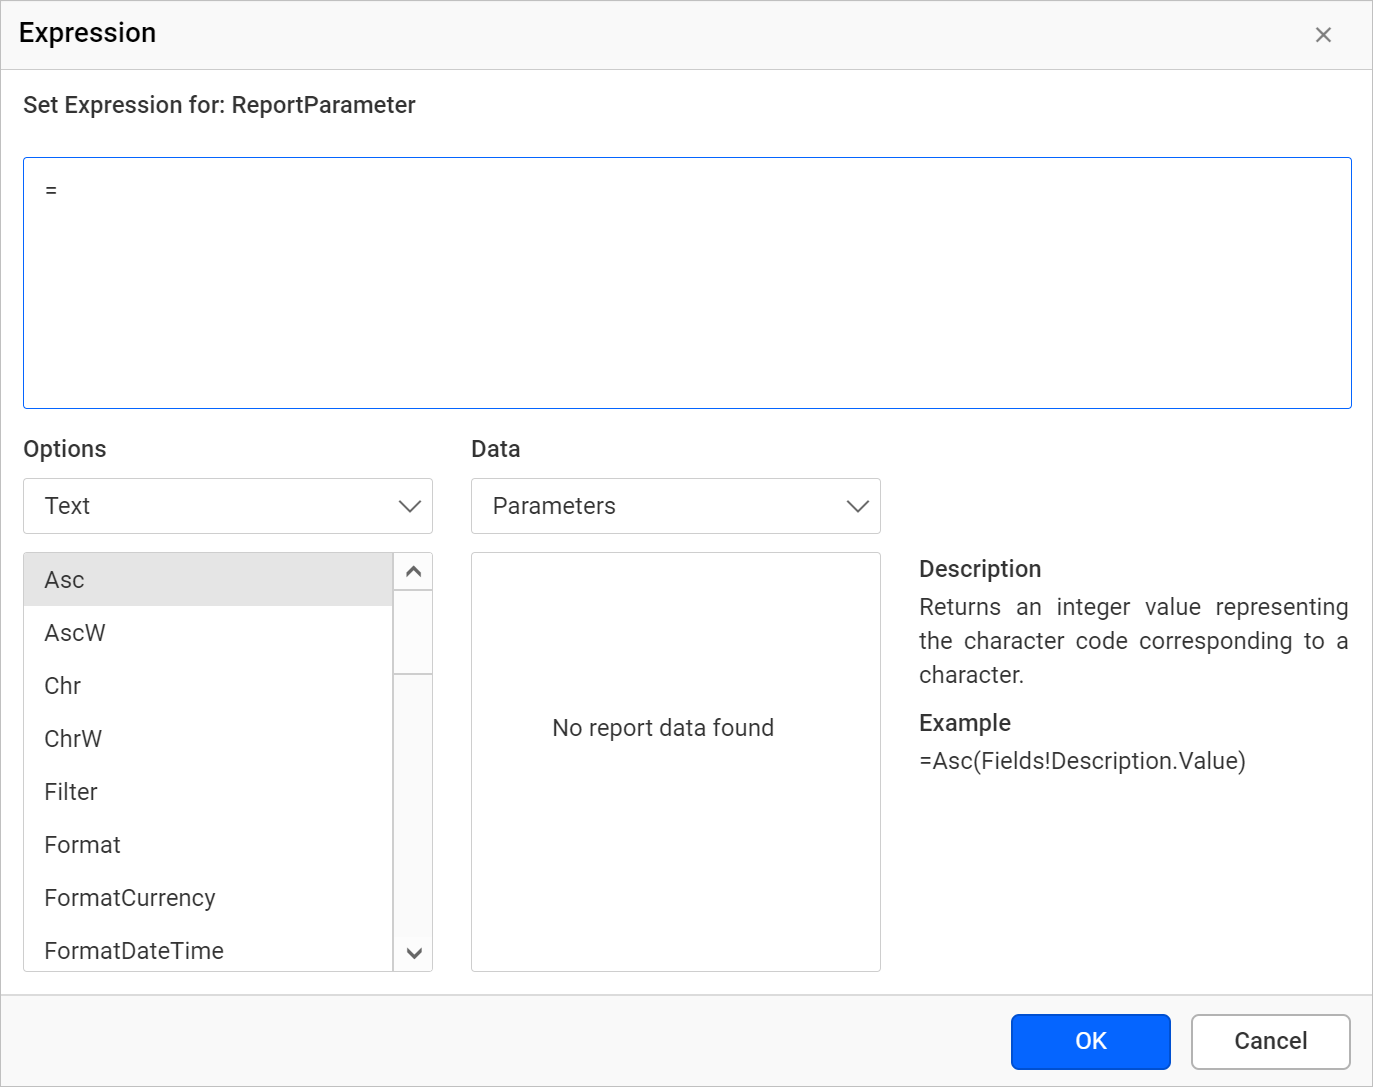
![]() 4. It will launch the expression dialog like below.
4. It will launch the expression dialog like below.
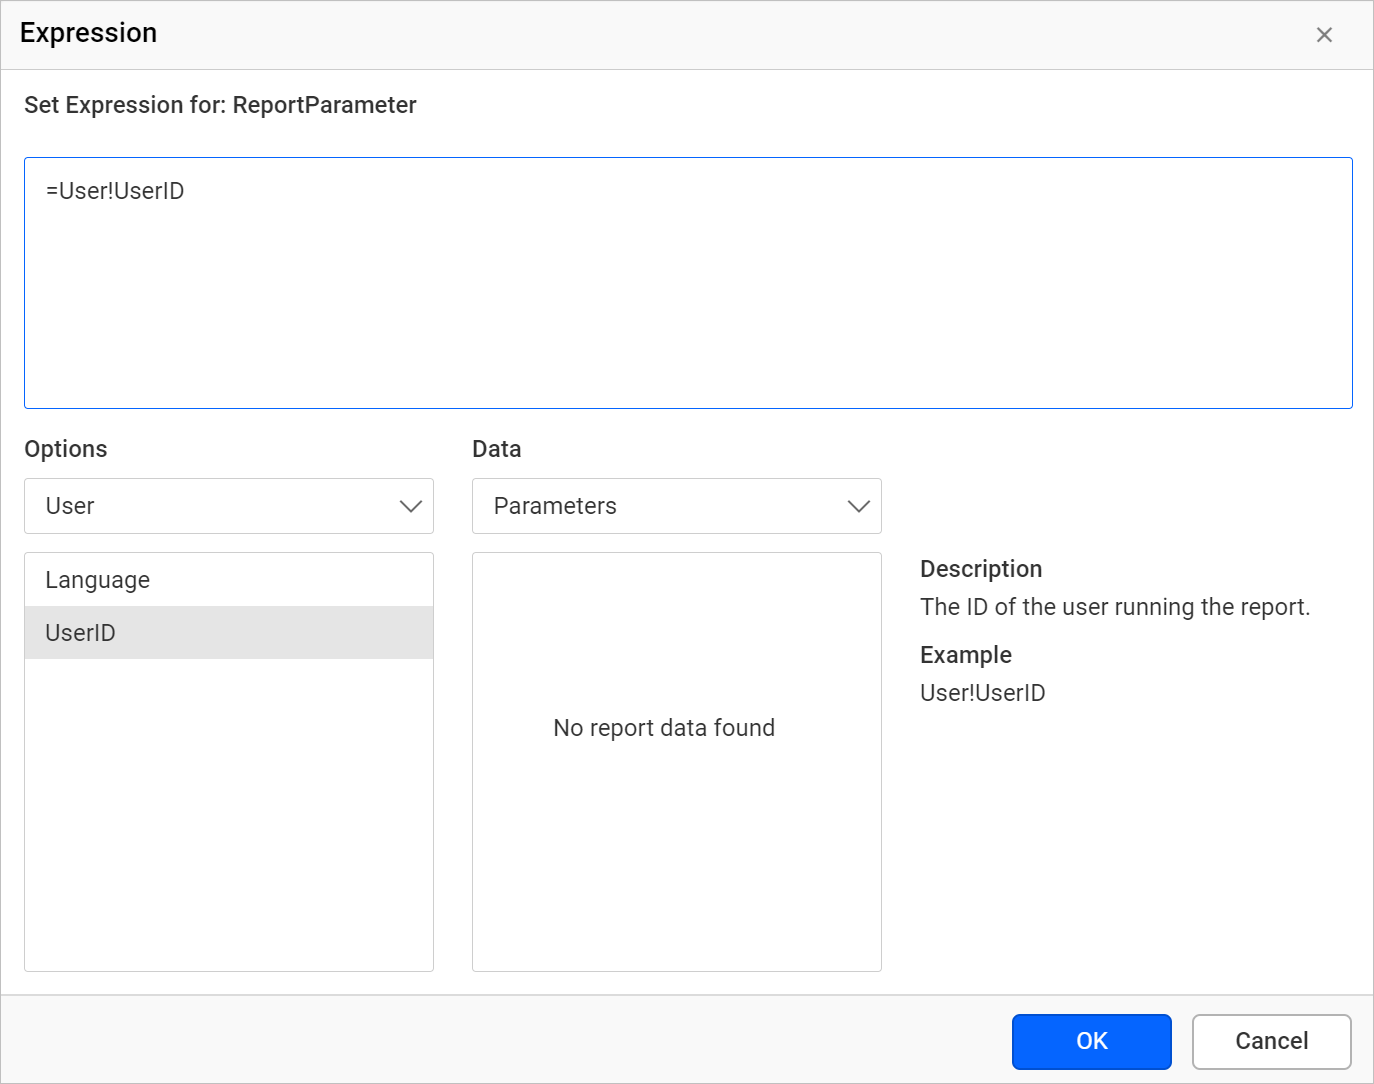
 5. Enter the
 =User!UserID expression in the text area and click OK.
 6. Click
 Finish.
When the report runs the data set values will be filtered based on the current user who runs the report.
Display data in table
The table report item is listed in the item panel under the Data Regions category.
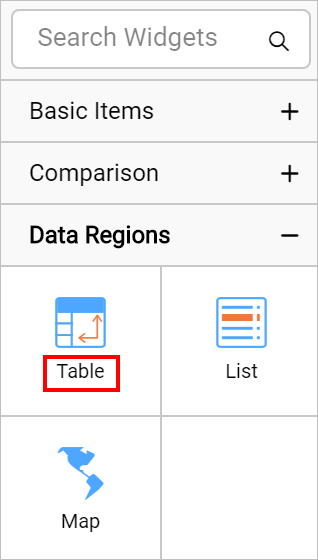
Drag and drop the table report item into the design area from the item panel.
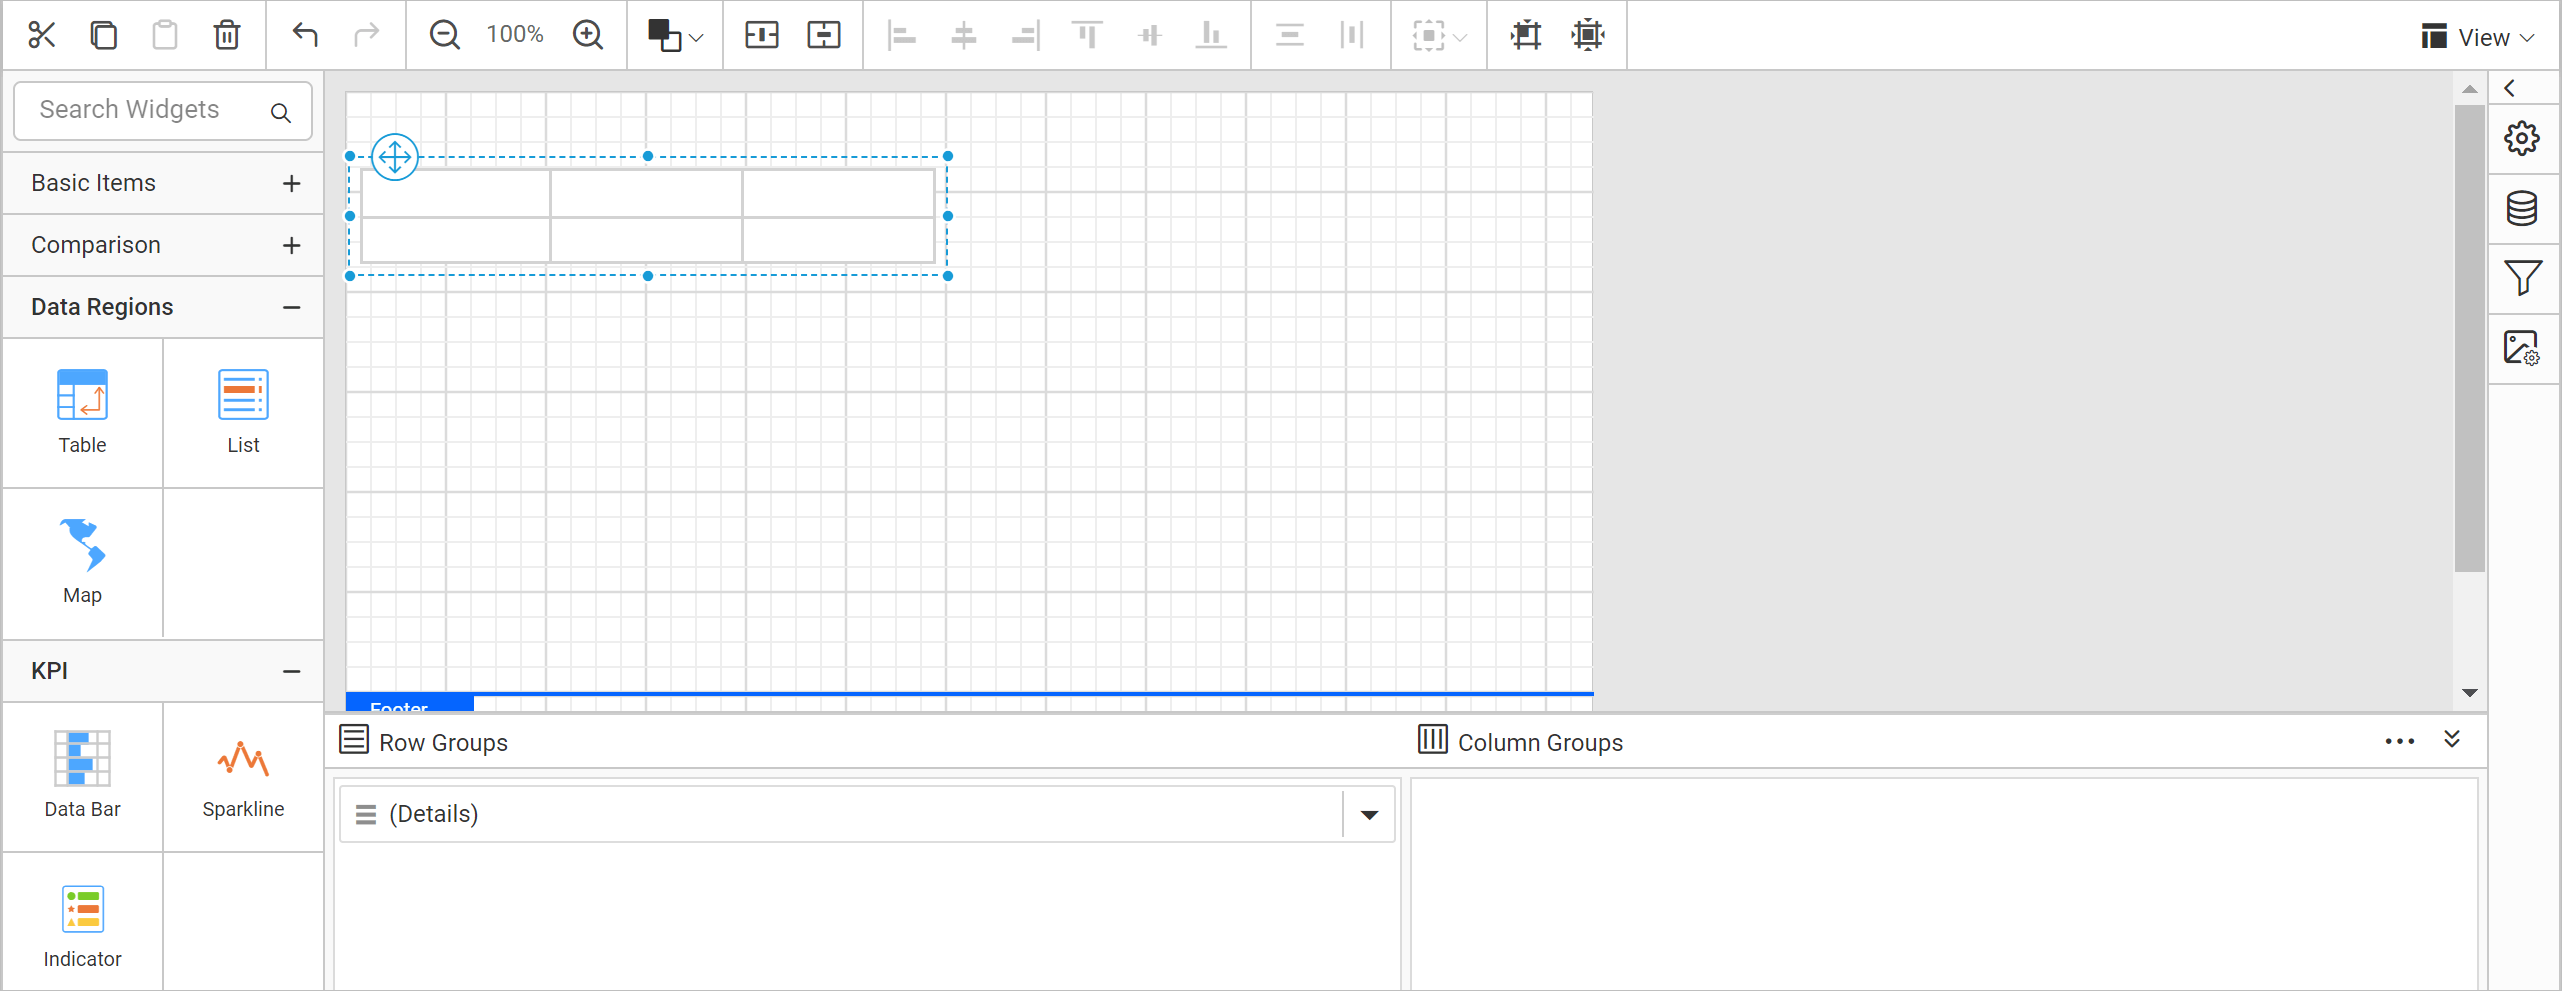
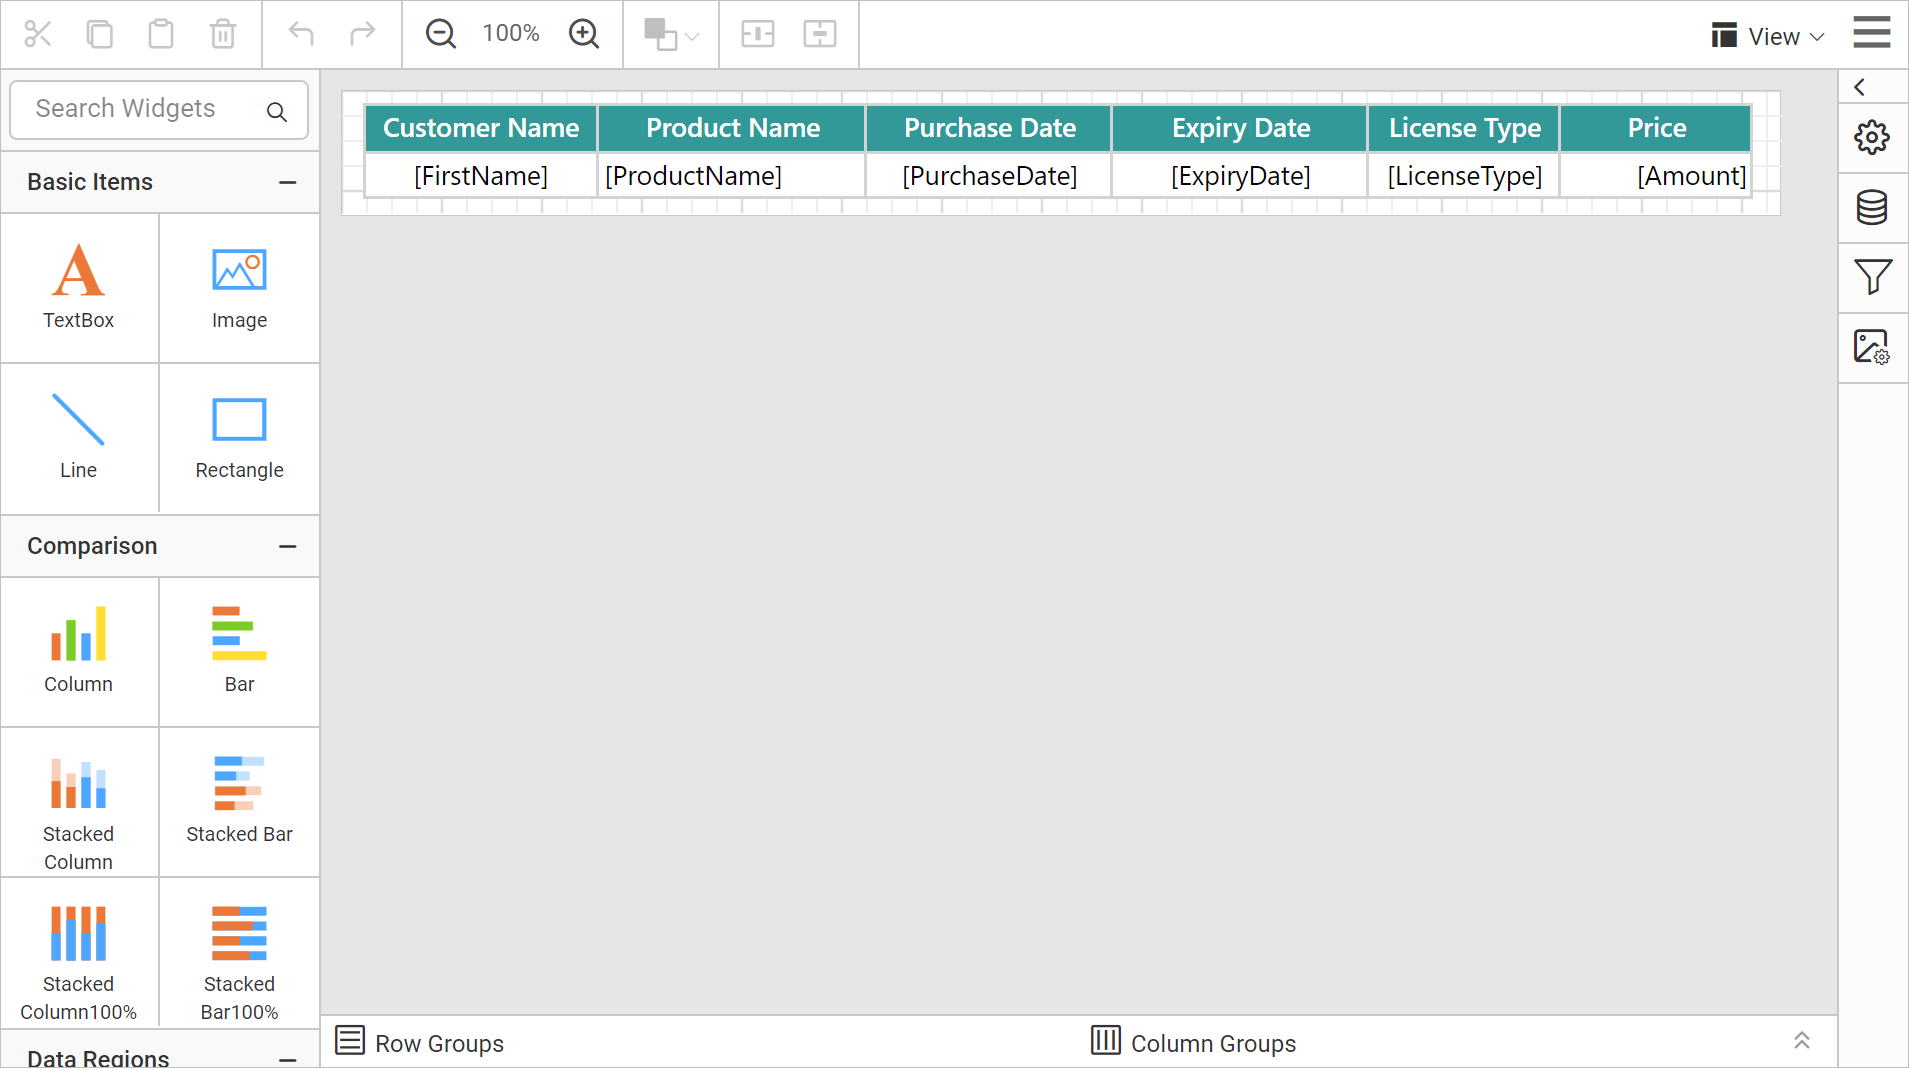
Assign the required data fields in the table cell and format the report design as required using the properties listed in property panel. Refer Simple Table Design section to learn the designing steps in detail.
The below report design will display the customer name, purchase details and sales amount achieved by a salesperson when the report runs.
Adding header to the report
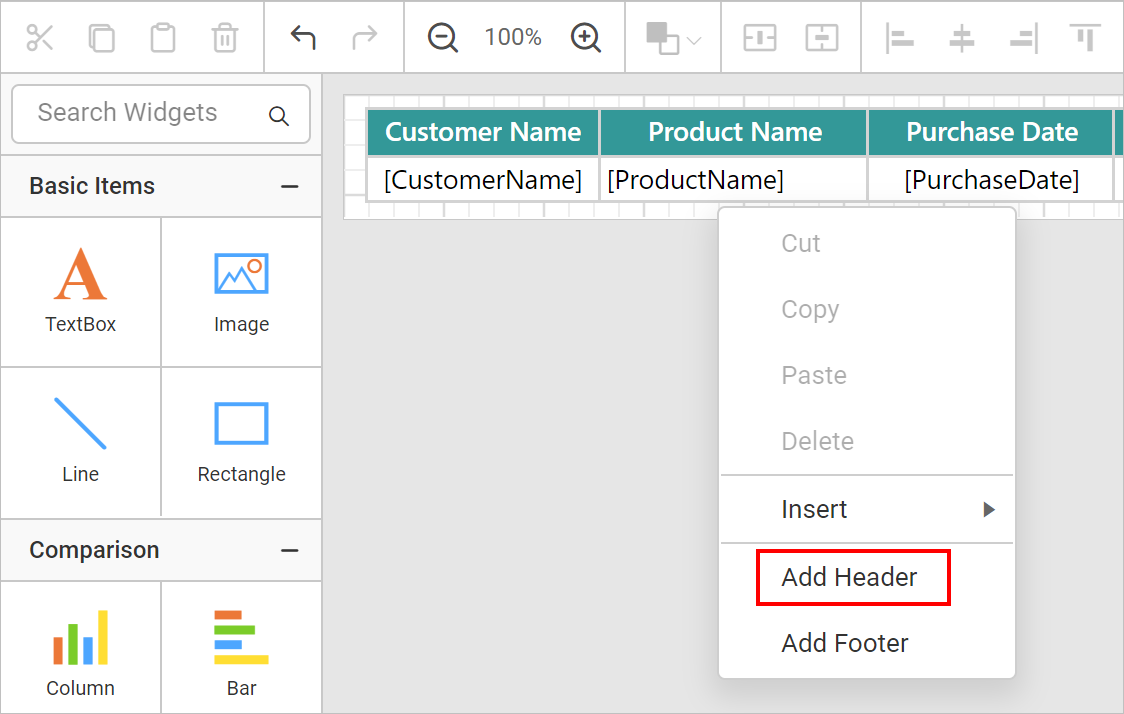
To complete the design, add a header to the report. In the report header, we can show the salesperson name and title for the report. Follow the below steps to add header to the report.
- Right-click on the design surface and select
Add Headerfrom context menu.
 2. To add the text to the header, drag the textbox report item to the header area.
 3. Right click inside the textbox and select
 Expression option from context menu.
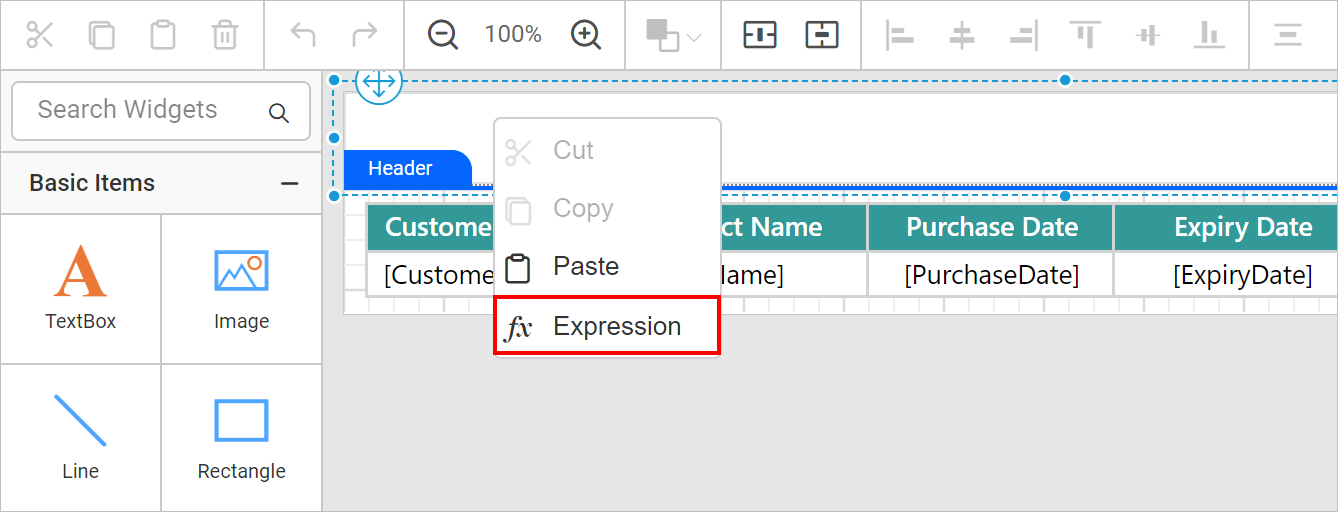 4. In the expression builder, assign the
 =First(Fields!SalesPerson.Value,"DataSet1") expression.
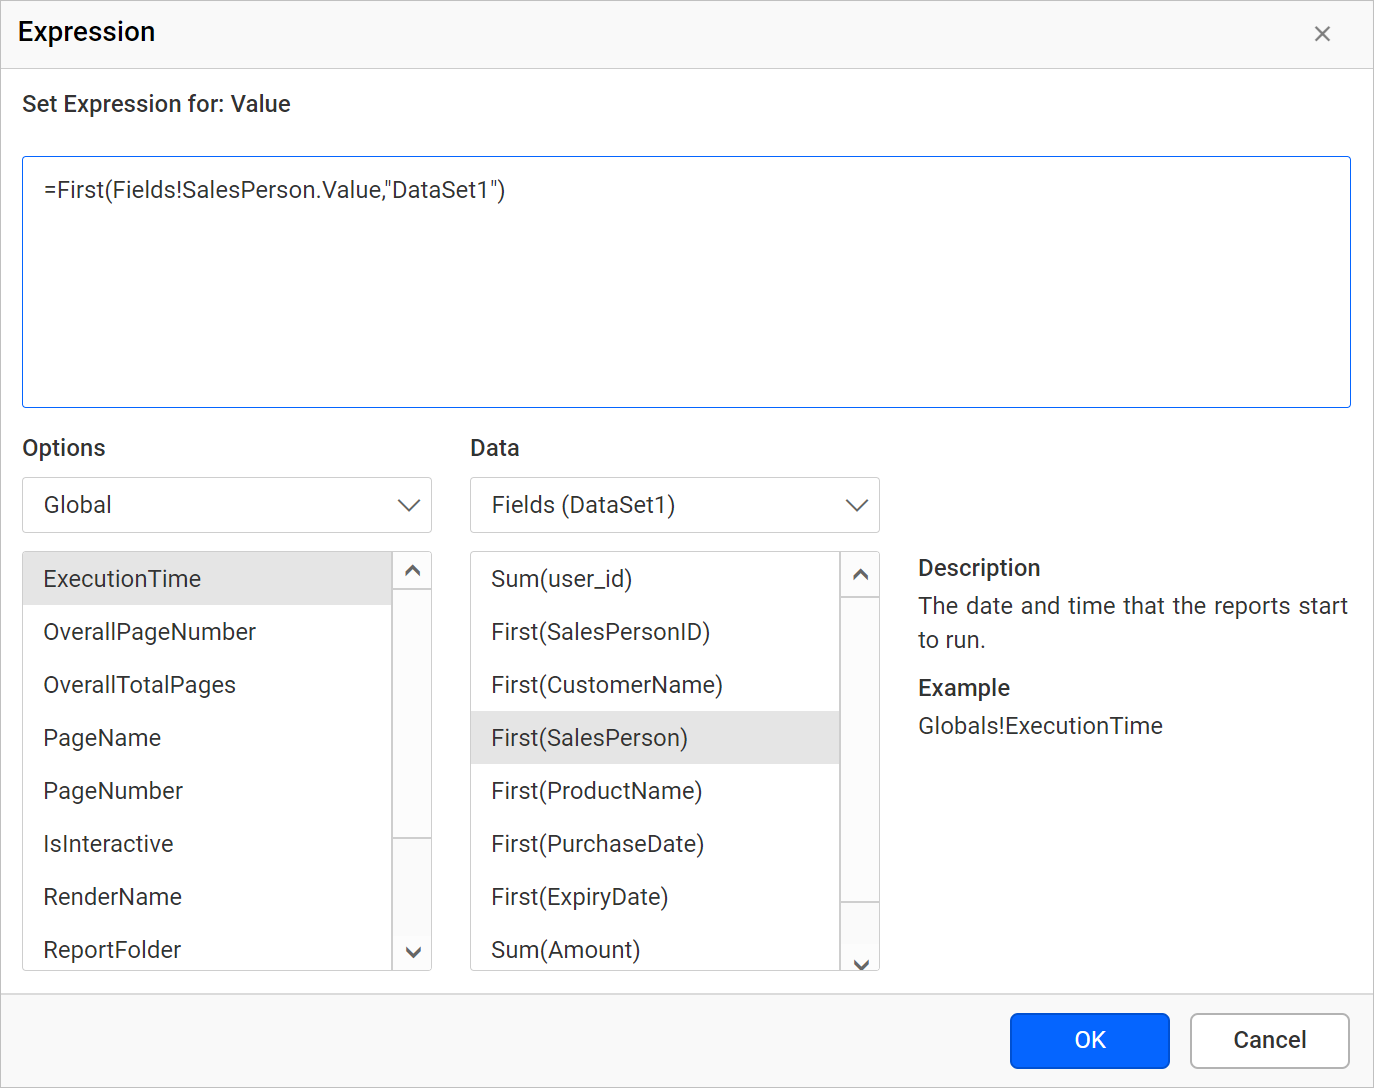 5. Click OK.
6. Enter
 - Sales History text in the text box.
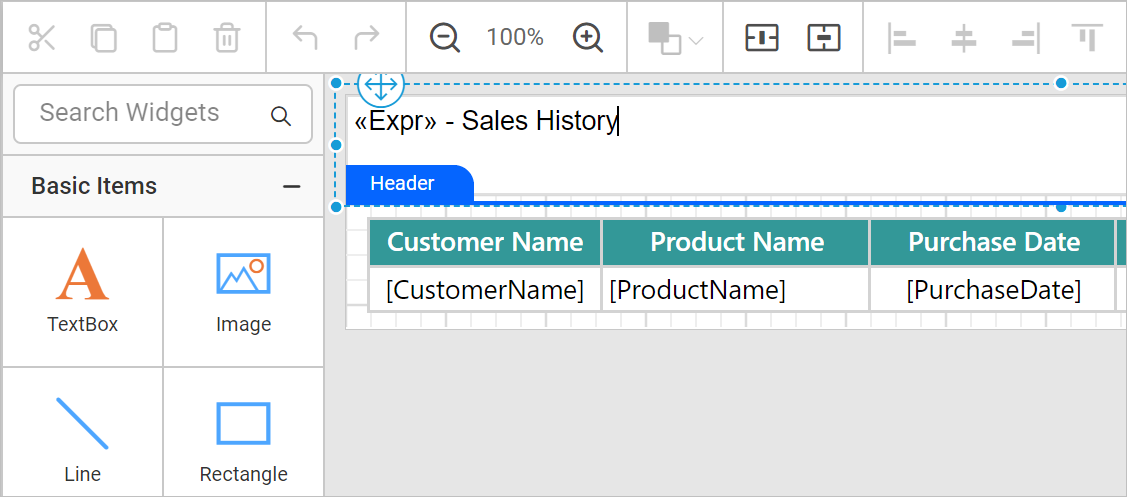
You can format the header textbox using the properties listed in the properties panel.
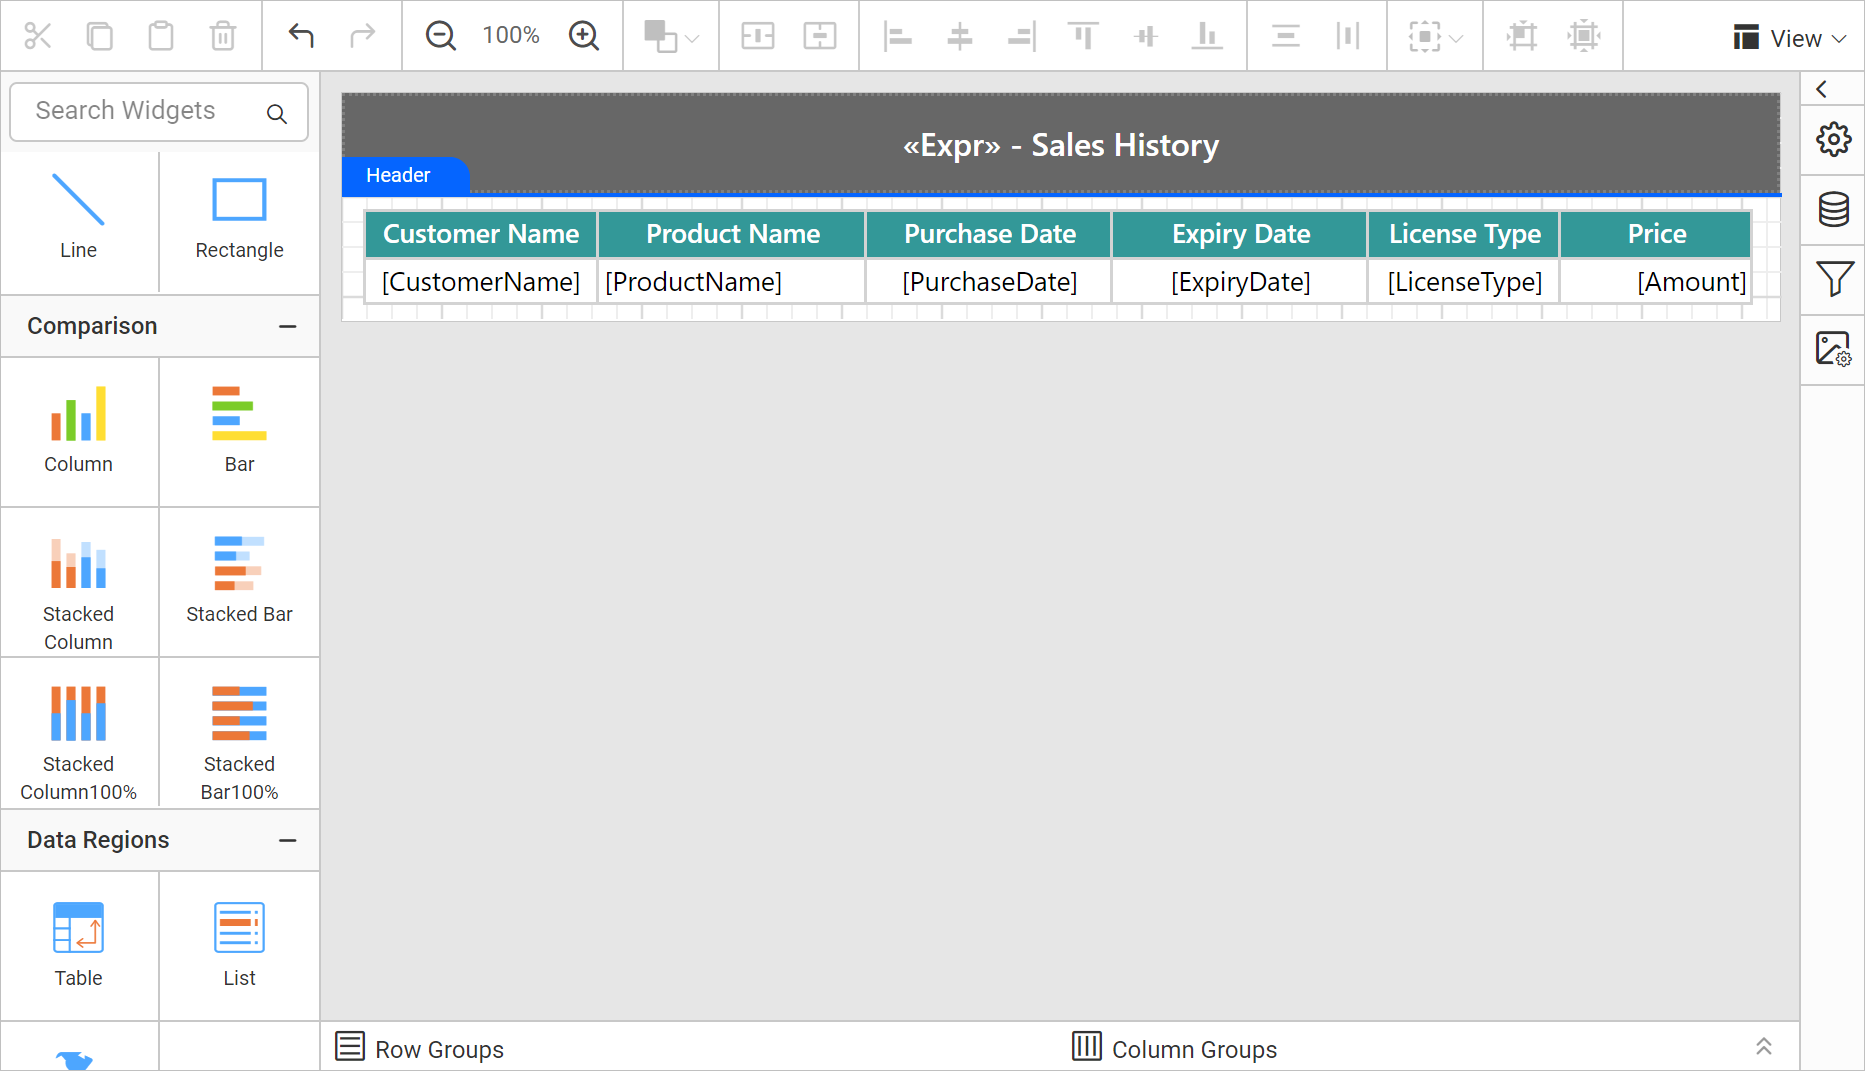
Report Preview
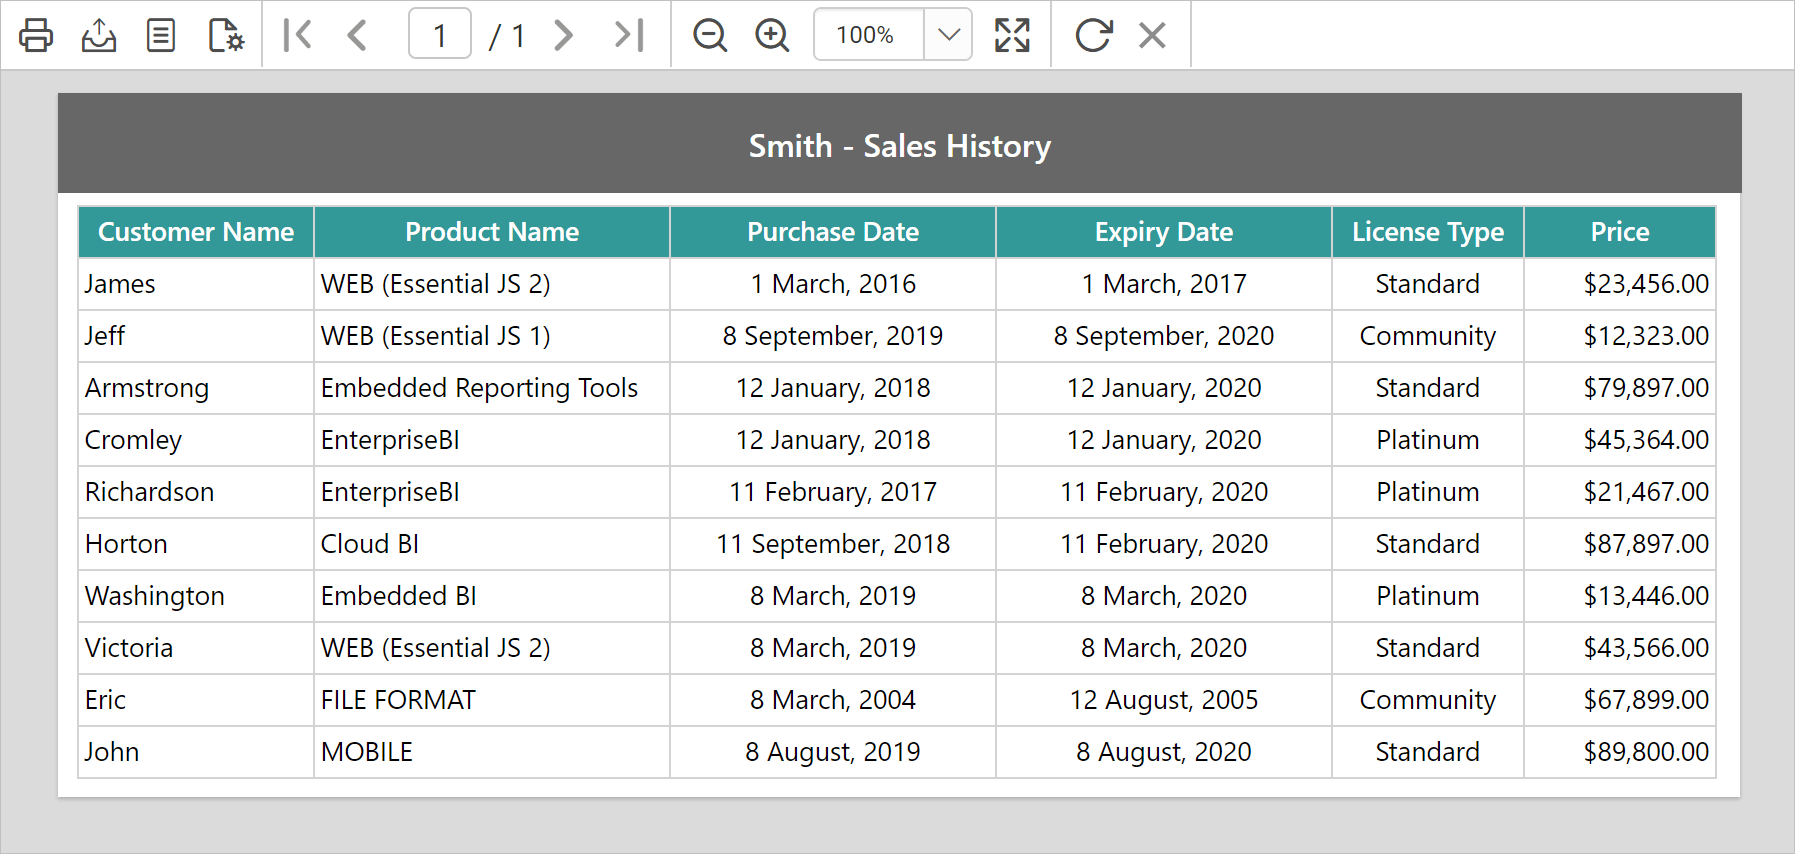
Preview the report. Now based on the current user, the data will be displayed in the table as shown below.
You can download the report design from here.