Add Group Header and Footer
-
Drag and drop
Tablereport item from item panel into the design area and assign dataset to the tablix data region.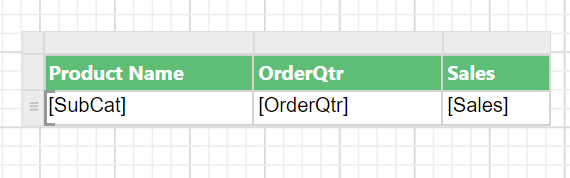
-
Click on the table surface to enable the
Grouping Panelin the design view.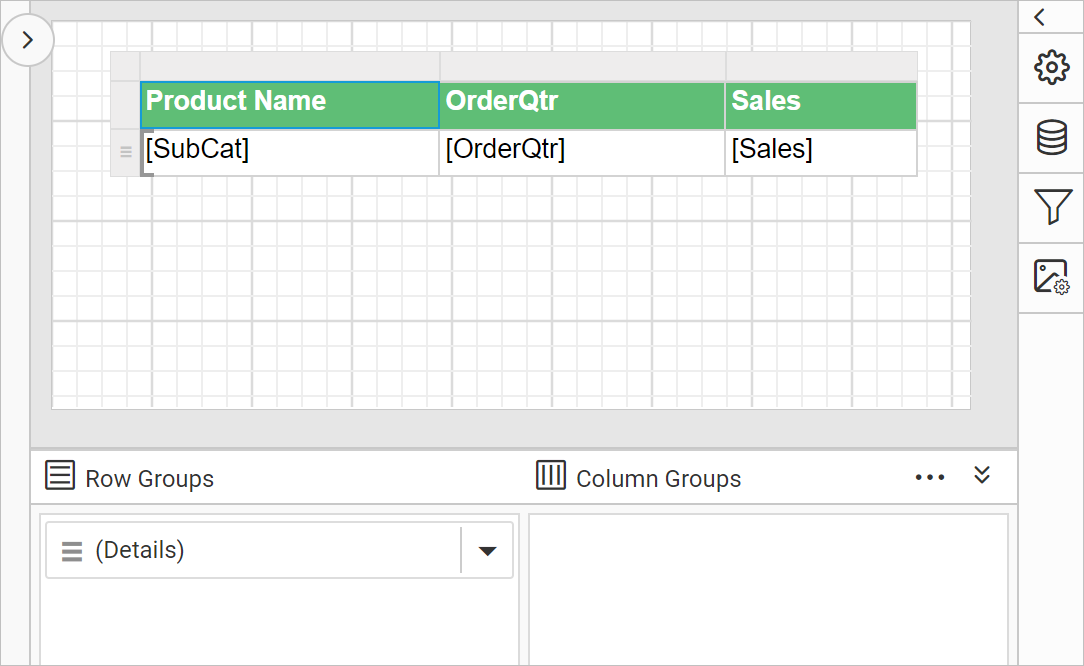
-
Go to
Row Groupspane in grouping panel and open the context menu on theDetailsgroup field.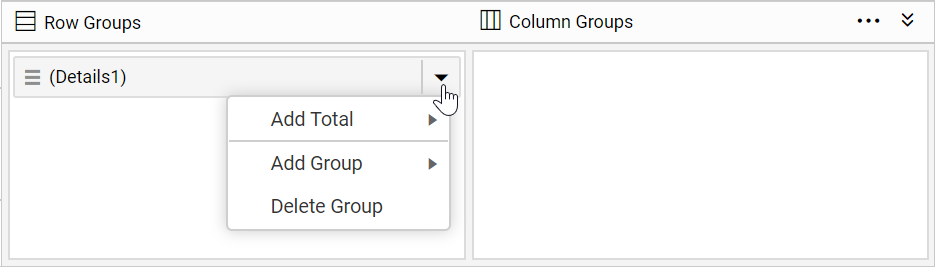
-
From the context menu, click on
Parent Group...option underAdd Groupcategory.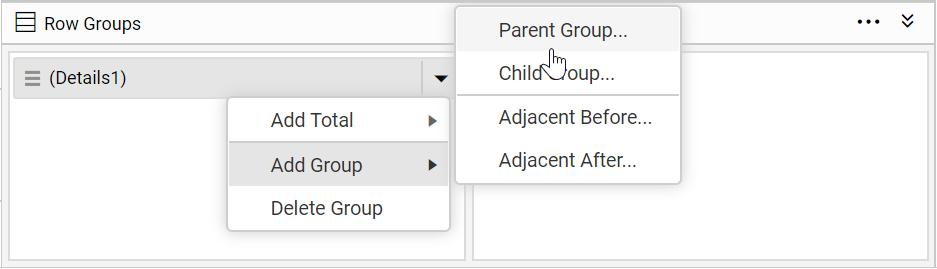
-
Once you click on the
Parent Groupoption, aTablix Groupdialog will be opened to configure the grouping.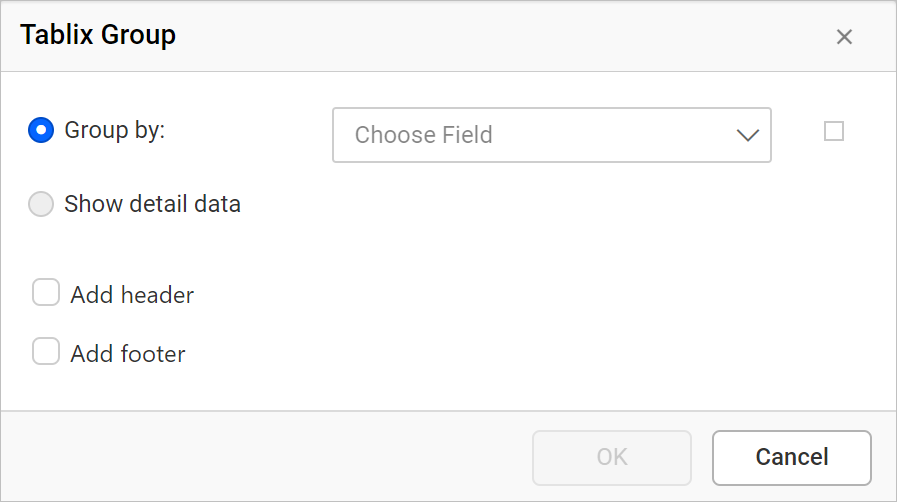
- Group By: Based on the dataset assigned to the tablix region, dataset fields will be listed in this drop-down or else click on the square icon to create an expression.
- Add Group Header: Enable this option to add a header to this group
- Add Group Footer: Enable this option to add a footer to this group
-
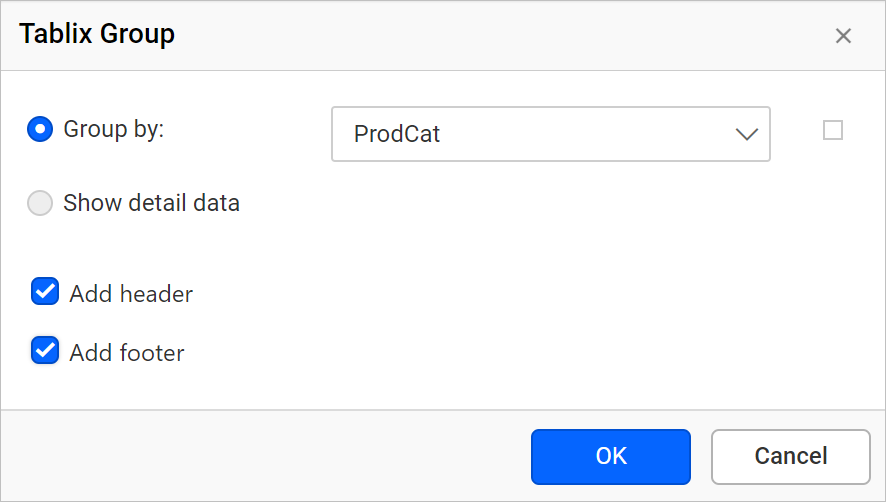
Choose dataset field in the
Group bydrop-down list. -
Select
Add headerto add header row to the group and selectAdd footerto add footer row to the group. Click on theOKbutton.- Add header - Adds a static row above the group.
- Add footer - Adds a static row below the group.
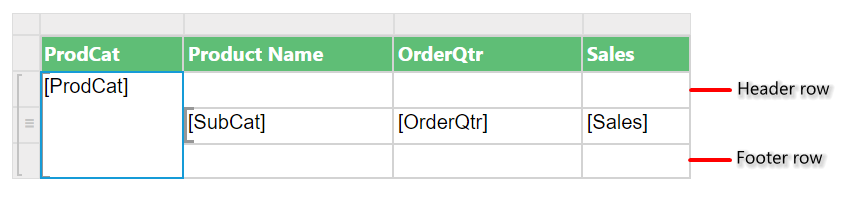
Now, a static row will be added above and below of the group in the tablix data region.
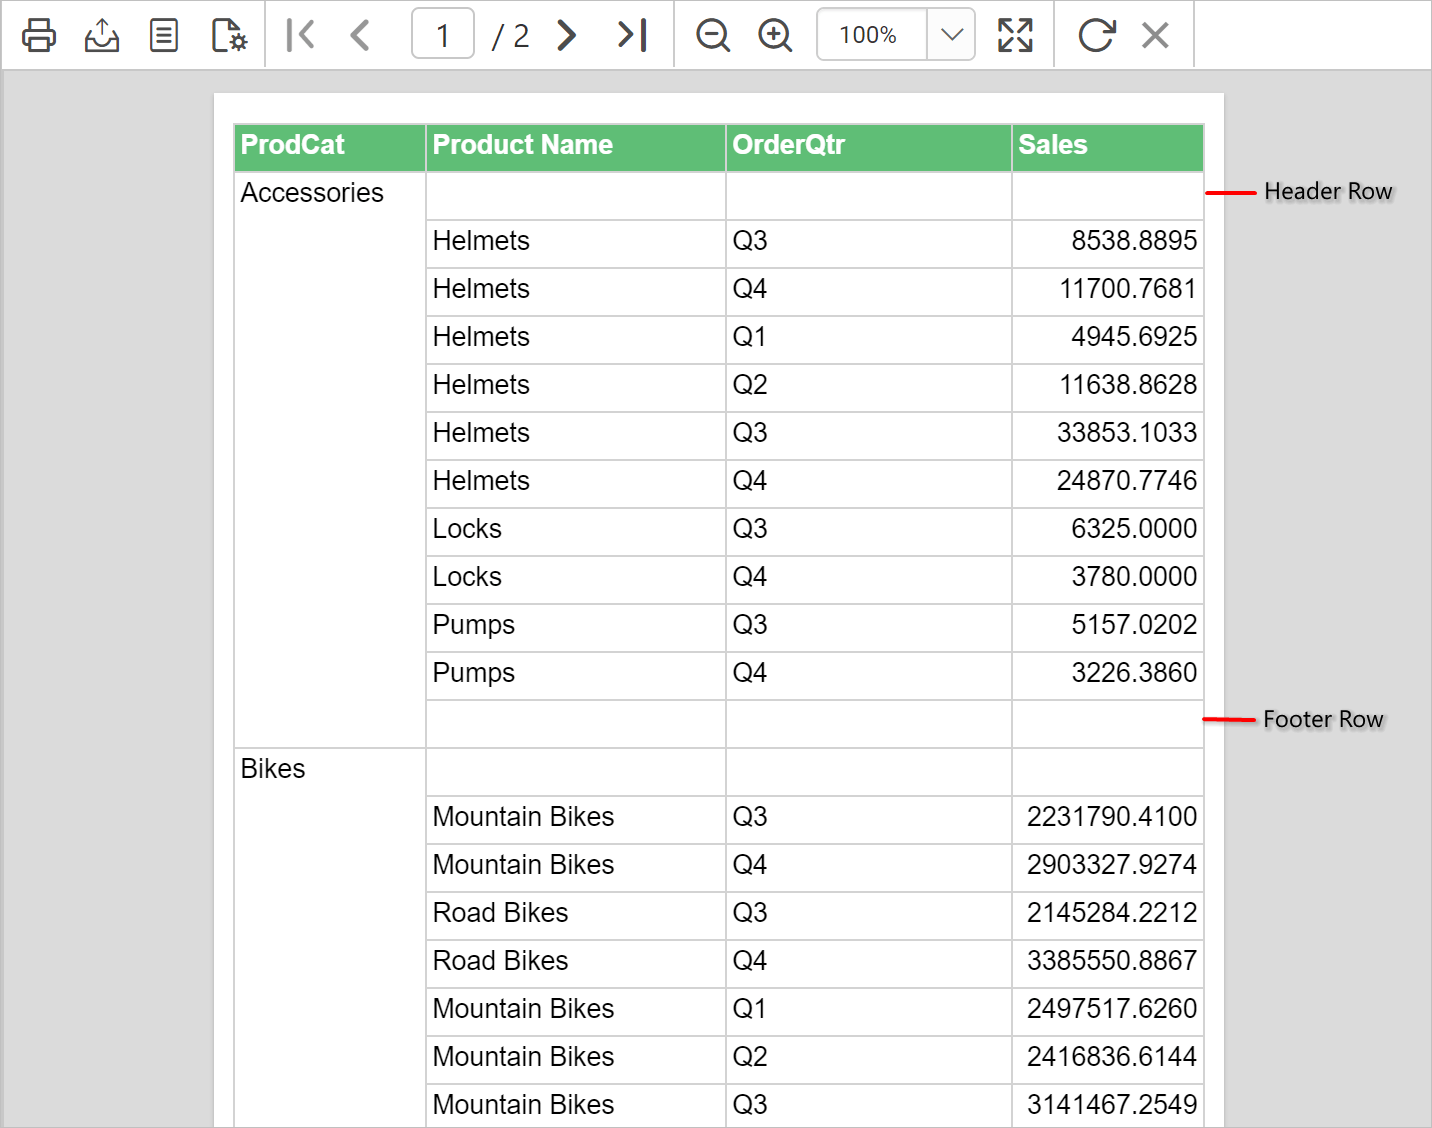
On report preview, the header and footer will be added for each group as shown below.
Format header and footer
You can display data, label content or total in the group header and footer of the tablix data region.
Merge header cells
- Select the header cells and right-click in the cell. Then, click on
Merge Cellsoption.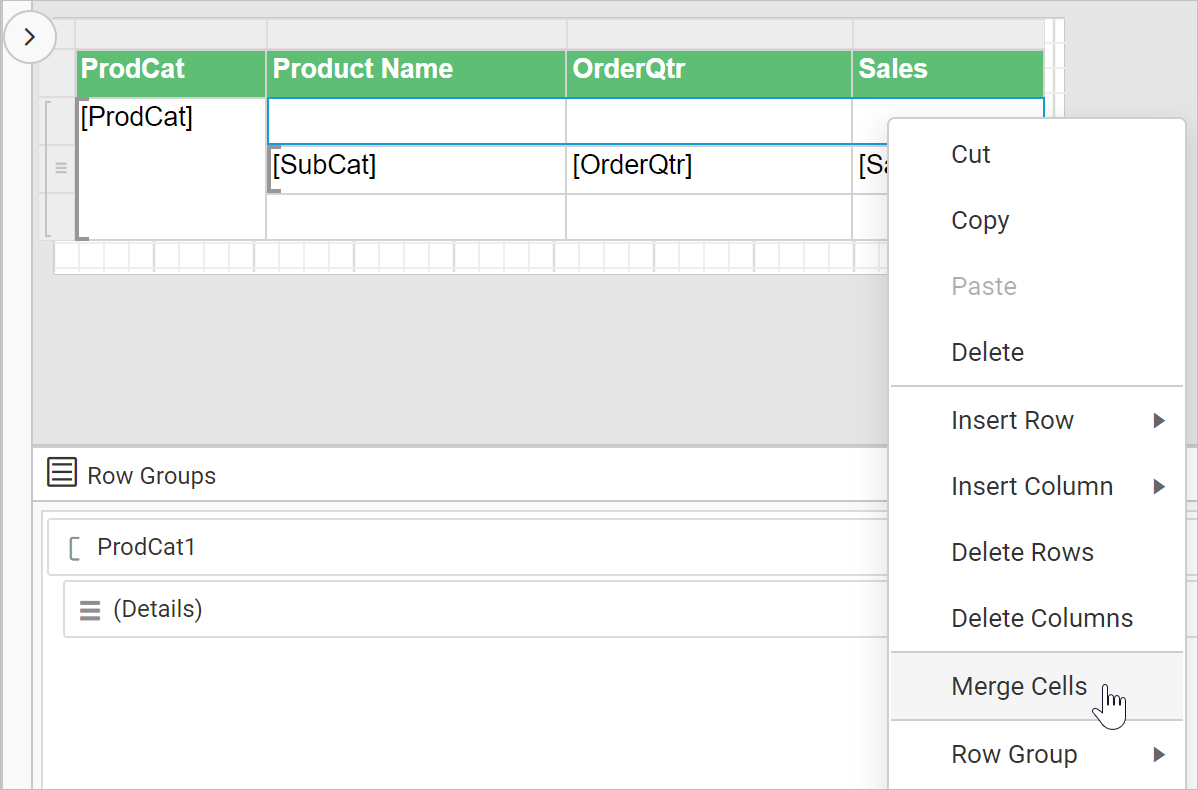
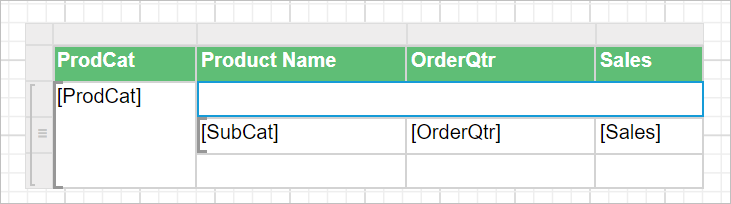
- Now, set data or label content and format the header cell as required.
Merge footer cells
- Select the first two footer cells and right-click in the cell. Then, click on
Merge Cellsoption.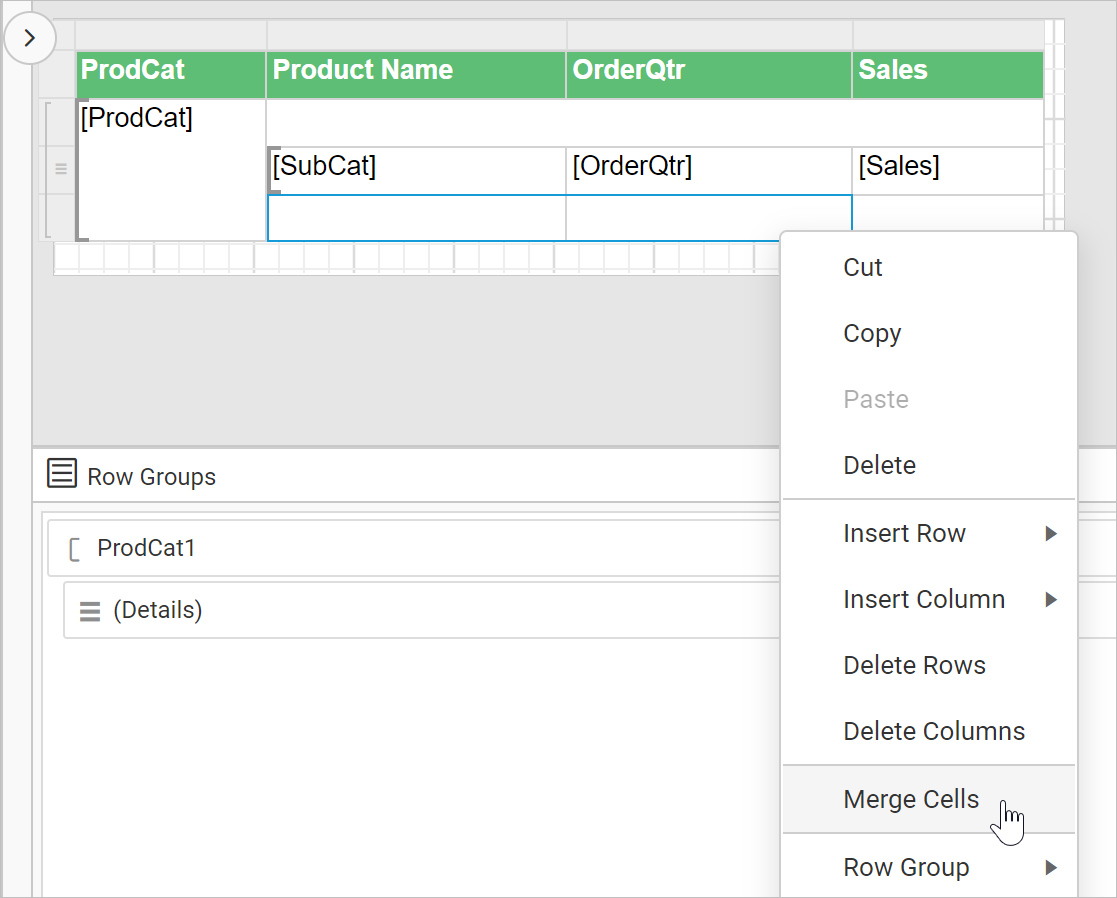
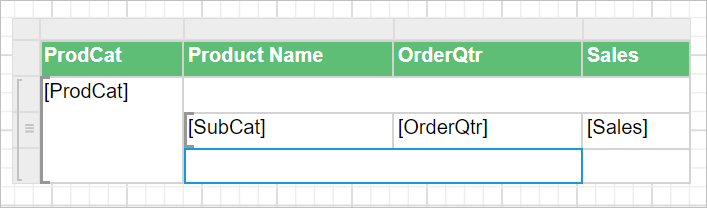
- Now, set data or label content and format the footer cell as required.
Edit footer cell content
- Edit the footer cell which is merged in the previous step and set the expression
= "Total yearly sales of " & Fields!ProdCat.Valueusing expression builder and set the font weight property asBoldin the properties panel.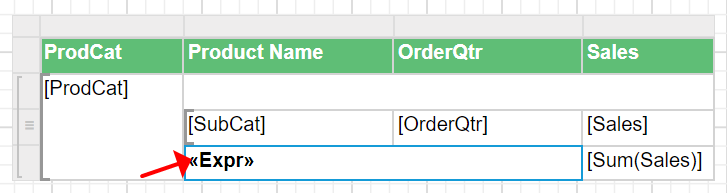
- Set
=Sum(Fields!Sales.Value)expression in the last cell, to calculate summary of sales field and set the font weight property asBoldin the properties panel.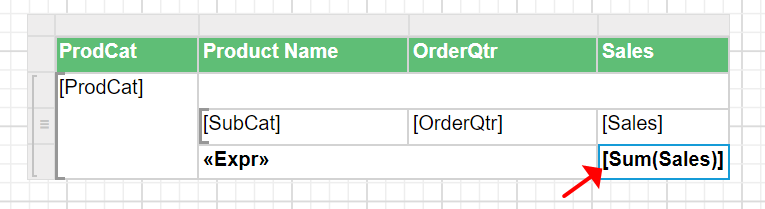
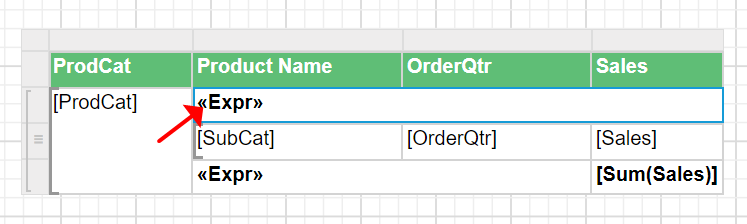
Edit header cell content
Edit the header cell and set the = "Sales Report of " & Fields!ProdCat.Value & " Category" expression using expression builder and set the font weight property as Bold in the properties panel.
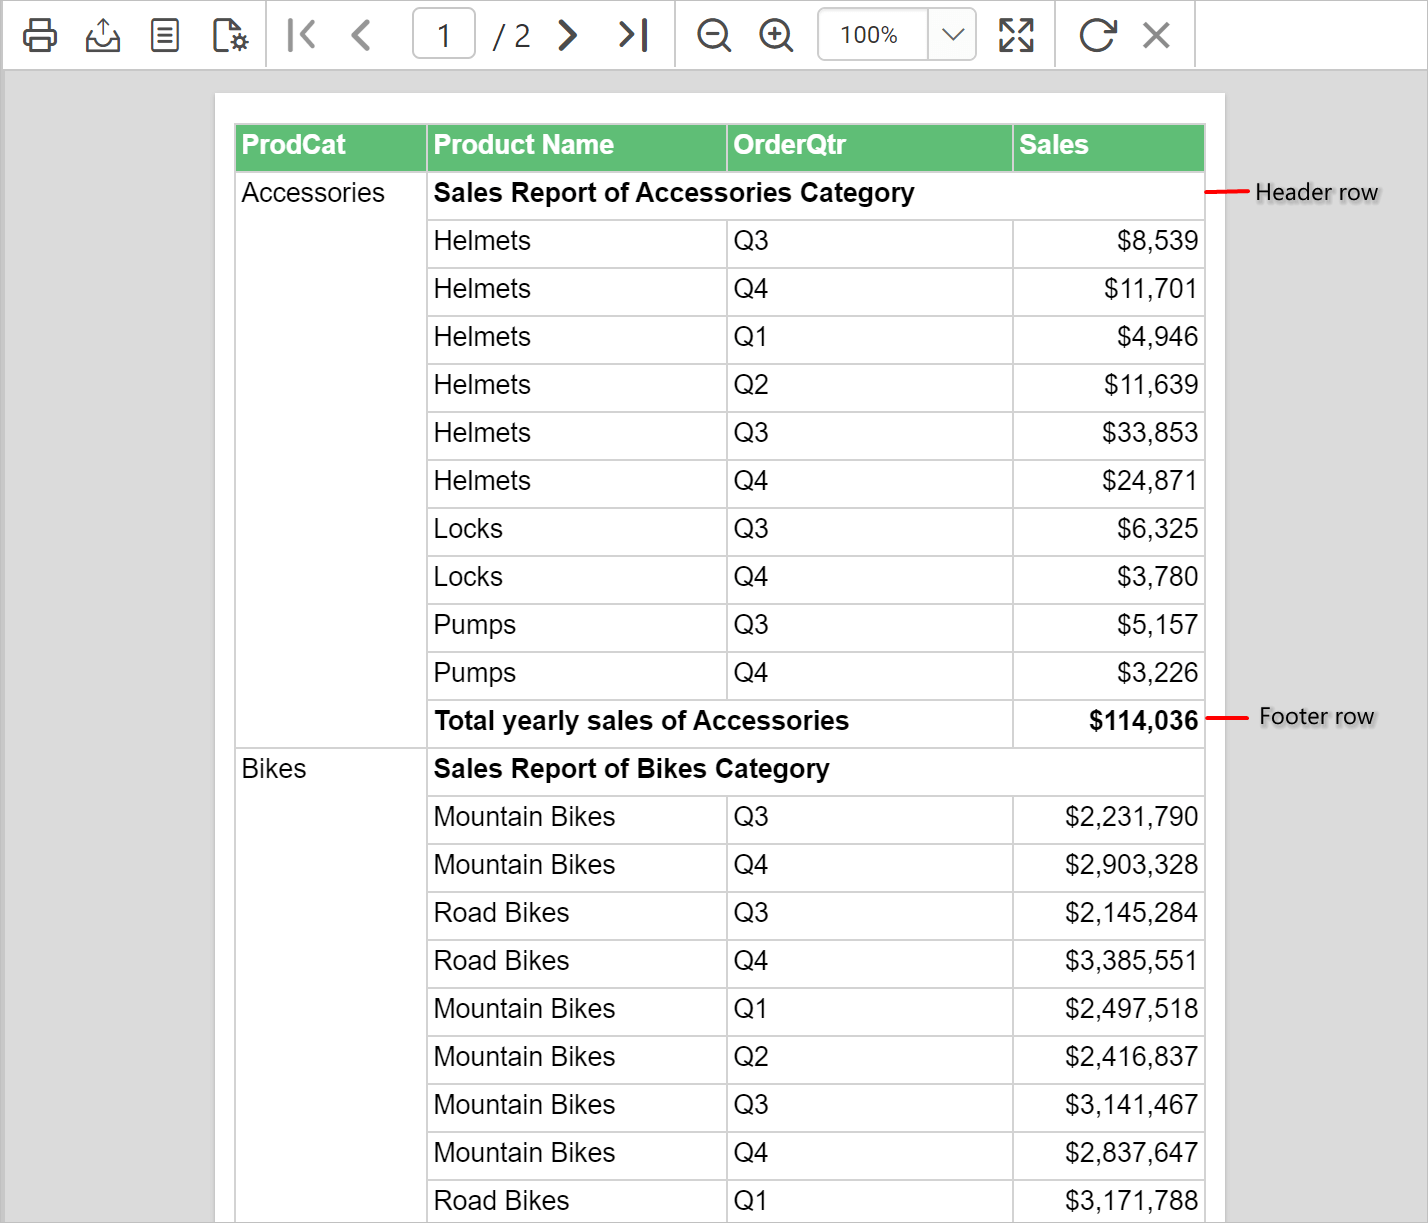
Report preview
On report preview, the header and footer will be added for each group as shown below.
Download the above report design from link.