Design SSRS Matrix Report using Tablix Wizard
This section describes the steps to design an Annual Sales Report by Country and Bank using Tablix Wizard.
Create dataset
To present data using the tablix wizard, create a dataset and bind the required data within the tablix wizard. In this design section, the following dataset query is used for dataset creation.
SELECT [Sales].[vStoreWithDemographics].[CustomerID],
[Sales].[vStoreWithDemographics].[Name],
[Sales].[vStoreWithDemographics].[ContactType],
[Sales].[vStoreWithDemographics].[Title],
[Sales].[vStoreWithDemographics].[FirstName],
[Sales].[vStoreWithDemographics].[MiddleName],
[Sales].[vStoreWithDemographics].[LastName],
[Sales].[vStoreWithDemographics].[Suffix],
[Sales].[vStoreWithDemographics].[Phone],
[Sales].[vStoreWithDemographics].[EmailAddress],
[Sales].[vStoreWithDemographics].[EmailPromotion],
[Sales].[vStoreWithDemographics].[AddressType],
[Sales].[vStoreWithDemographics].[AddressLine1],
[Sales].[vStoreWithDemographics].[AddressLine2],
[Sales].[vStoreWithDemographics].[City],
[Sales].[vStoreWithDemographics].[StateProvinceName],
[Sales].[vStoreWithDemographics].[PostalCode],
[Sales].[vStoreWithDemographics].[CountryRegionName],
[Sales].[vStoreWithDemographics].[AnnualSales],
[Sales].[vStoreWithDemographics].[AnnualRevenue],
[Sales].[vStoreWithDemographics].[BankName],
[Sales].[vStoreWithDemographics].[BusinessType],
[Sales].[vStoreWithDemographics].[YearOpened],
[Sales].[vStoreWithDemographics].[Specialty],
[Sales].[vStoreWithDemographics].[SquareFeet],
[Sales].[vStoreWithDemographics].[Brands],
[Sales].[vStoreWithDemographics].[Internet],
[Sales].[vStoreWithDemographics].[NumberEmployees] FROM [Sales].[vStoreWithDemographics]
Refer to the Create Data section and create a dataset using the above query. The
AdventuresWorksdatabase is used here.
Add matrix using tablix wizard
-
The tablix wizard is listed in the item panel under the
Data Regionscategory.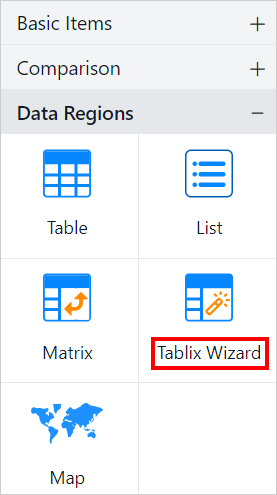
-
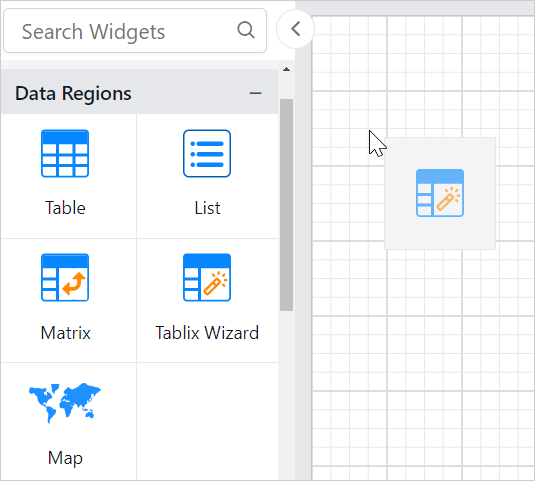
Drag and drop the tablix wizard report item into the design area from the item panel.
-
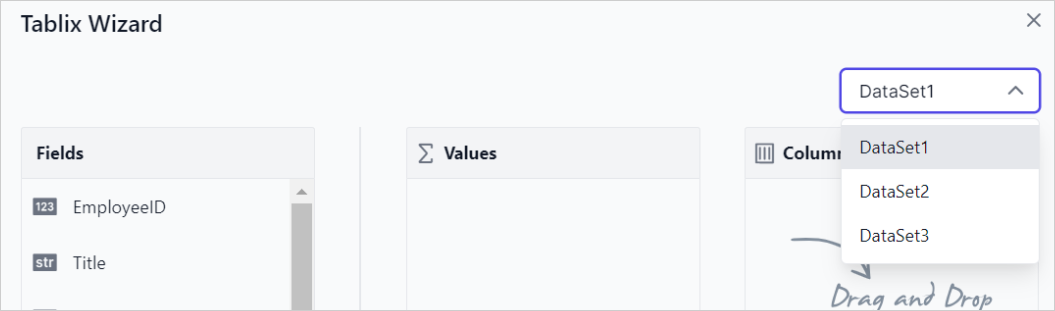
The available datasets in the report will be listed in the drop-down. Choose a dataset from the drop-down list.
-
Drag and drop
AnnualSalesinto theValuessection.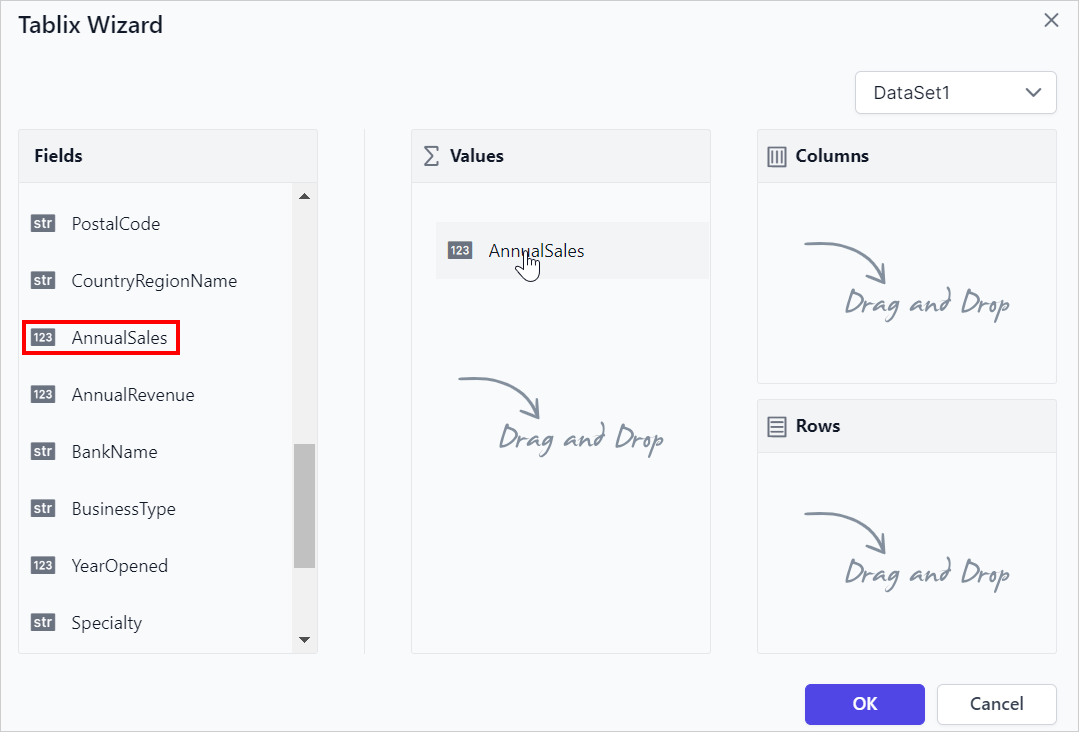
-
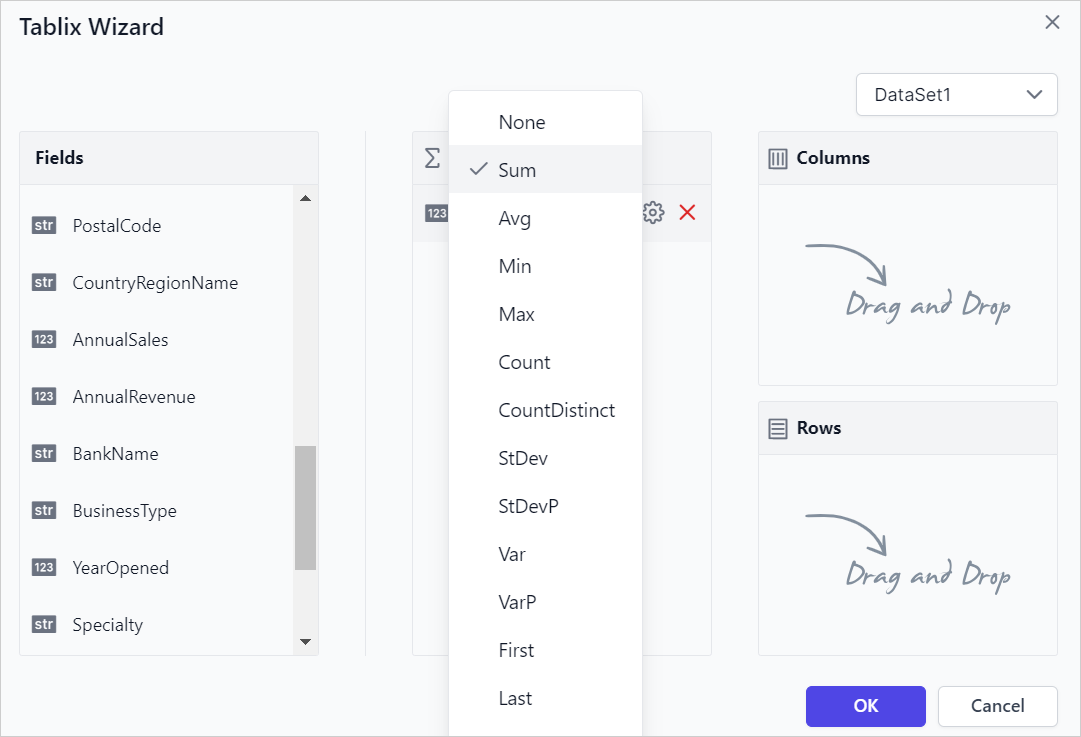
Hover on the
AnnualSalesfield to enable theSettingsicon, then click theSettingsicon (highlighted below) to open the aggregation menu.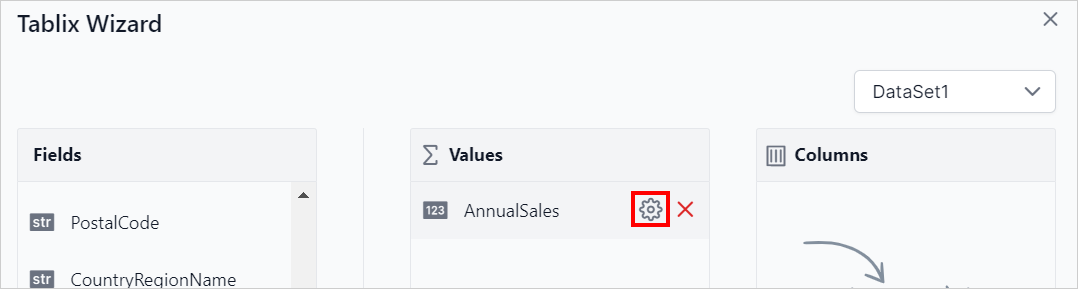
You can set the aggregation type by which you want to compute the selected value.
-
Drag and drop
CountryRegionNameinto theColumnsgroup andBankNameinto theRowsgroup.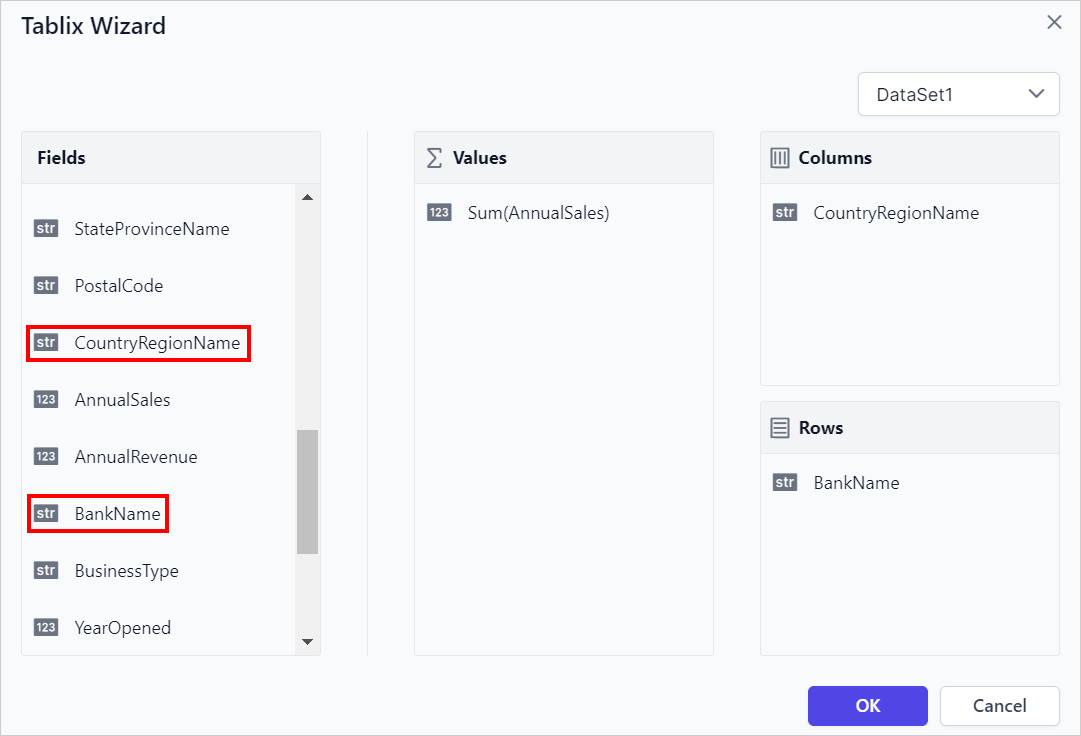
-
Click on the
Okbutton. The matrix will now be rendered on the design surface as shown below,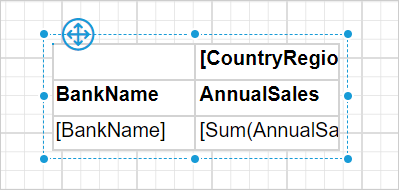
Format matrix design
In the design below, the report header has been added, and the background color and font styles in the matrix cells have been updated to enhance the report design.
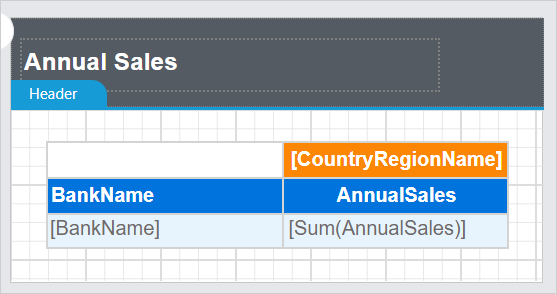
Refer to the Cell Properties section to style the matrix cells and Show or hide header and footer section to add or remove header/footer in the report.
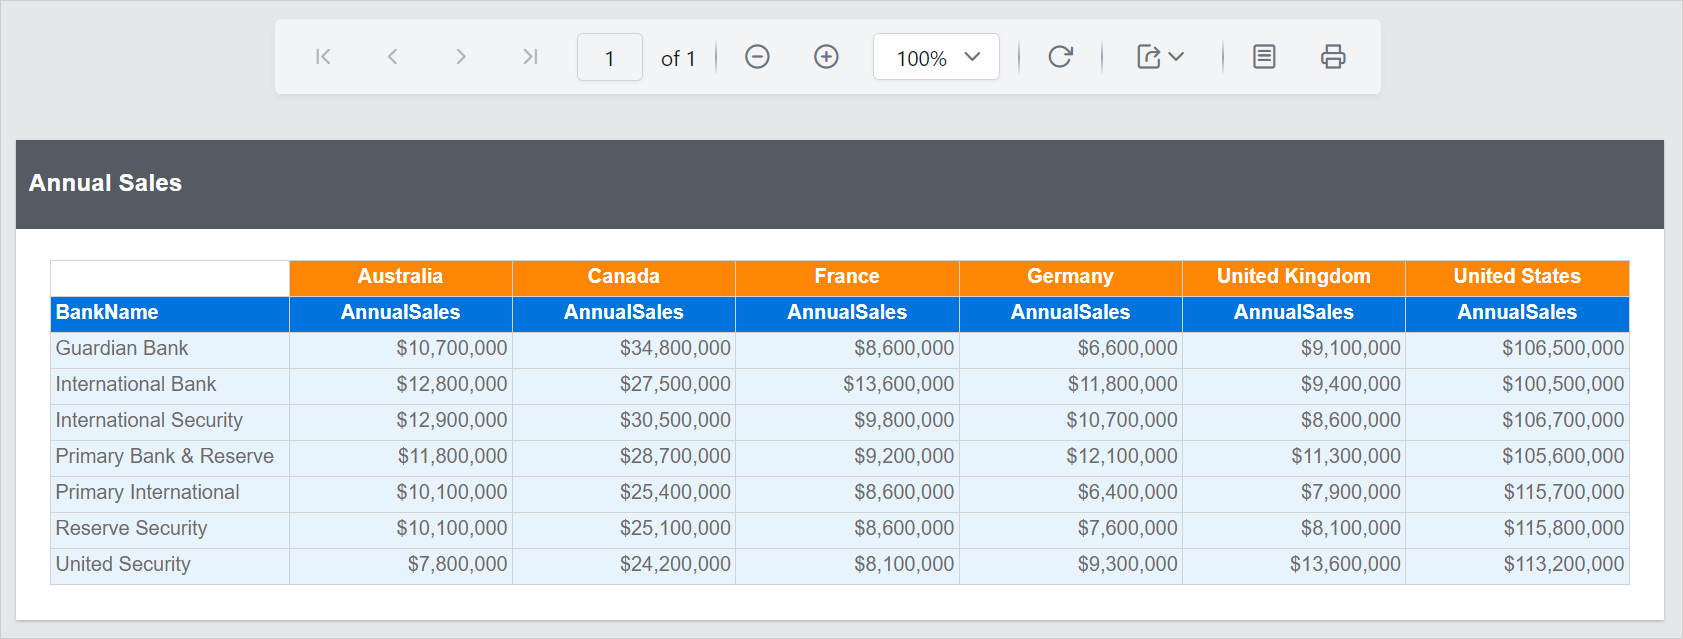
Report preview
In the report preview, the Annual Sales Report will be displayed as shown below,
Download the above report design from this link.