Design ssrs sparkline report using table
This section describes the steps to design Sparkline report using SSRS table report item.
Create dataset
The following dataset query is used for this Sparkline report.
SELECT Prodcat.EnglishProductCategoryName,
              prodSubcat.EnglishProductSubcategoryName,
              prod.EnglishProductName,
              prod.Color,
              fact.[TotalProductCost],
              fact.SalesAmount,
              fact.TaxAmt,
              fact.[OrderDate],
              fact.[ShipDate]
FROM dbo.DimProduct as prod
   INNER JOIN  dbo.DimProductSubcategory AS prodSubcat ON
               prod.ProductSubcategoryKey = prodSubcat.ProductSubcategoryKey
   INNER JOIN  dbo.DimProductCategory AS Prodcat ON
                prodSubcat.ProductCategoryKey = Prodcat.ProductCategoryKey
   INNER JOIN  dbo.FactInternetSales AS fact ON
                 fact.ProductKey = prod.ProductKey
Refer Create Data section and create dataset using the above query.
AdventureWorksDW2014database is used here.
Add sparkline report item
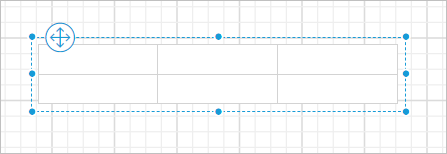
- Drag and drop table report item to the design area.
- Assign dataset to the table.
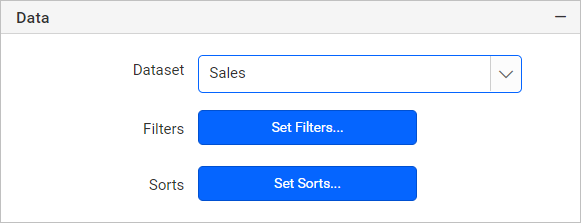
- Assign
EnglishProductSubcategoryNamefield in the first cell as shown below.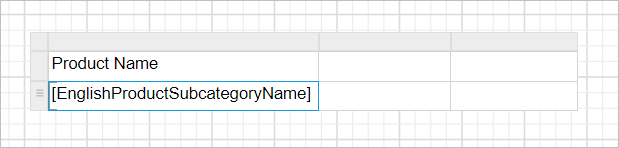
- Click on
Details groupinRow Groupspane, now the respective tablix member properties will be listed in the properties panel.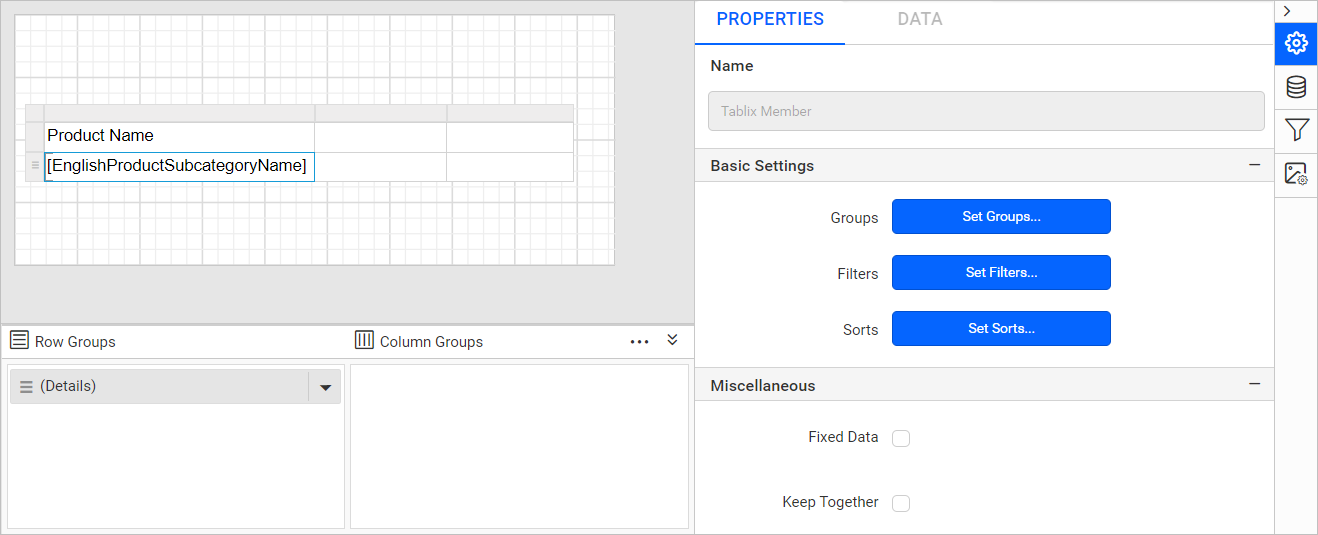
- Click on the
Set Groups...button in the properties panel. Now, theGroupingdialog will be opened like below.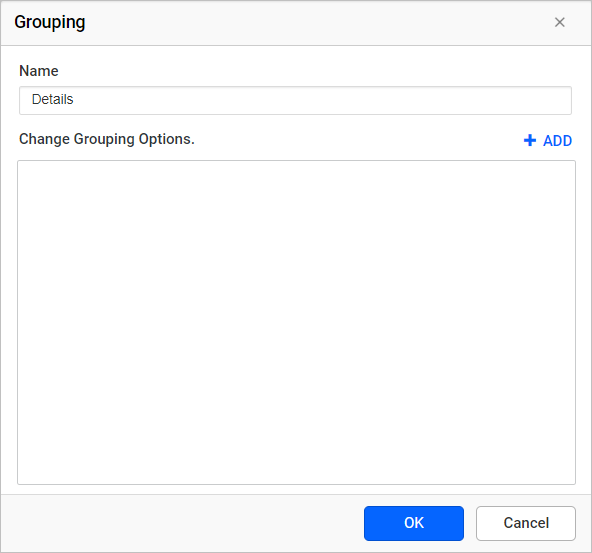
- Click on
Addbutton and selectEnglishProductSubcategoryNameand click OK.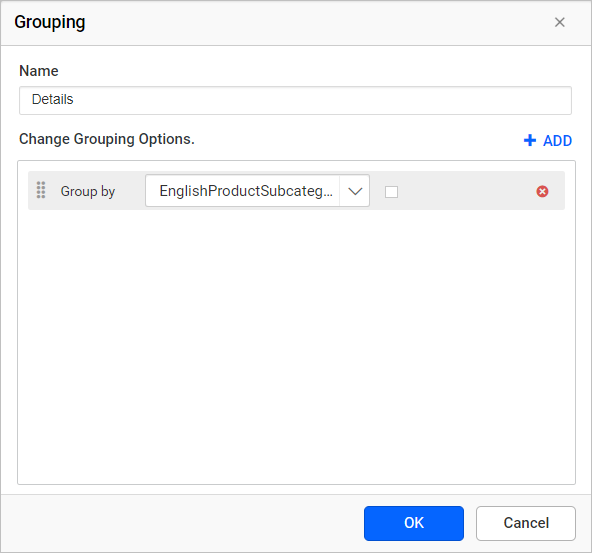
- Assign
Salesfield in the second cell as shown below.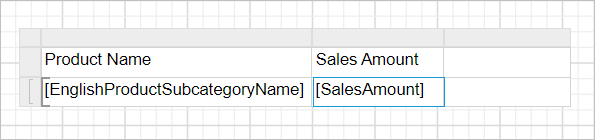
- Now select the
Salestext box and assign the following expression=Sum(Fields!SalesAmount.Value)in the cell.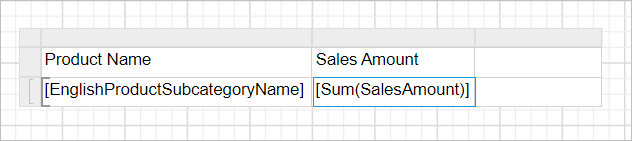
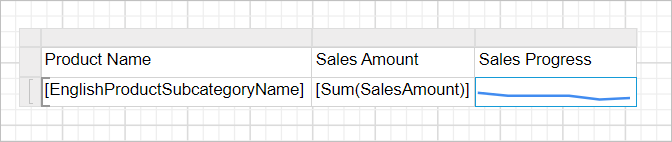
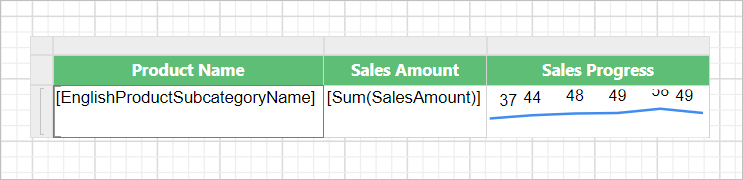
- Drag and drop the sparkline report item into last cell of the table as shown below.
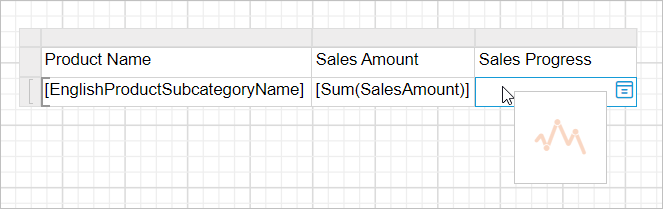
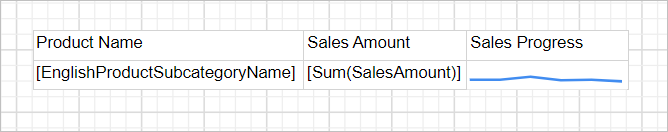
Now, the report design will look like below.
Cannot insert a sparkline into a detail cell. Detail members can only contain the static inner members.
Assign data
- Select the cell containing sparkline report item and switch to
DATAtab in properties panel.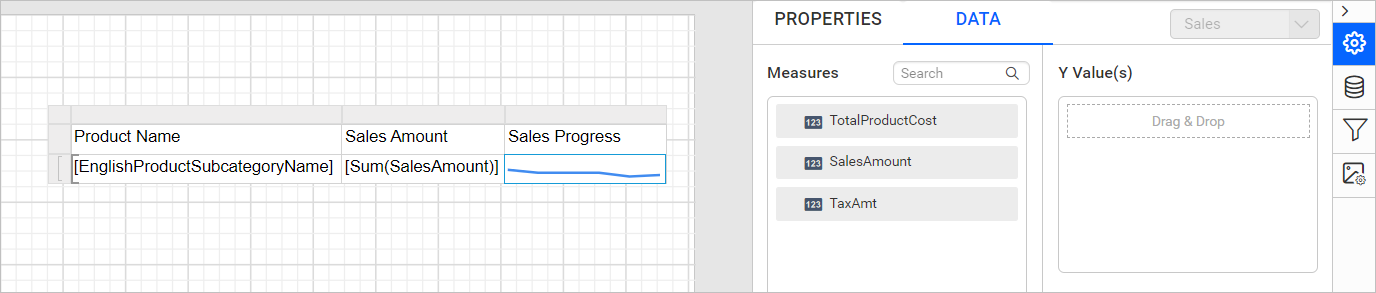
- Drag and drop
TotalProductCostfield intoY-Valuessection as shown below.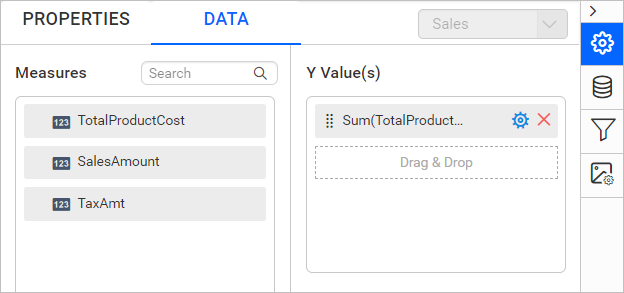
- Drag and drop
OrderDatefield intoColumnsection as shown below.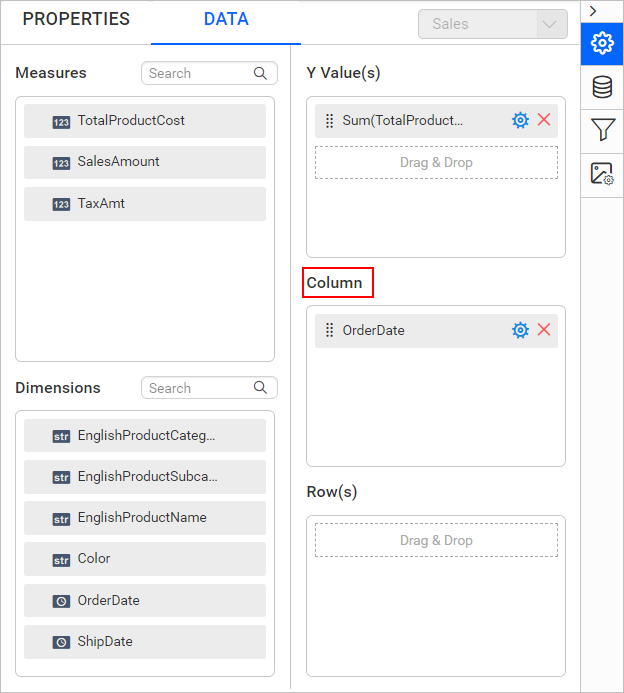
Now, the report design will look like below.
Configure properties
- Now, switch to the
PROPERTIEStab in the properties panel. - Choose the
Salesseries in theChoose Seriesdropdown.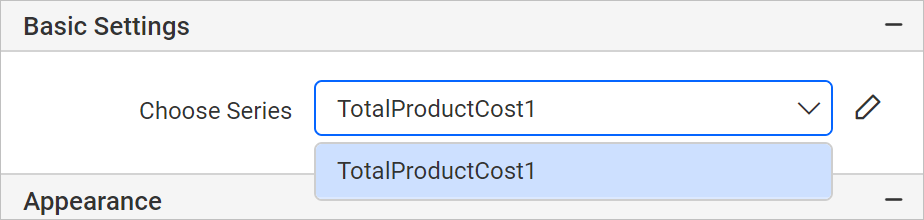
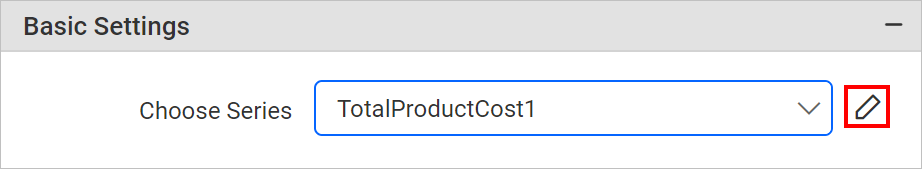
- Click on the edit icon to open series properties.
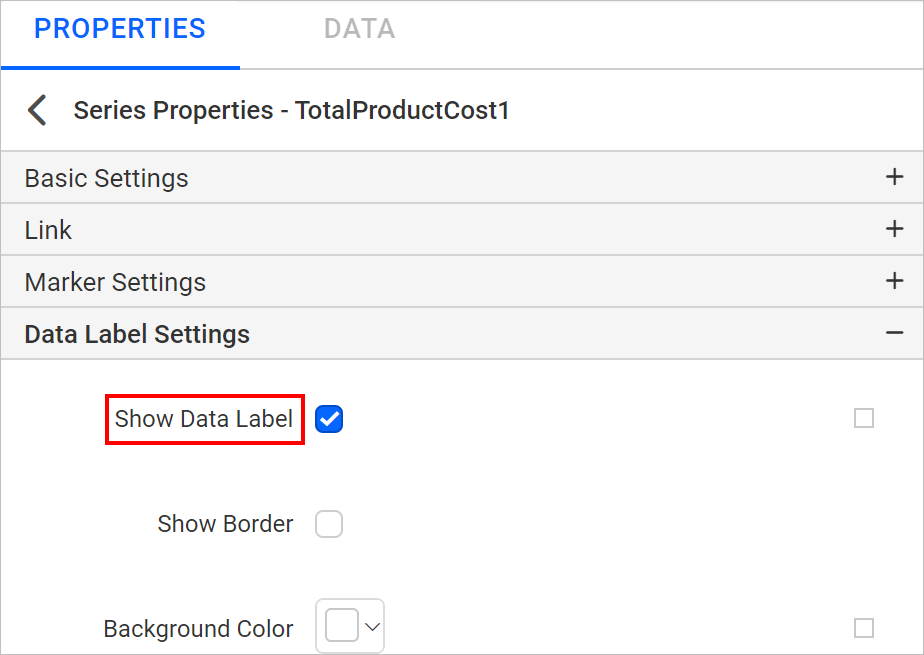
- Under data label settings category, enable Data Label property checkbox.
- Format the numbers produced by the
Data labels, usingFormatproperty. Set the'$'#,0;('$'#,0)as value format property field.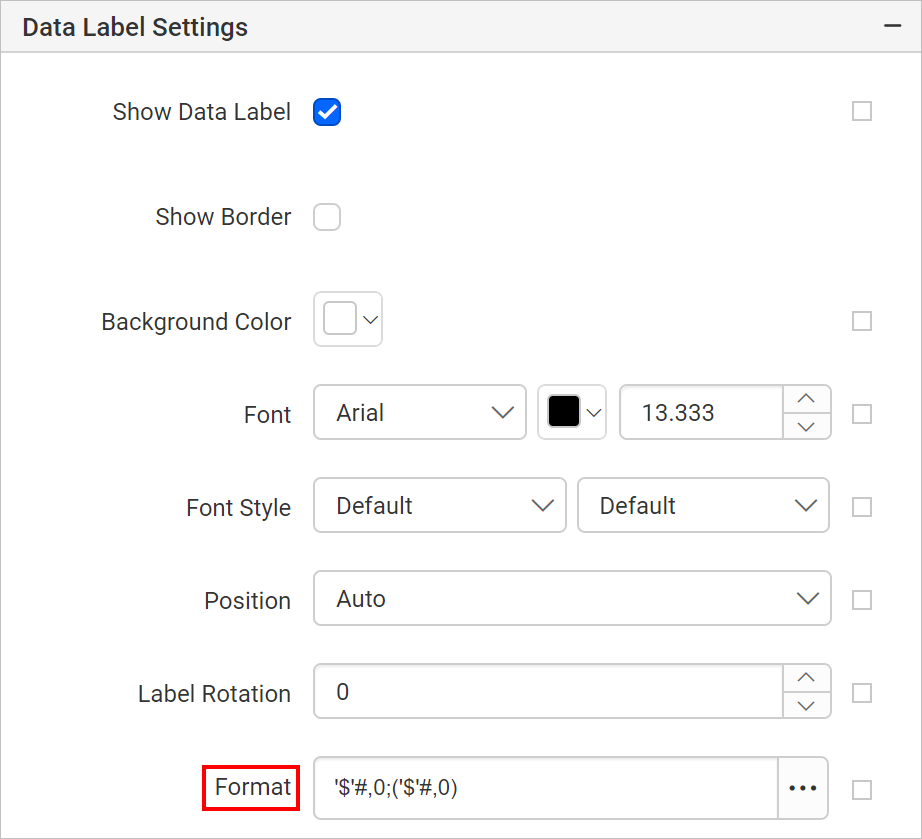
- In the below design background color and font styles are changed in table cells to improvise the report design.
Refer the Cell Properties to style the table cell.
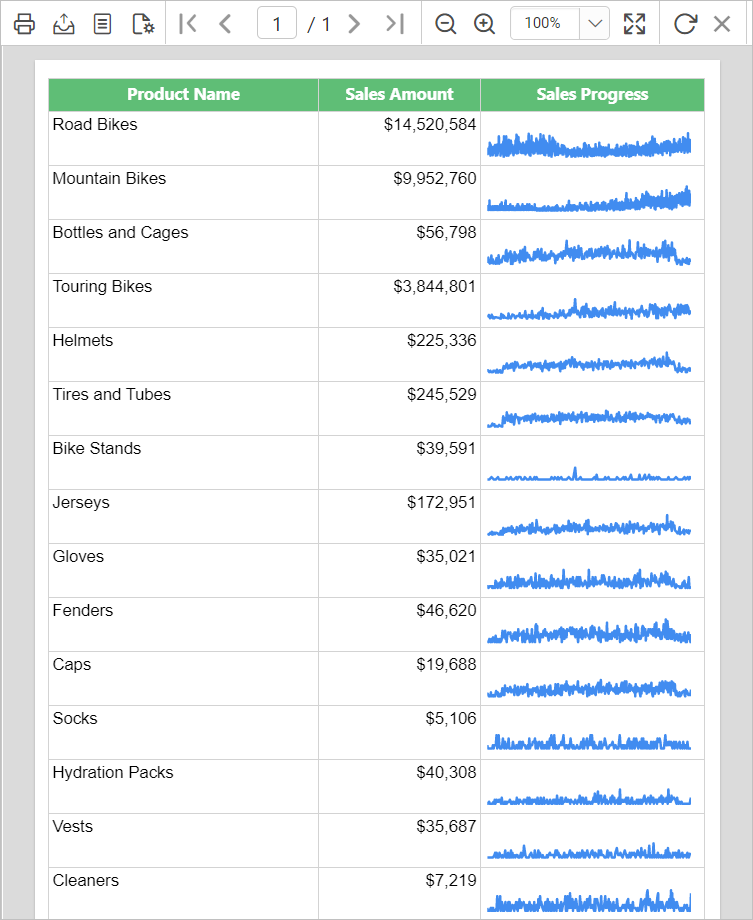
Report preview
On report preview, the report is showing sales amount progress from start year to till end.
Download the above report design from the link
CONTENTS
CONTENTS
Thank you for your feedback and comments.We will rectify this as soon as possible!