Gauge
Gauge report items are used to visualize the key performance indicators (KPIs) that track the amount of progress made towards achieving the targets or goals. When placed inside a table or matrix, it illustrates values inside every cell.
Gauge types
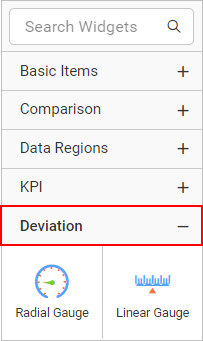
There are two types of gauges, namely Linear and Radial. These are listed in the item panel under the Deviation category.
Note: Gauge report items support configuration of only a single data point for the pointer, scale, and range properties.