Managing Max Data Count for Chart Report Items
The MaxDataCount property allows you to set a limit on the maximum number of data points that can be displayed in a chart. When handling millions or billions of data points, rendering charts in the preview can take significant time, potentially leading to UI crashes.
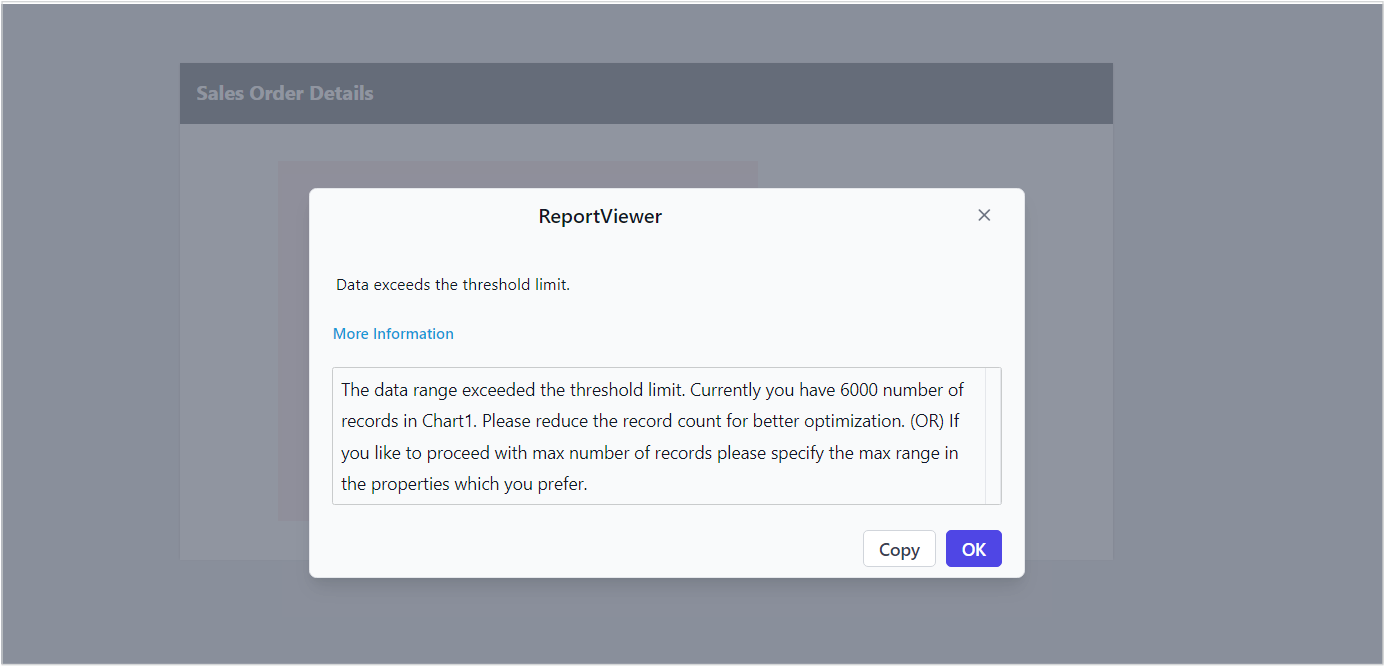
To address this, we introduced the MaxDataCount property, which helps prevent such issues by displaying a user-friendly error message when the threshold limit is exceeded. Based on this message, users are intimated and then can apply filters to the dataset to optimize performance and ensure smooth report rendering.
NOTE: This user-friendly message is applicable only in the designer UI, ensuring that users are informed at design time to make necessary adjustments for smooth report generation.
How to Configure the Max Data Count Property
Select the chart and go to the Properties pane, then navigate to the Preview Data Limit section.
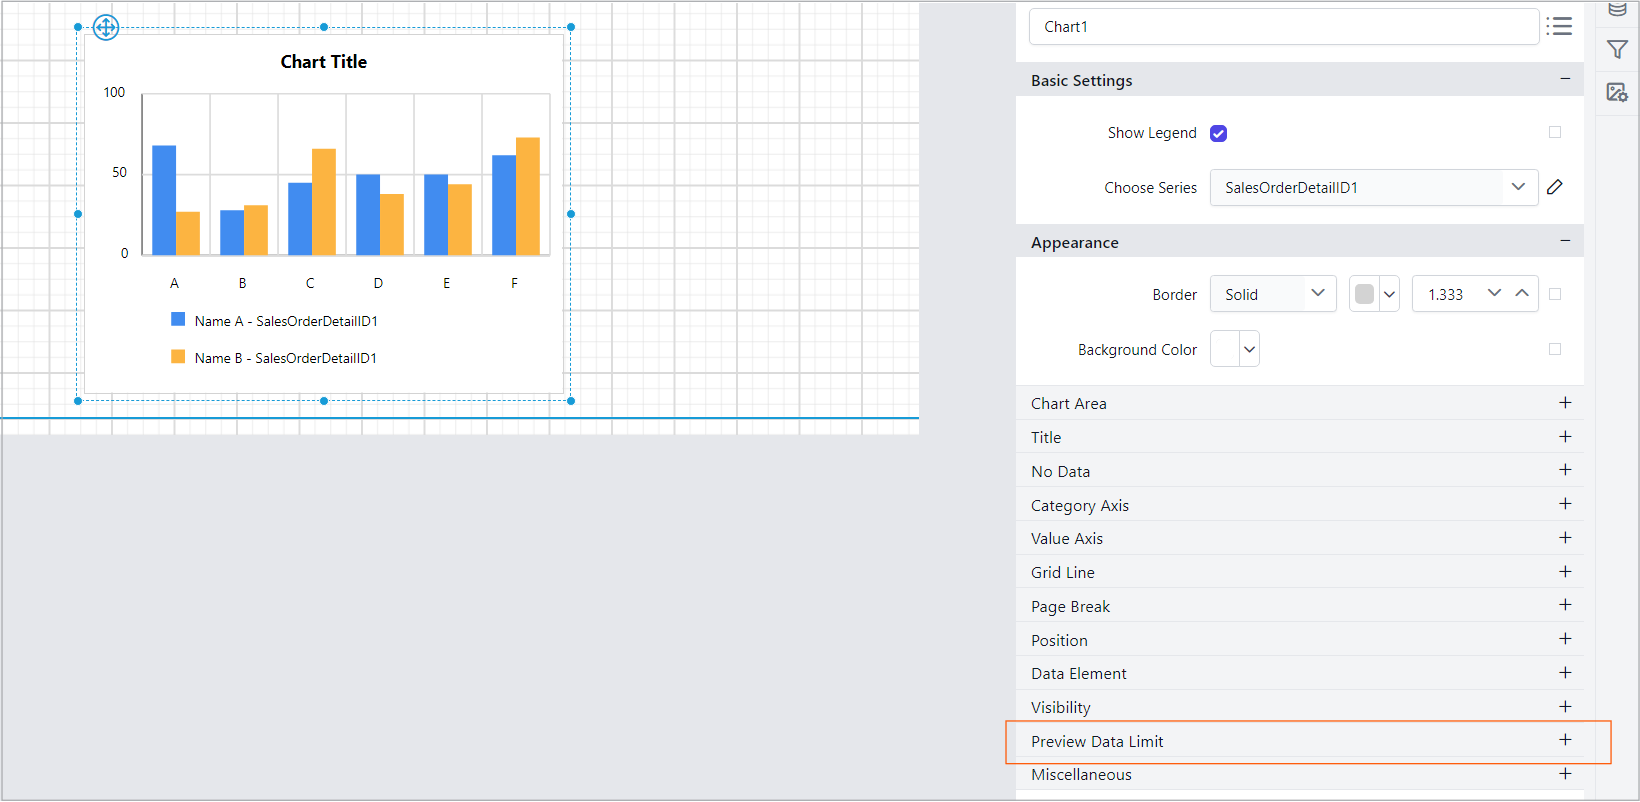
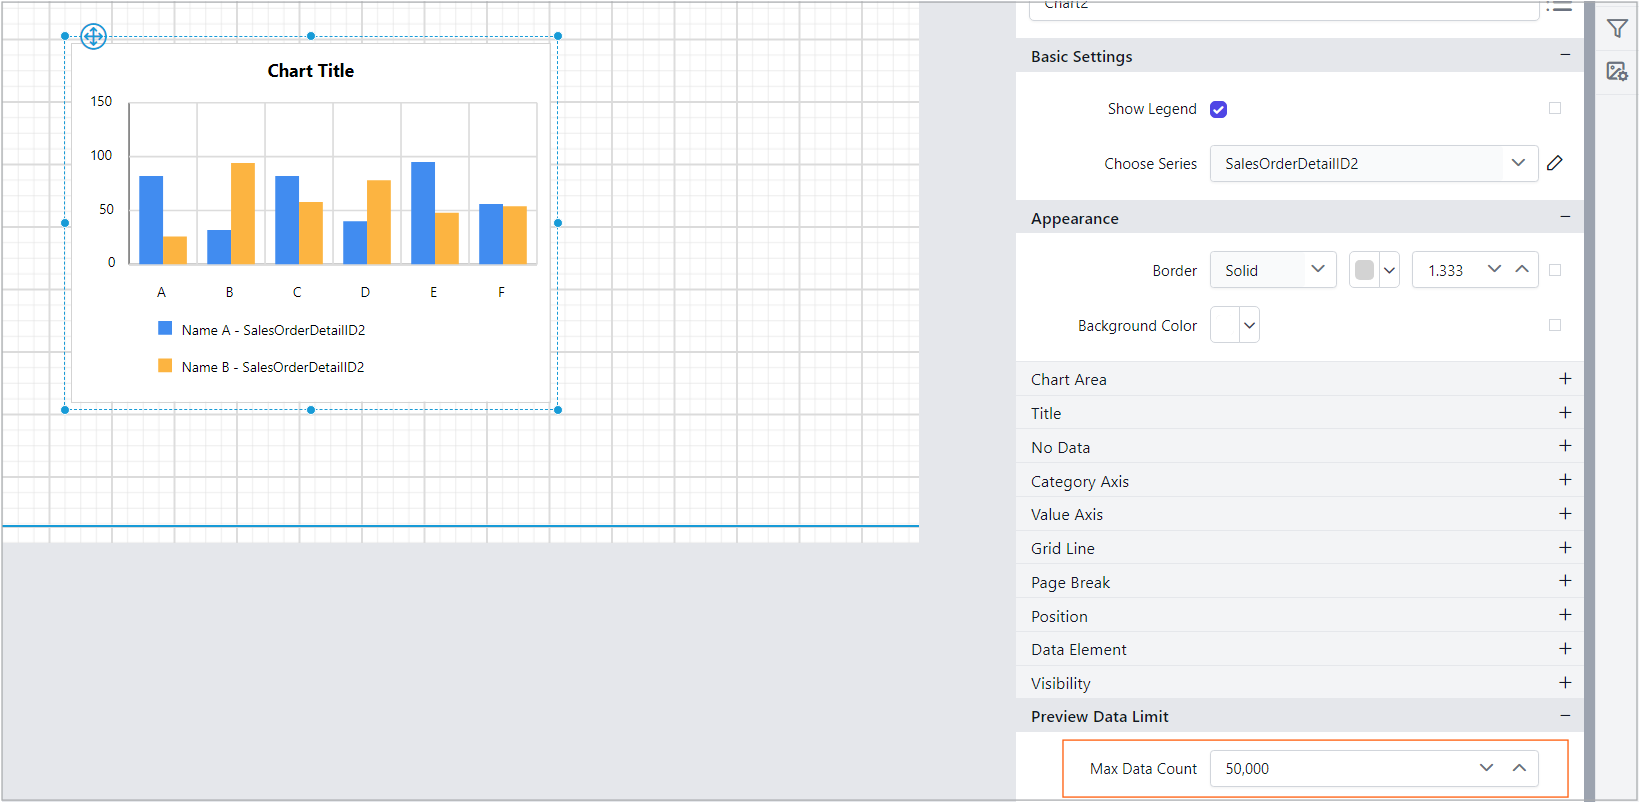
Set a Max Data Count for the chart report item.
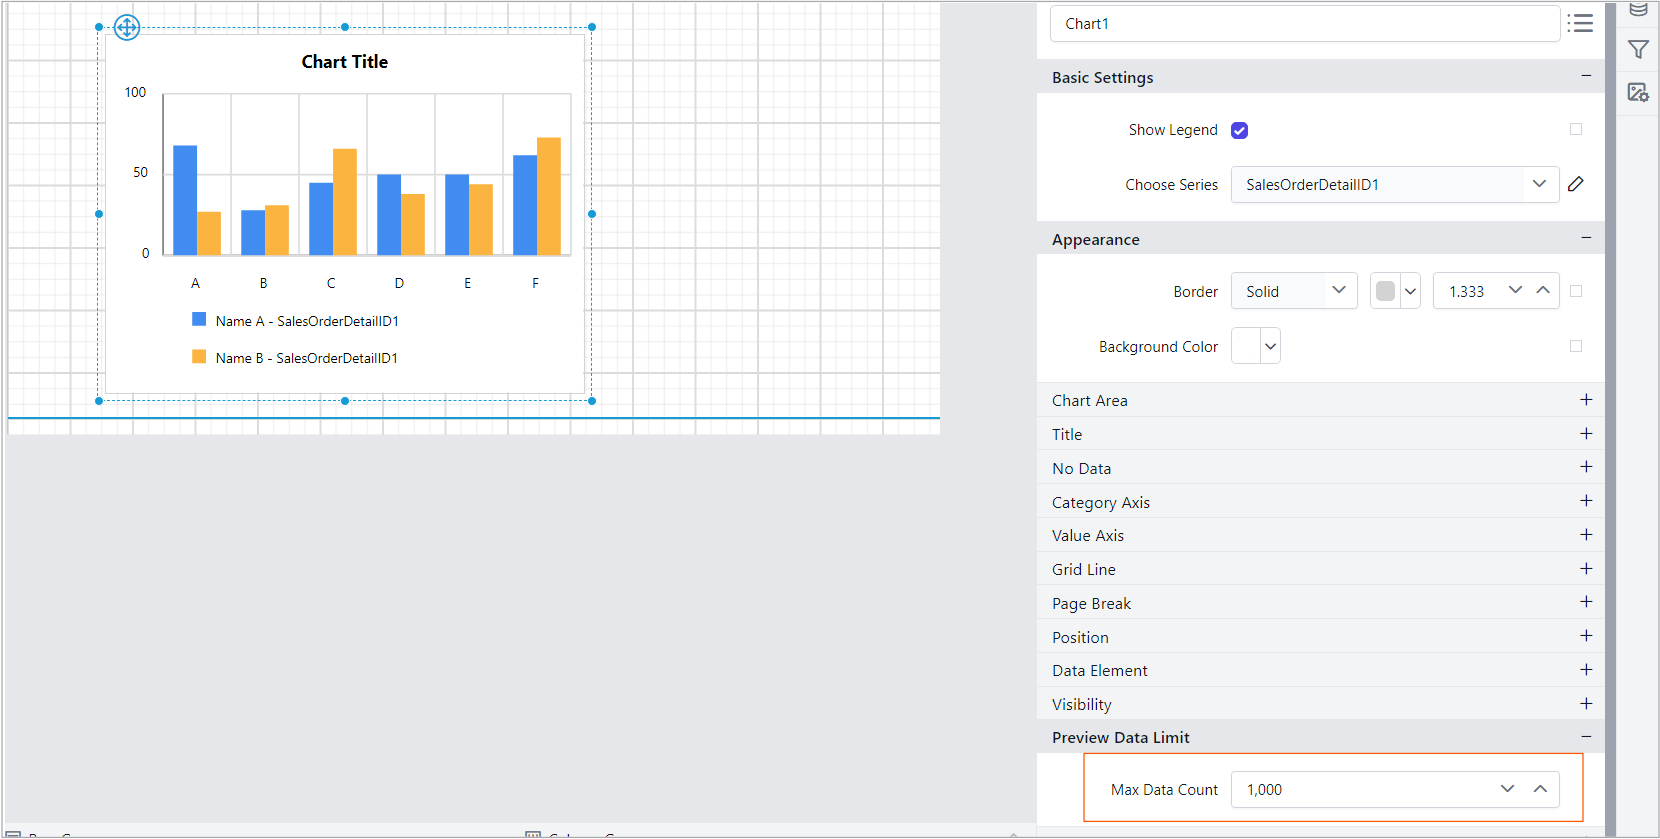
The default value for MaxDataCount is as follows:
If the data exceeds the Max Data Count limit, a user-friendly error message will be displayed in the designer UI, indicating that the data exceeds the allowable range.
Best Practices
- For smaller datasets, use the default Max Data Count setting for optimal performance.
- For larger datasets, adjust the property only if necessary to avoid design-time or runtime performance issues and consider filtering your data source to reduce the data count to faster the rendering process.
By leveraging the MaxDataCount property, you can create efficient and user-friendly reports that balance performance and data visualization.