Chart Marker
Data markers are used to provide information about the data point to the user. You can add a shape and label to adorn each data point.
Show or hide marker
To show/hide marker in the chart series, toggle the Show Marker checkbox in the properties panel.

If you enable the Show Marker checkbox, the marker will displayed in the respective series of chart. In the Choose Series drop-down Sales1 series is selected, so the marker is enabled for that specific series in the chart design.
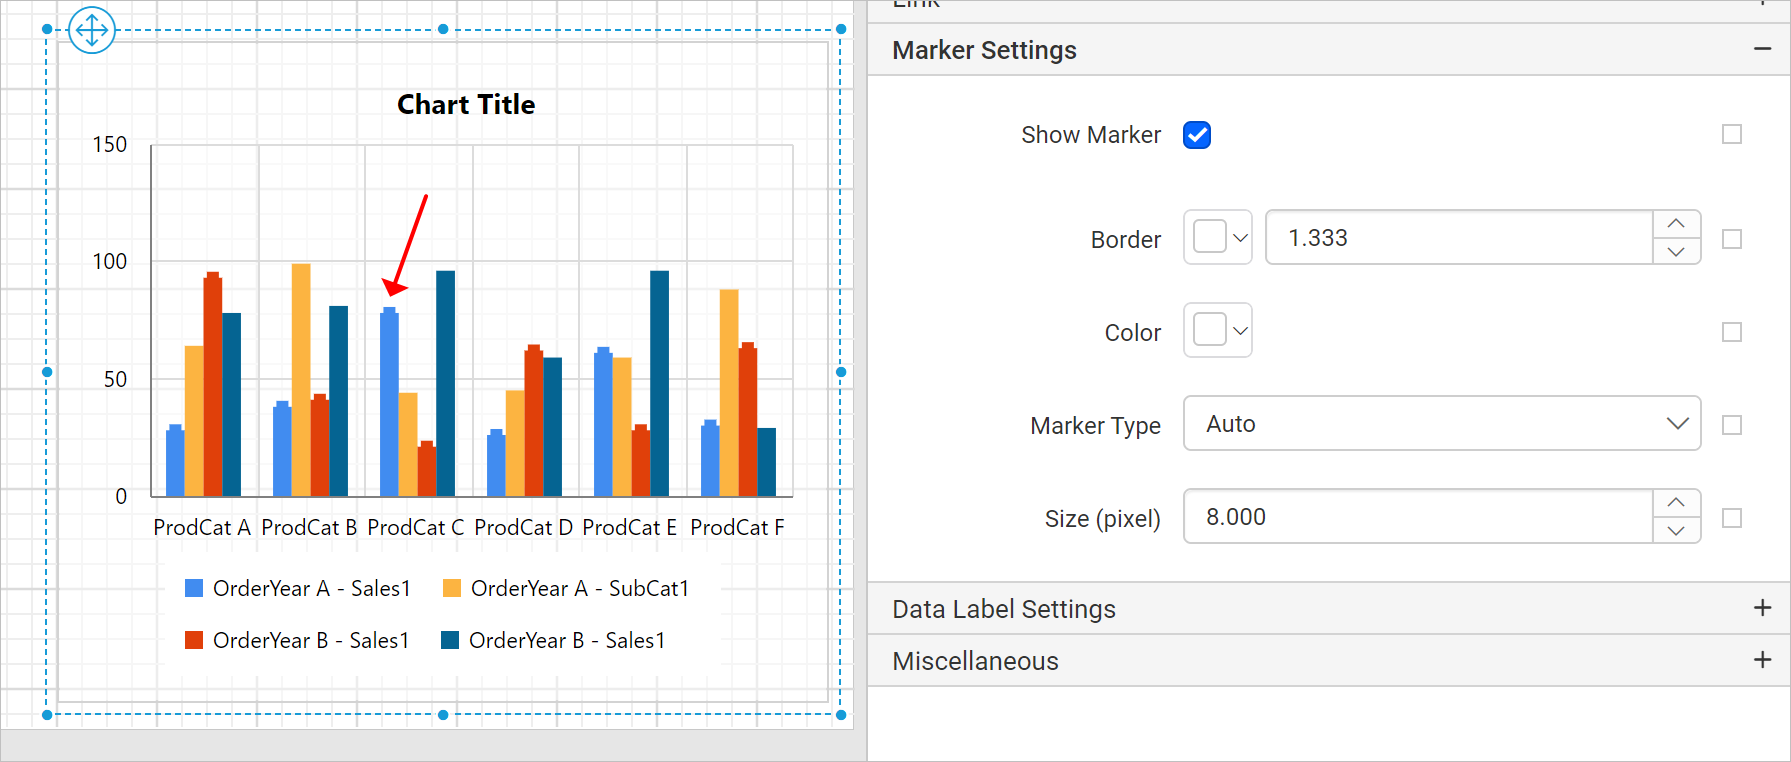
You can also enable or disable the marker based on dynamic values, by using the Expressions. Refer Set Expression and Reset Expression section to open set/reset expression menu in properties panel.
Border
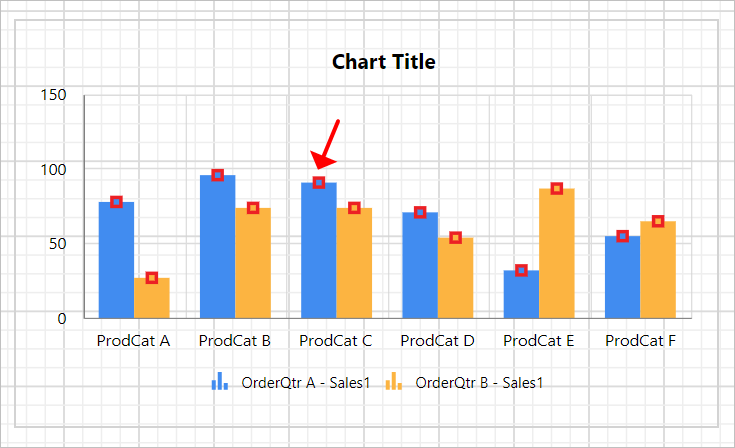
Border property can be used to set the border color and width for the data marker in the chart design.

In the below snap, the border color and width is applied to the markers in the chart design.
Color
Color property can be used to set the color for the marker.
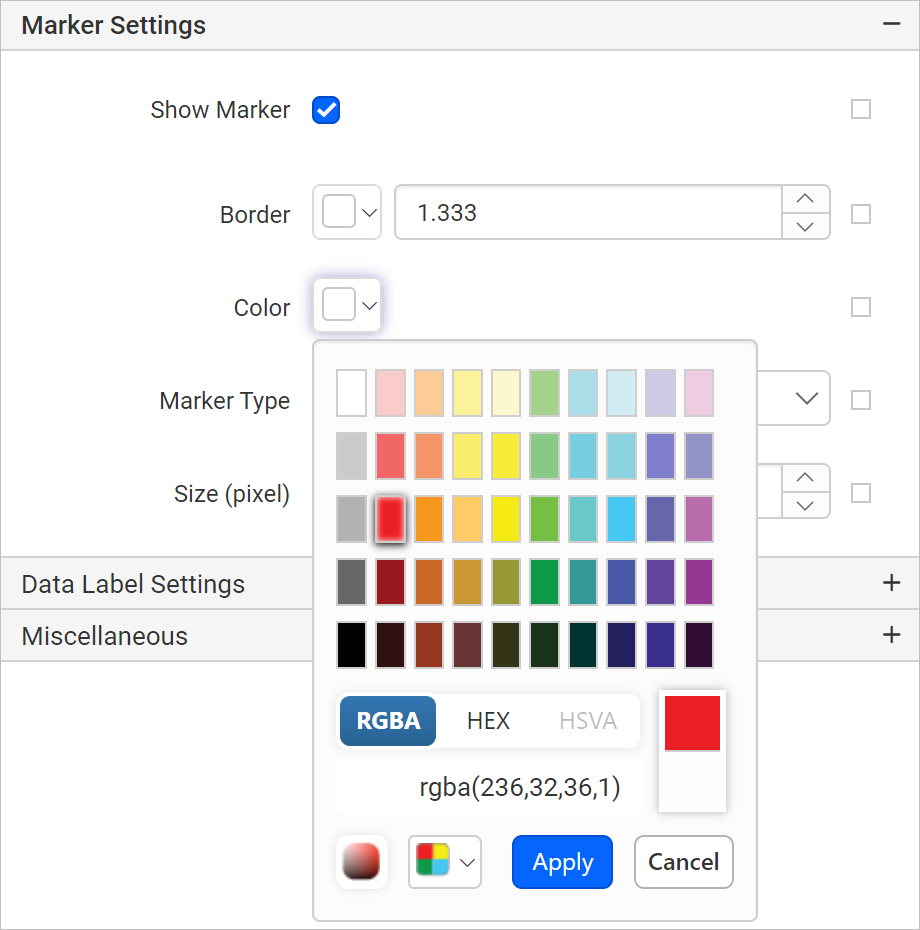
Now, the color property will be applied to the marker in the chart design.
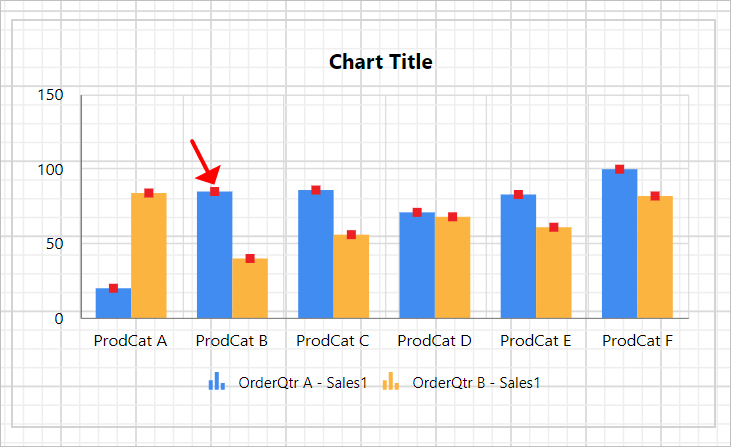
You can also apply marker color based on dynamic values, by using the Expressions. Refer Set Expressions and Reset Expressions section to open set/reset expression menu in properties panel.
Marker type
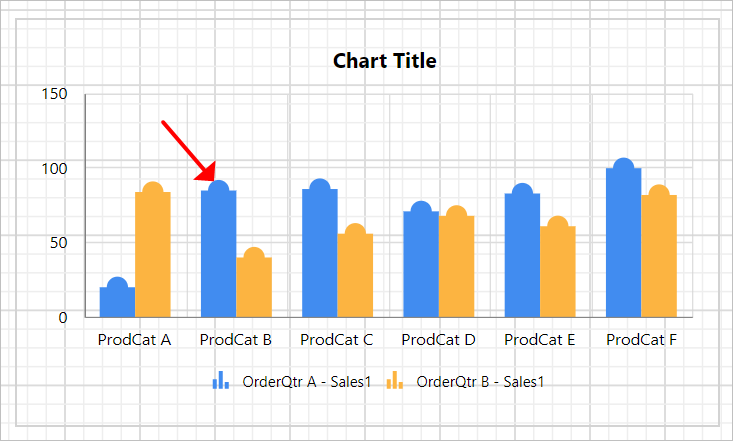
There are different shapes you can add to the chart marker by using the Marker Type property such as rectangle, circle, diamond etc. Choose the required shape in the drop-down,
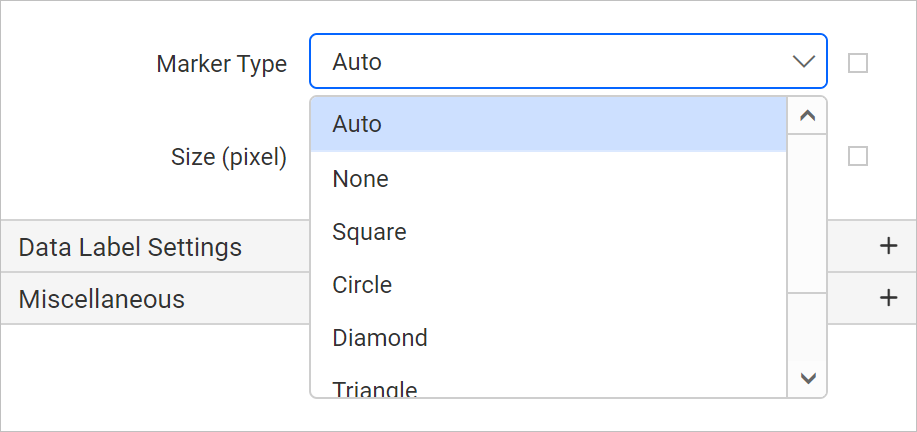
In the below design, Circle shape is applied to the marker.
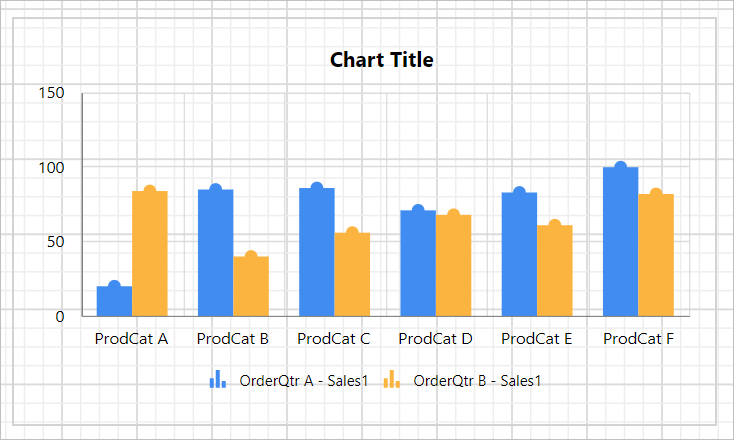
You can also apply marker shapes based on dynamic values, by using the Expressions. Refer Set Expressions and Reset Expressions section to open set/reset expression menu in properties panel.
Size
Size property can be used to customize the size of the marker in the chart design.
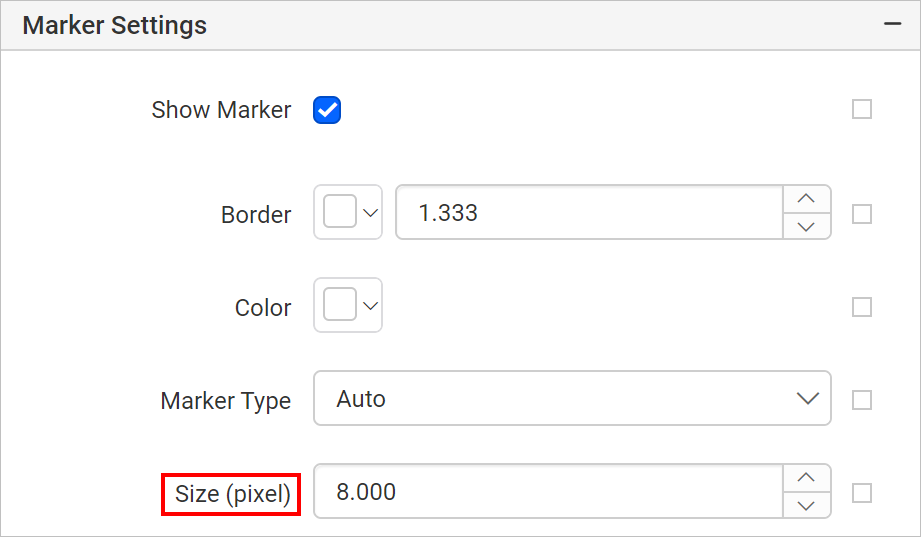
Increase or decrease the size value in the size property.
