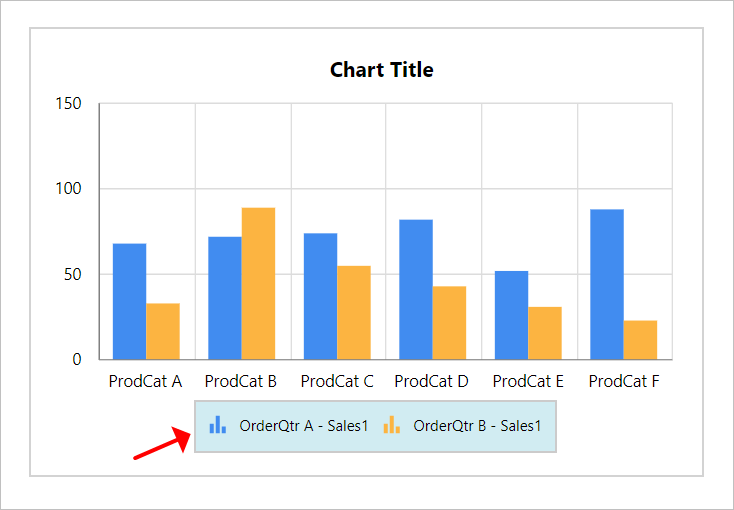
Chart Legend
A Legend is a text used to describe the data plotted. This allows you to toggle the visibility of legend in chart and also customize the legend appearance in chart design. This property is listed under the basic settings category in the chart properties panel.
Show or hide legend
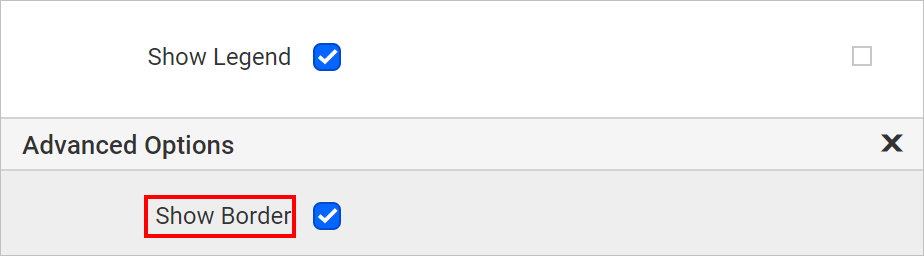
To show/hide legend in the chart surface, toggle the Show Legend checkbox in the properties panel.
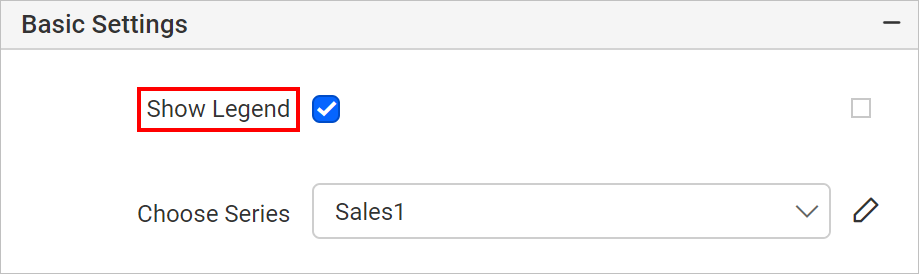
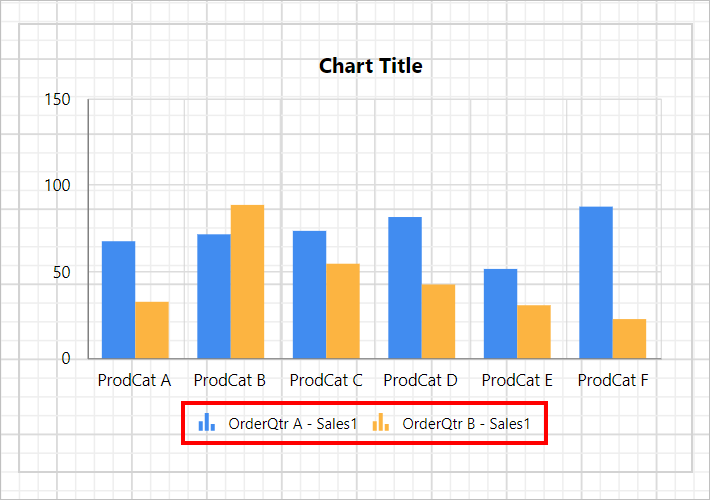
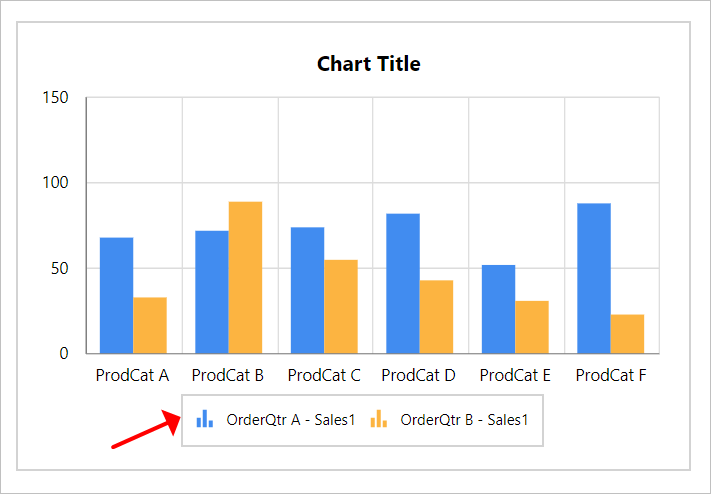
If you enable the Show Legend checkbox, the chart legend will be displayed in the bottom position of chart area.
You can also enable or disable the legend based on dynamic values, by using the Expressions. Refer Set Expression and Reset Expression section to open set/reset expression menu in properties panel.
Format legend
You can customize the legend appearance through the properties provided in the Advanced menu of show legend property. Click on the square icon in the right side of the Show Legend checkbox and click on Advanced option in the menu.
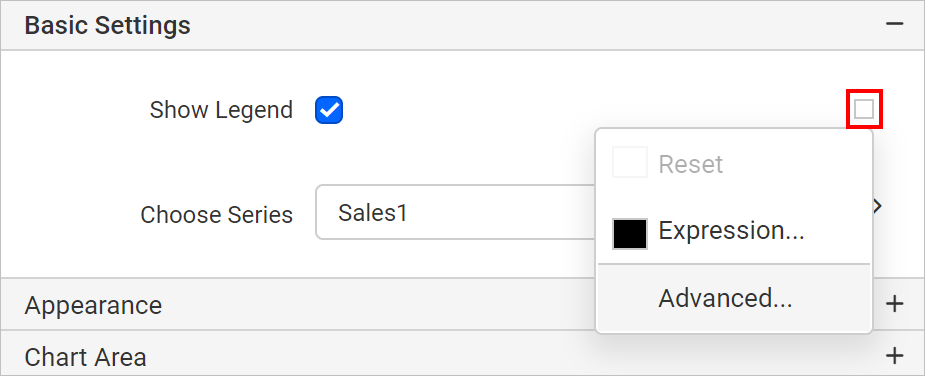
Now, the legend properties will be displayed in the Advanced Options category.
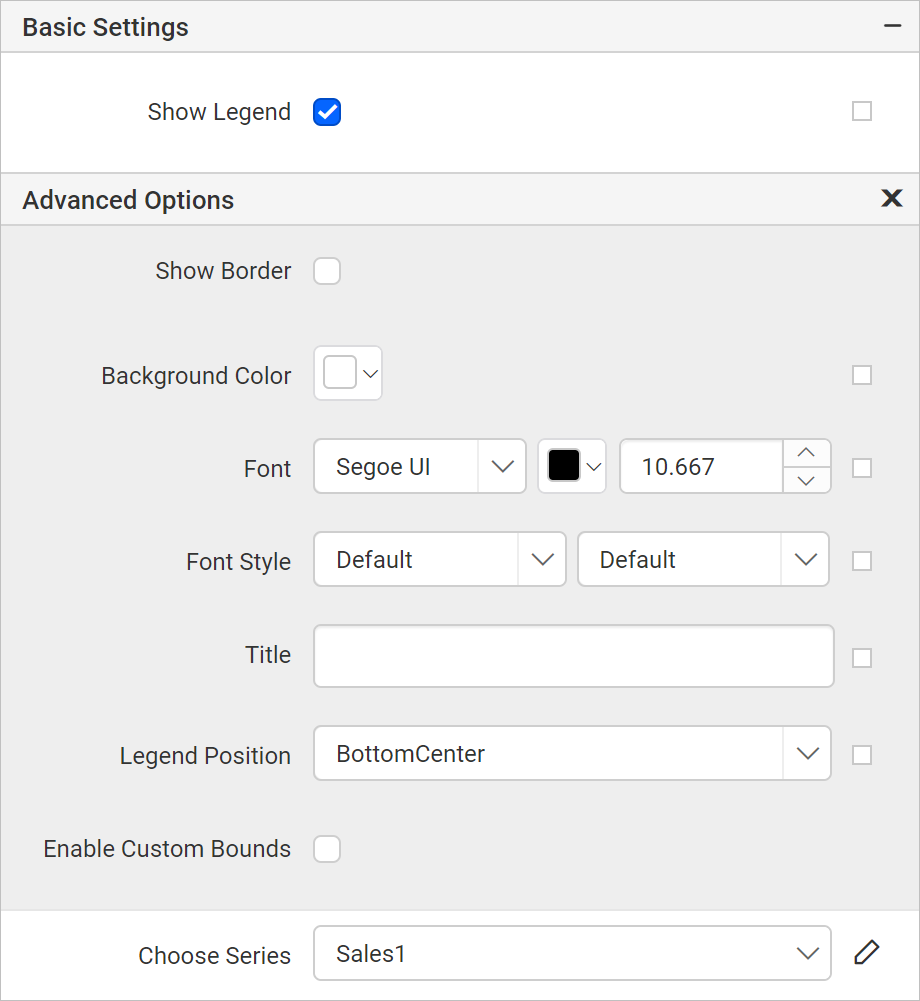
Show border
Show border property can be used to set border for legend area in the chart. To enable legend border, toggle the Show Border checkbox.
Now, default border will be enabled to the legend area.
Also, set of border properties will get enabled in the Advanced Options category.
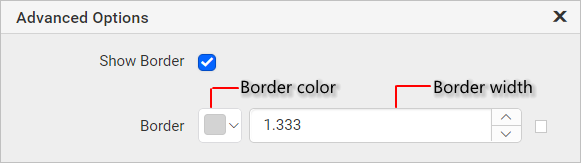
Using the border color and width property, you can customize the border for the legend area. You can also set border properties based on dynamic values, by using the Expressions. Refer Set Expression and Reset Expression section to open set/reset expression menu in properties panel.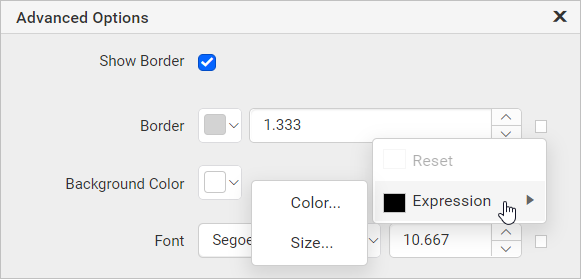
Background color
Background color property can be used to set the background color for the legend area.
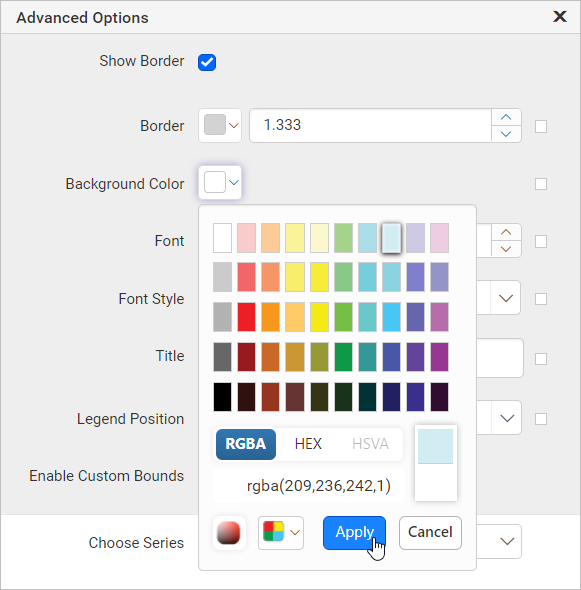
Now, the background color property will be applied to the legend area.
You can also apply background color based on dynamic values, by using the Expressions. Refer Set Expressions and Reset Expressions section to open set/reset expression menu in properties panel.
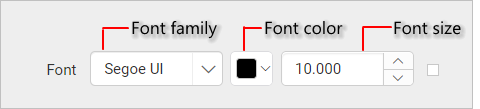
Font
The font family, font size, and font color properties can be used to customize the legend text.
You can also apply font properties based on dynamic values, by using the Expressions. Refer Set Expressions and Reset Expressions section to open set/reset expression menu in properties panel.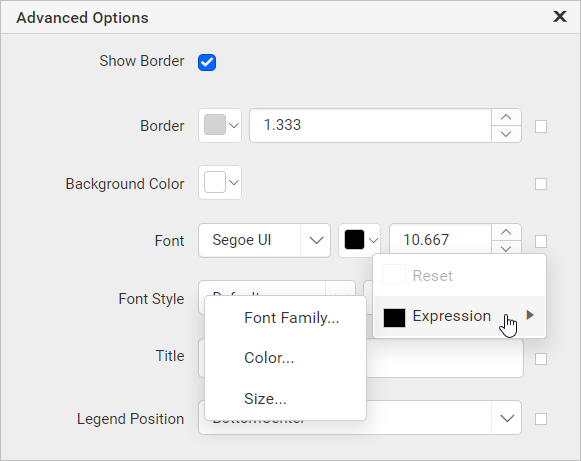
Font Style and Weight
The font style and weight properties can be used to set the style and weight for the legend text.
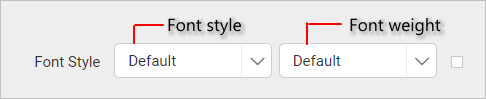
You can also apply font style and weight properties based on dynamic values, by using the Expressions. Refer Set Expressions and Reset Expressions section to open set/reset expression menu in properties panel.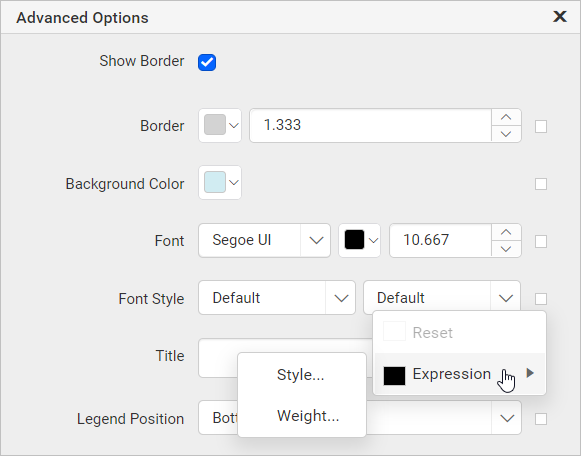
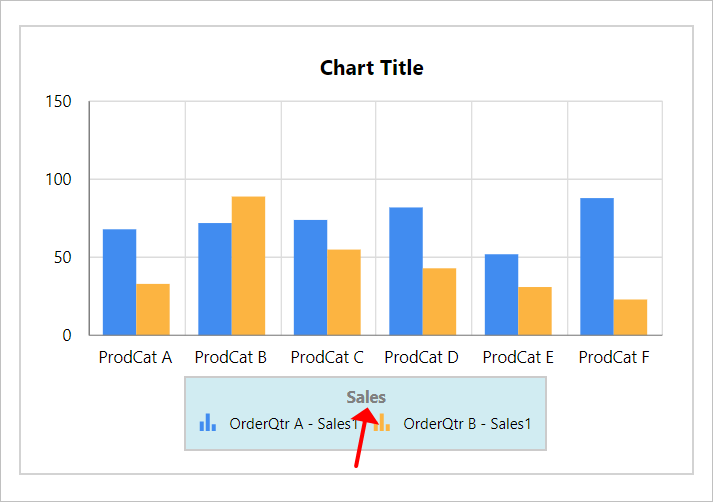
Title
Title property can be used to add the title to the legend. Specify the required title text in the title property textbox.
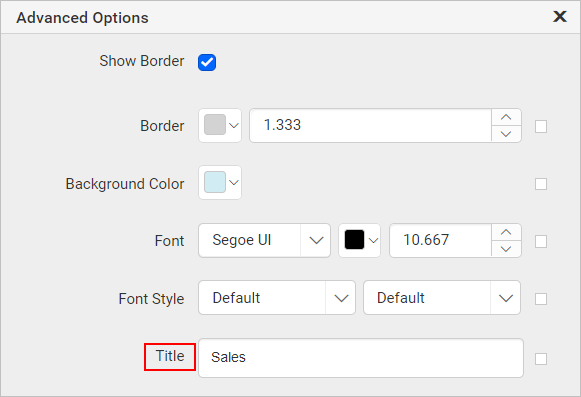
Now, the provided title text will be updated in the chart legend area.
You can also apply title text based on dynamic values, by using the Expressions. Refer Set Expressions and Reset Expressions section to open set/reset expression menu in properties panel.
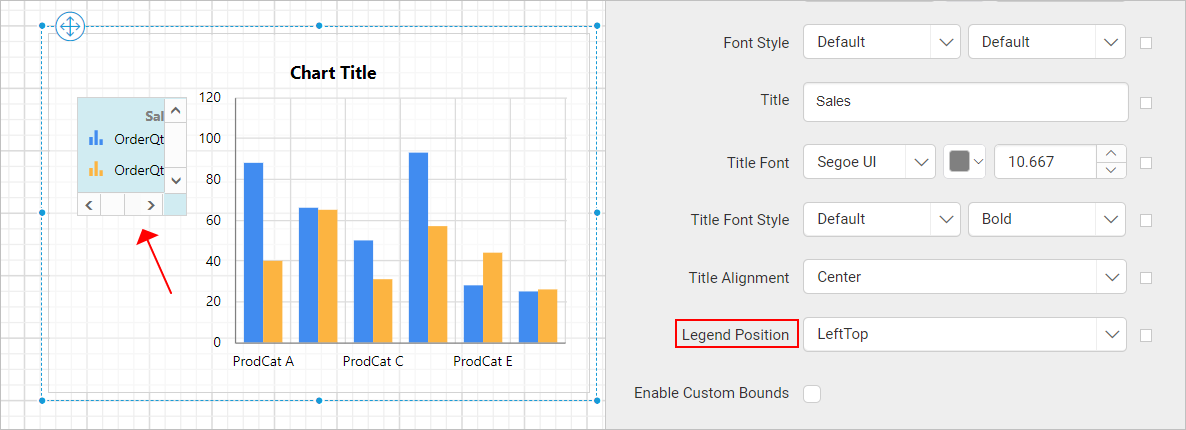
Legend position
You can place the legend in different position inside the chart area. This property can be used to position the legend inside the chart area. Supported positioning patterns are listed in the Legend Position drop-down.
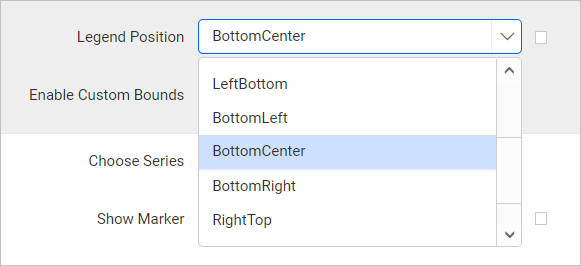
By default the legend will be placed in BottomCenter position. In the below snap, the legend is positioned at LeftTop position inside the chart area.
Enable custom bounds
This property can be used to customize the size and position of the chart legend inside the chart area. To set/reset the size and position of legend, toggle the Enable Custom Bounds checkbox. Once you enable the checkbox, the position and size properties will be listed in the Advanced Options menu.
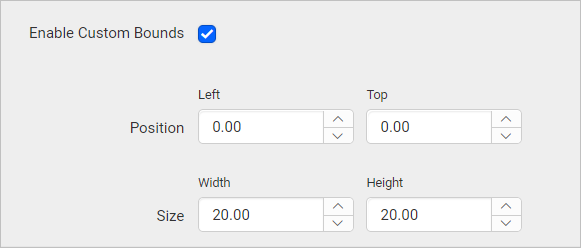
Increase or decrease the width, height, left and top values as required, to position the legend in the chart area.
If custom bounds property is enabled, the
Legend positionproperty will have no effect.