Chart Color Palette
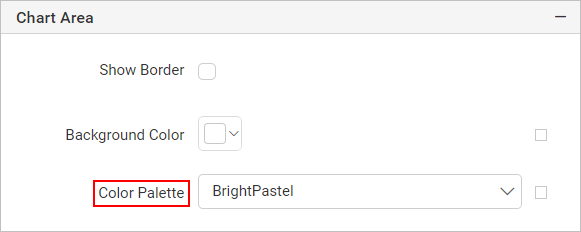
Color palette property can be used to customize the chart series color. You can change the color palette for a chart series by choosing from a predefined set of color palettes or defining a custom palette. The Color Palette property is listed under the Chart Area category in the chart properties panel.
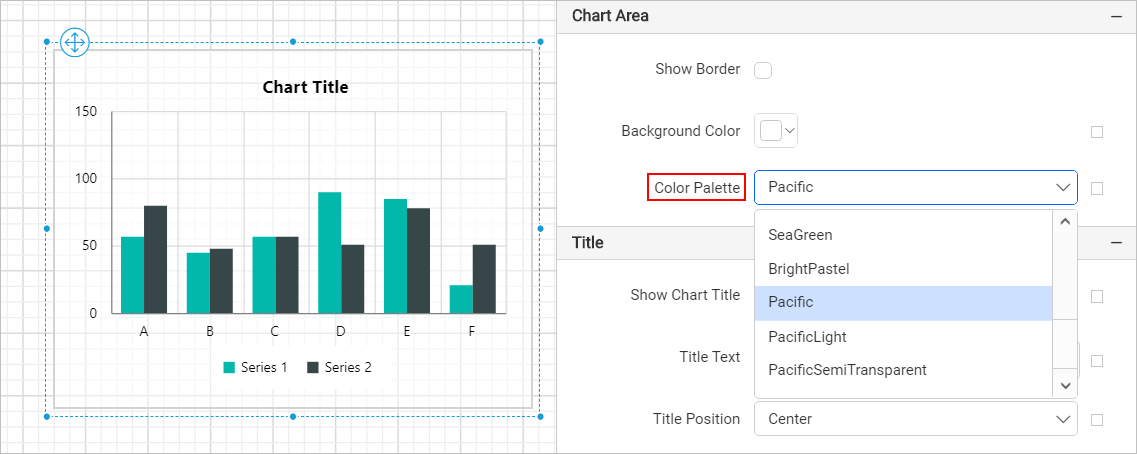
Built-in color palette
You can switch between the predefined color palette options available in Color Palette dropdown.
Define custom color palette
To define custom colors, follow these steps:
-
Select
Customoption from theColor Palettedropdown.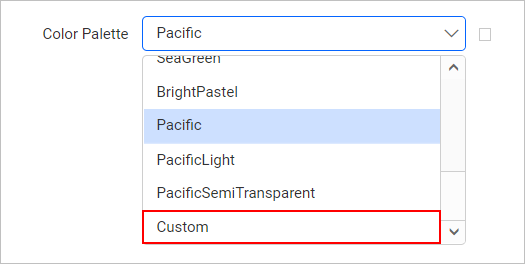
-
Now, the
Custom Colorsfield will start displaying under the color palette drop-down.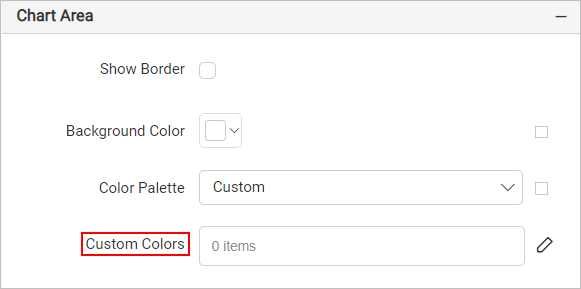
-
Click on the edit icon in the right side of
Custom Colorsproperty.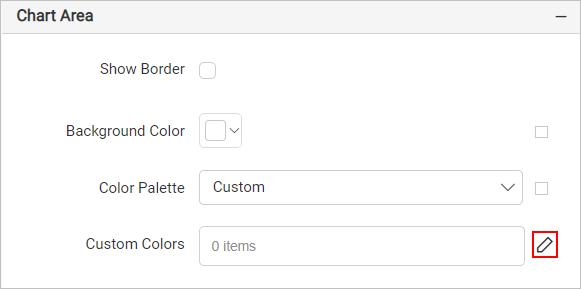
-
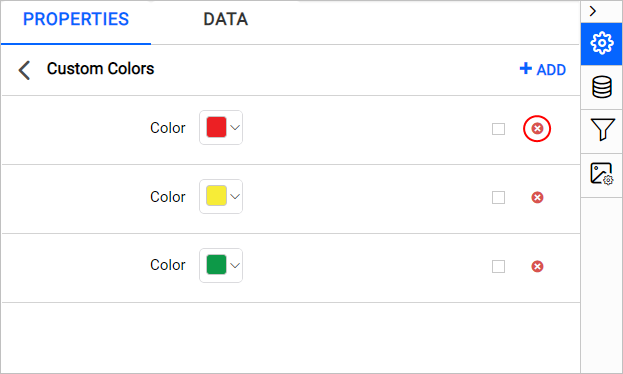
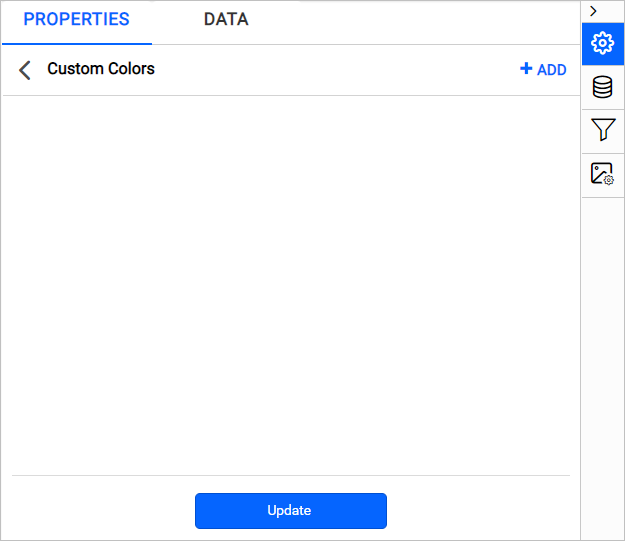
Now, you will be taken to the Custom Colors panel.
-
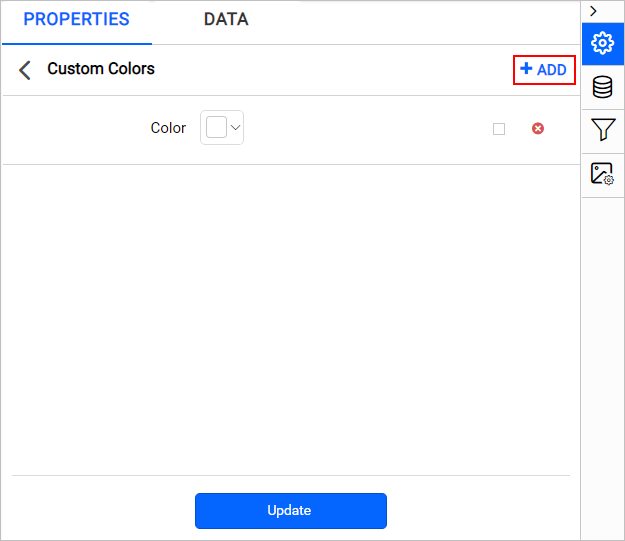
Click on the ADD icon in the top-right corner. A new Color field will be added in the panel.
-
Set the desired color in the color field.
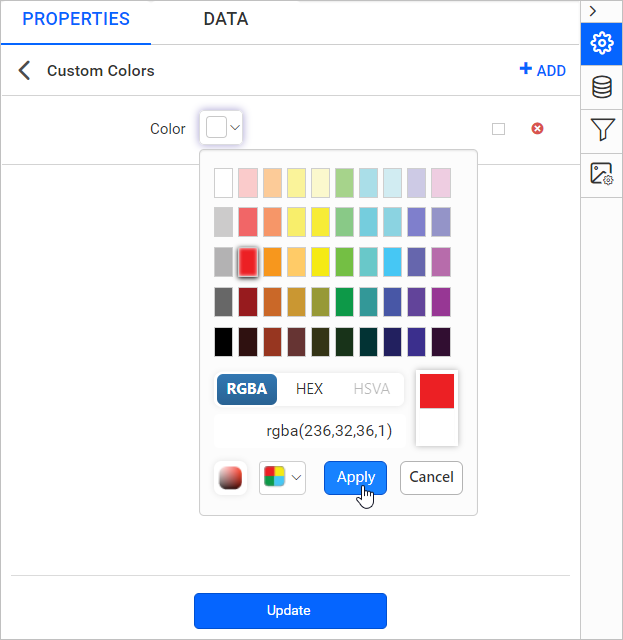
-
Click on the Update.
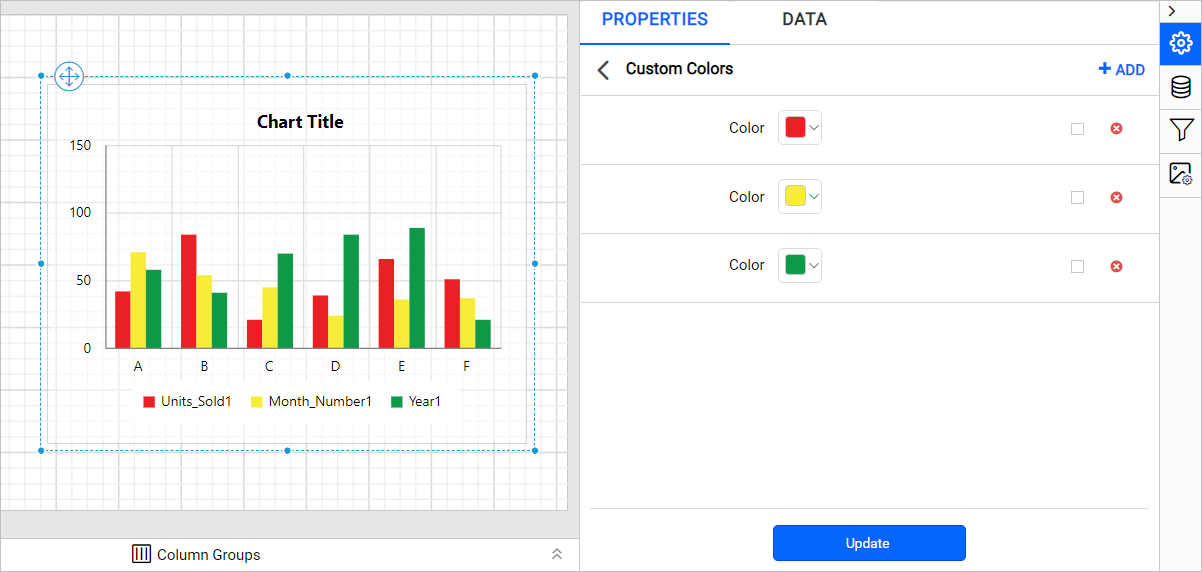
Repeat the above steps to define multiple colors sets or edit existing color sets. For example, I have added three colors in custom colors panel and it will be applied to the chart based on number of series.
You can also set color based on dynamic values, by using the Expressions. Click on the square icon in the right side of the each field to open expression menu.
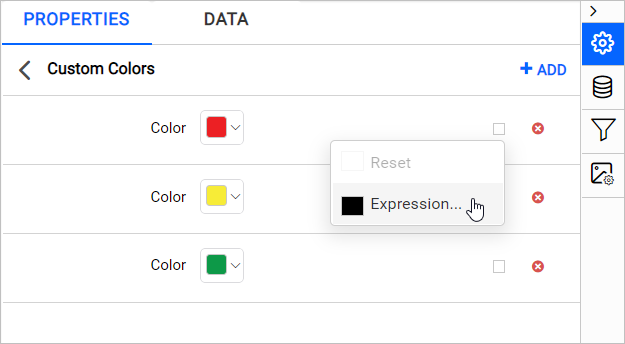
Note: Refer Set Expressions and Reset Expressions section to set and reset expression for custom colors.
Delete color set
To delete the existing color set, click on the edit icon for the Custom Colors property. Now, the available color sets will be listed Chart Custom Colors panel. Click on the Delete icon in the right corner of required color set and click on the Update.