How to hide the table column or row when the field value is empty
In Bold Reports®, you can control the visibility of a tablix column or row based on whether data is present or absent. This feature allows you to effectively manage the display of columns by setting the visibility property and utilizing expressions. This documentation provides a step-by-step guide on achieving this behavior in your reports.
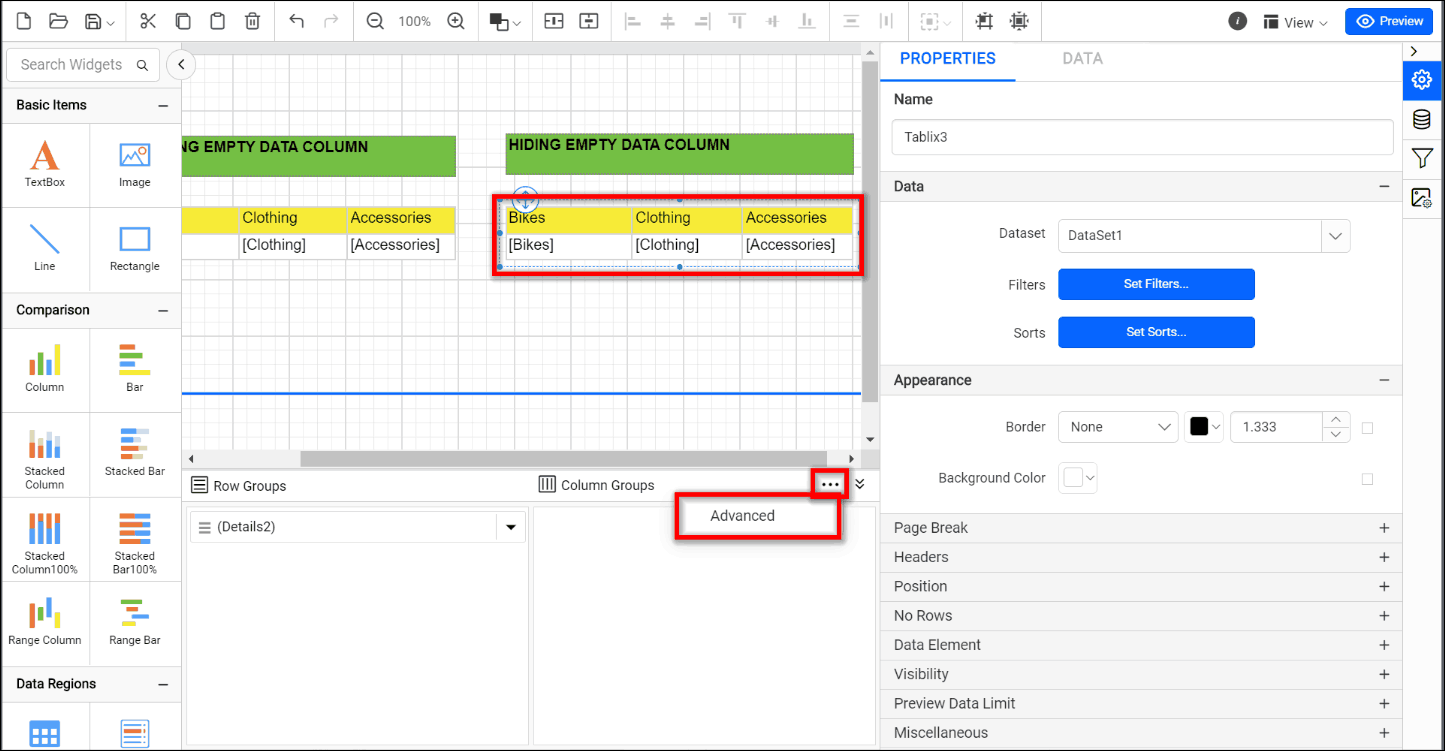
Hide the table column when the field value is empty
-
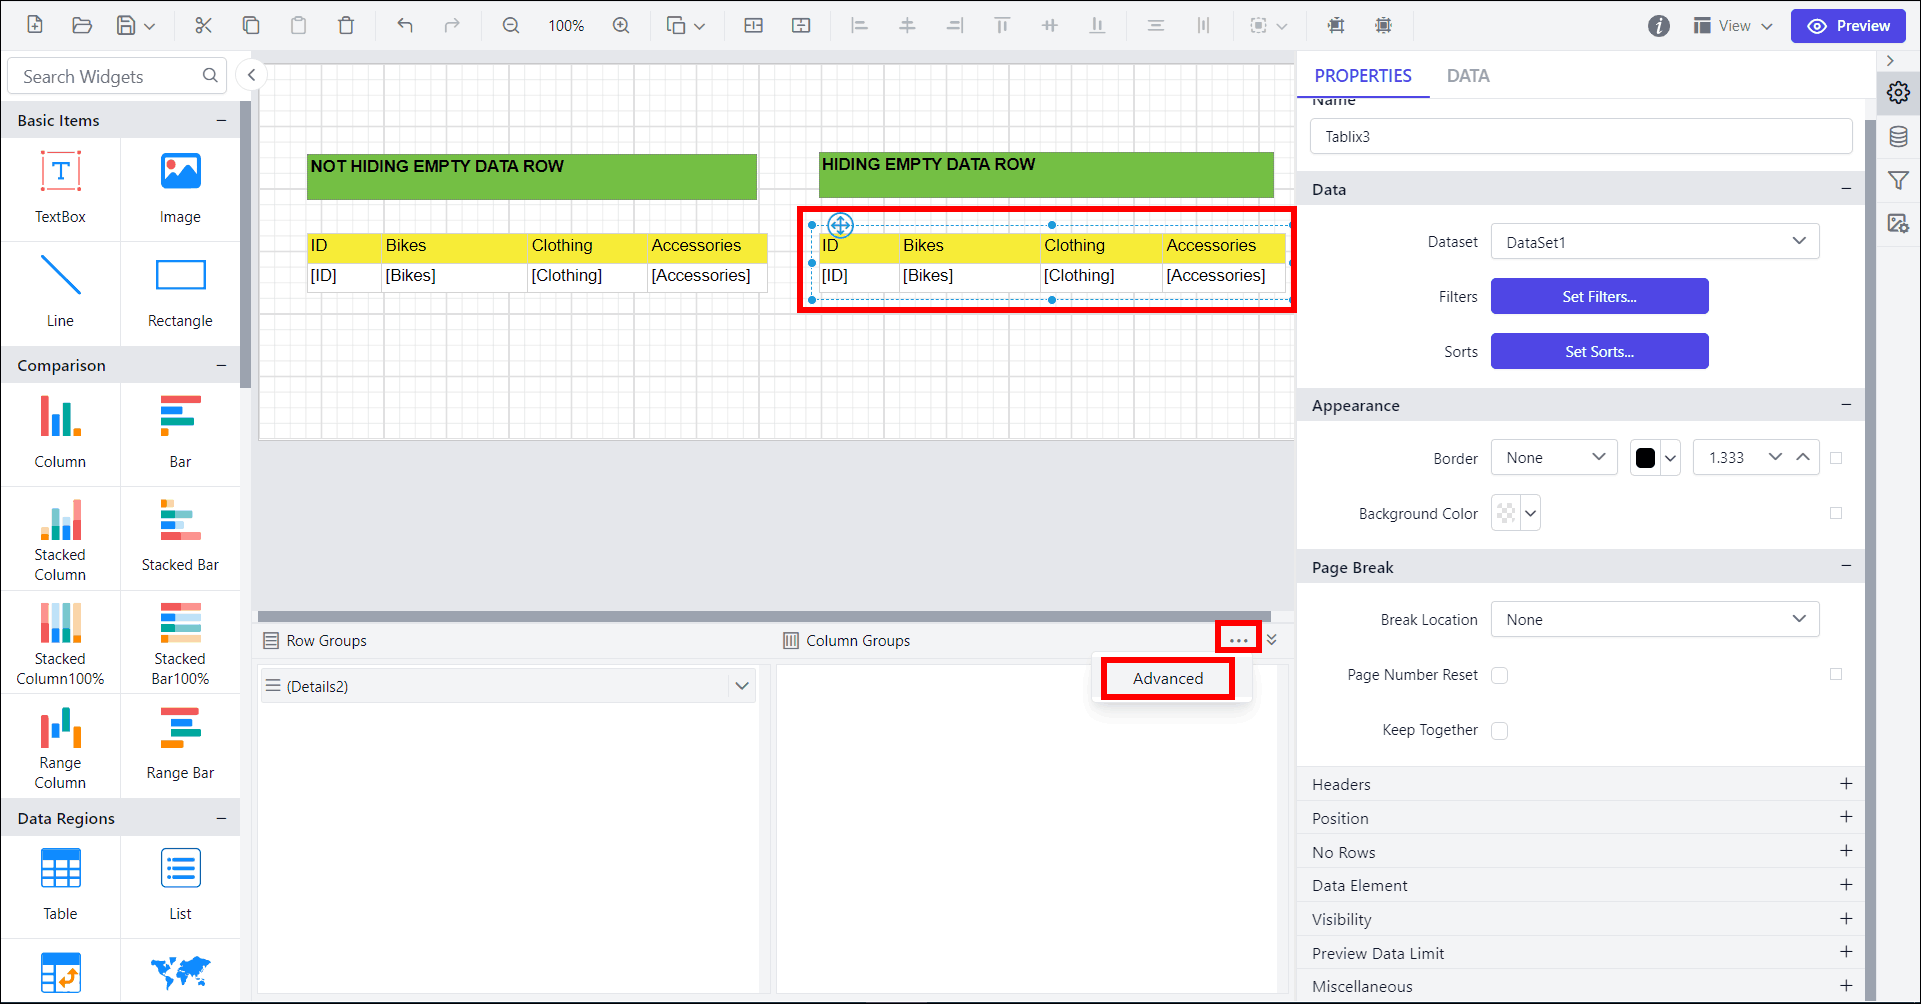
Drag and drop the table, then select the dataset and assign the field values. Select the tablix, enable the advanced mode, and set the visibility expression for the columns to hide them when they contain empty data.
-
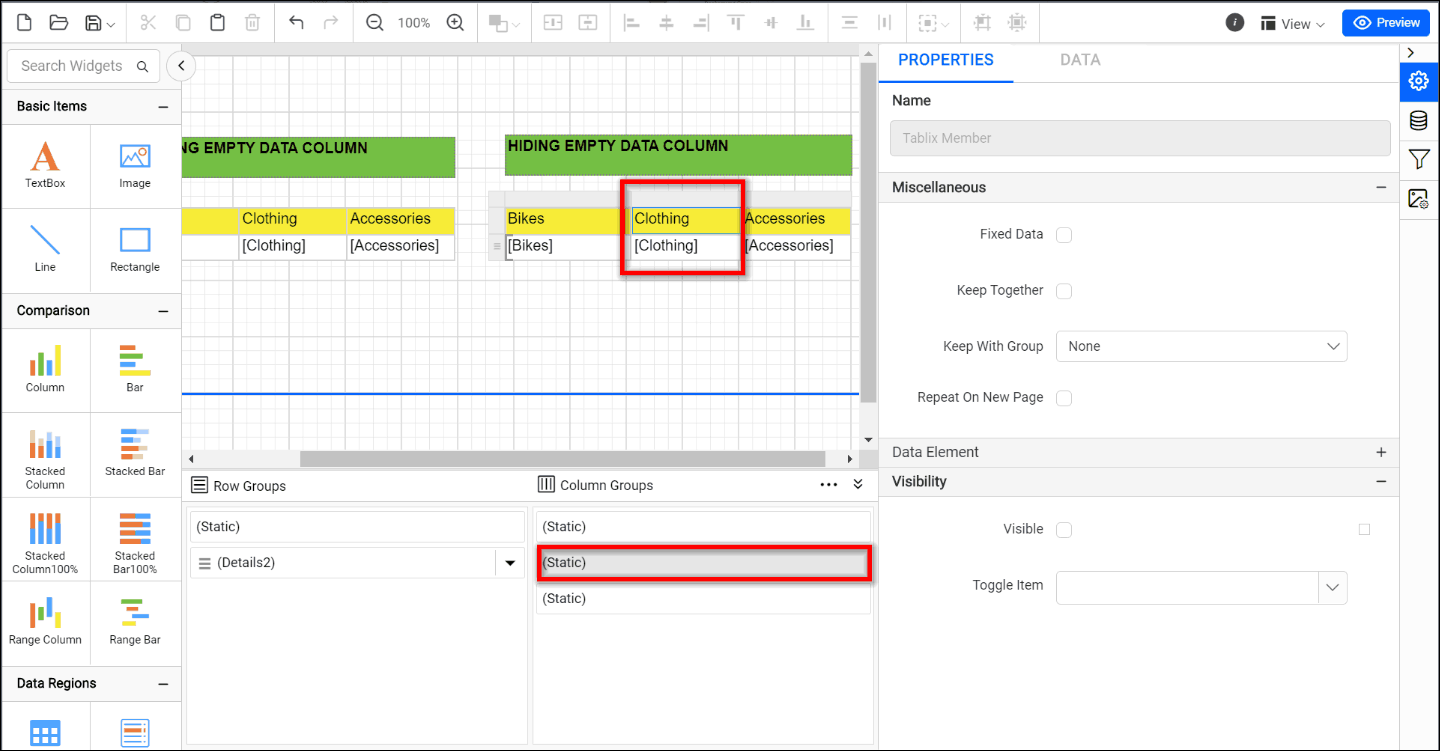
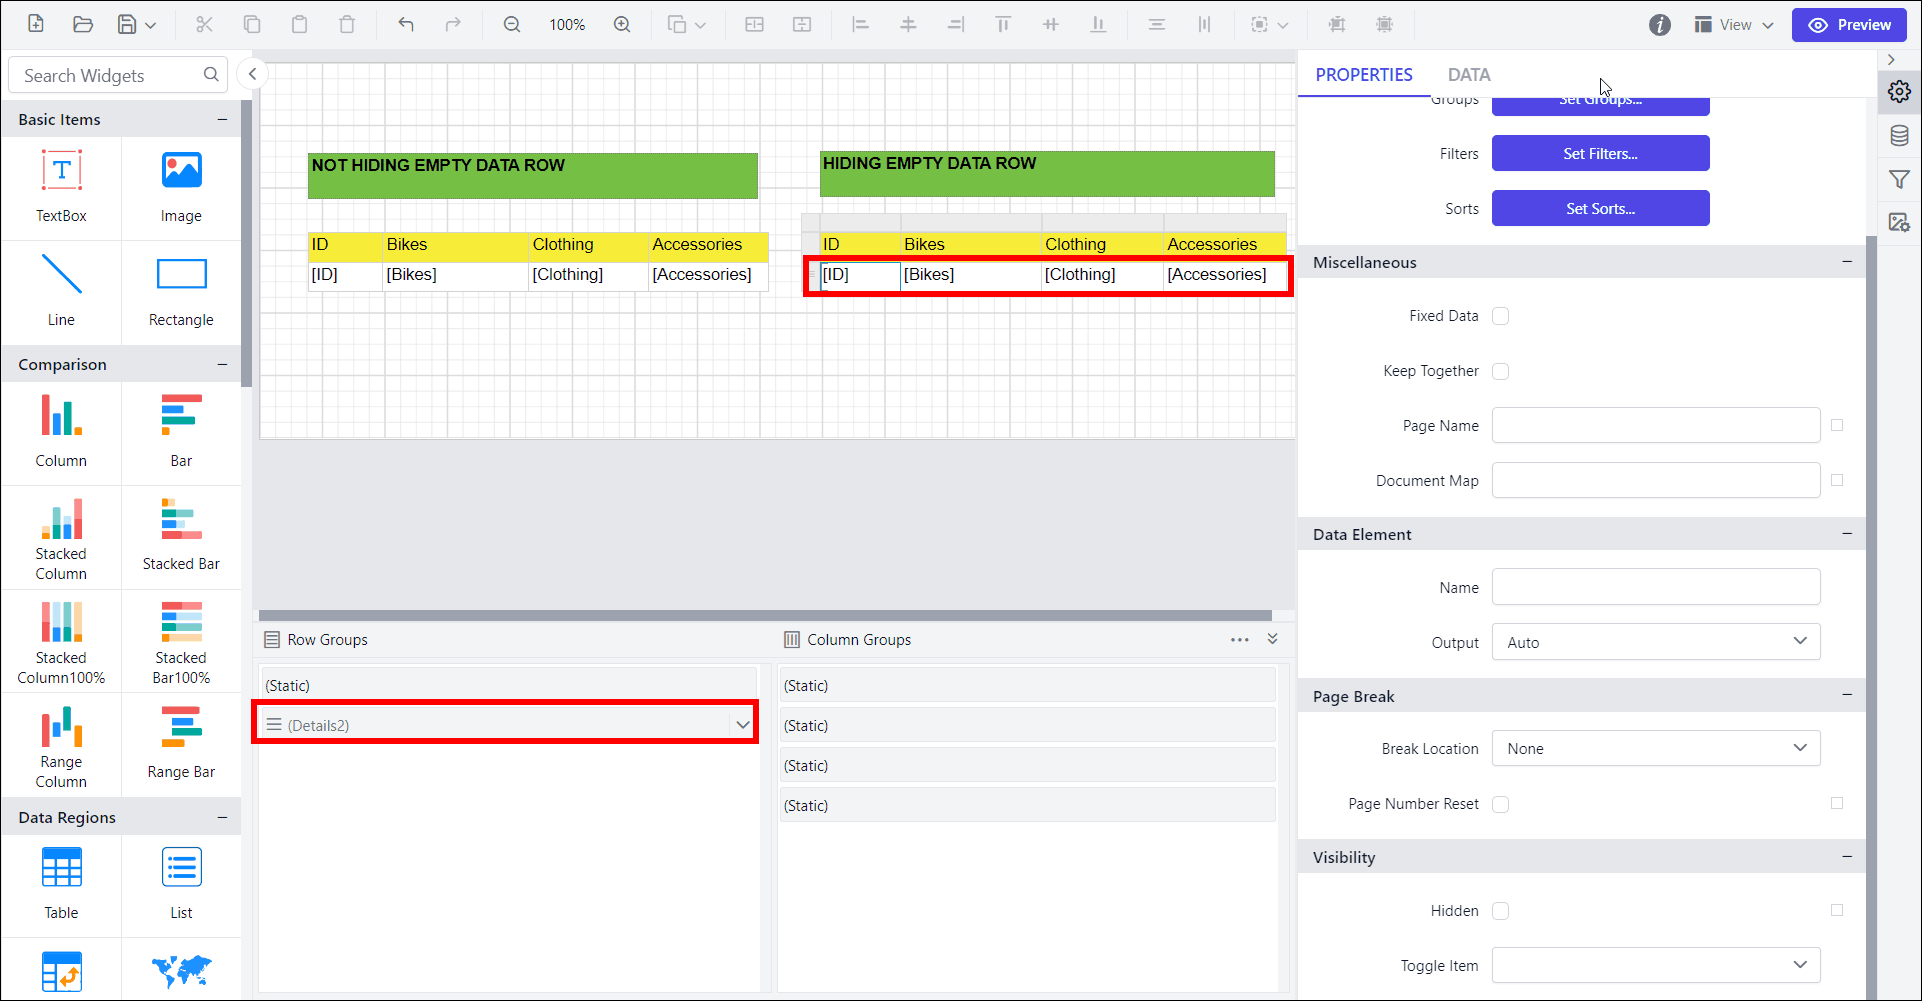
In the Properties window or pane, locate the Visibility property. Click on the expression button (a white box) adjacent to the
Visibilityproperty.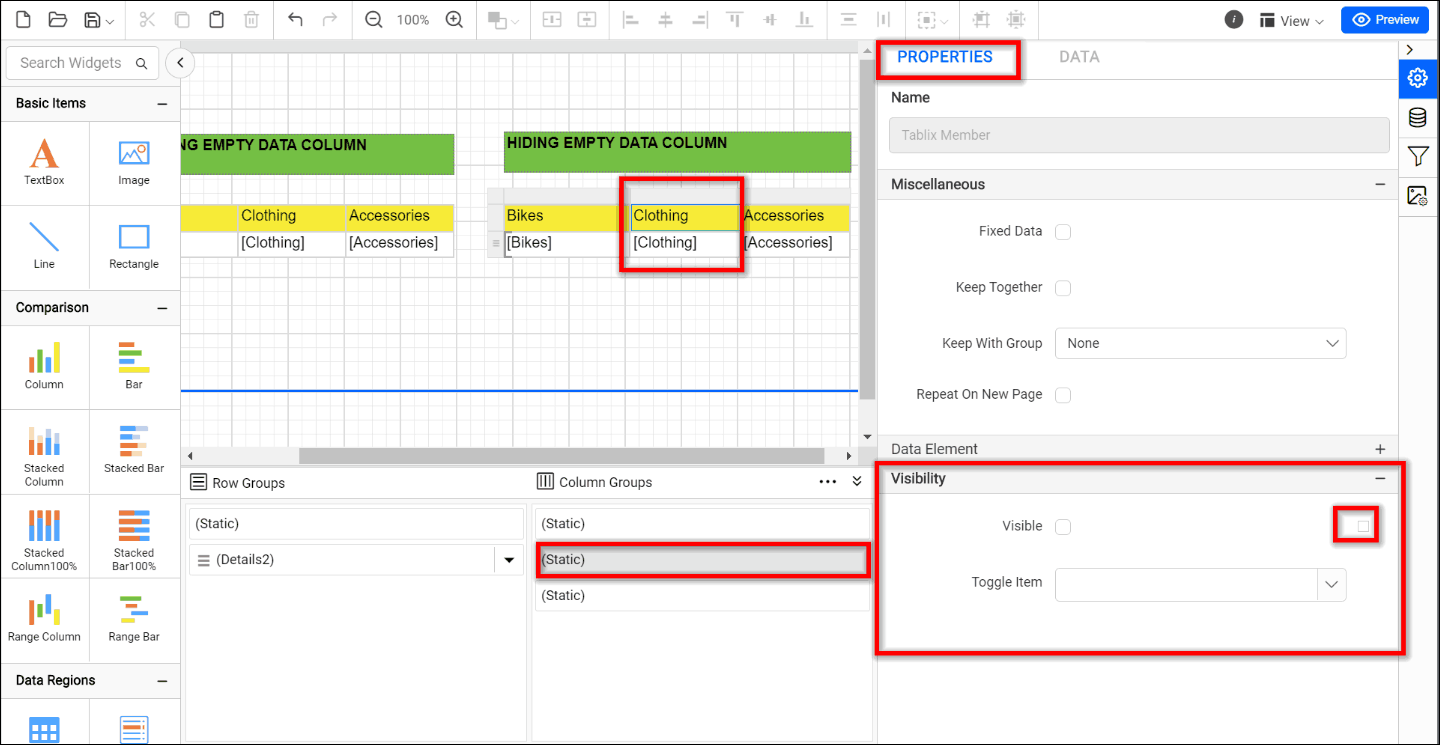
-
This action will open the Expression Editor, where you can define the logic for hiding the column based on data presence. Within the Expression Editor, enter the following expression, selecting the field that indicates the absence of data:
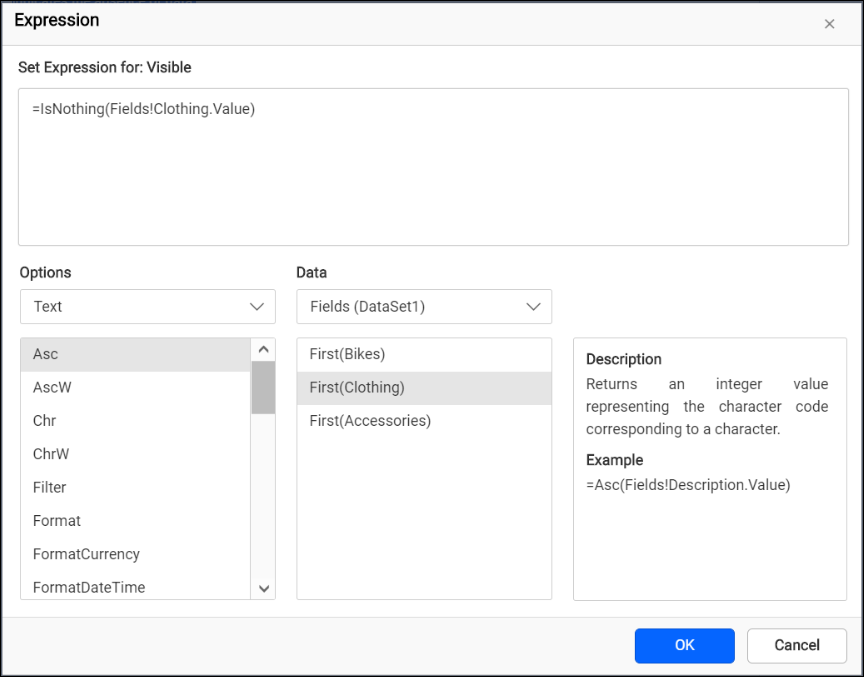
=IsNothing(<Your_field_name>)For example,
=IsNothing(Fields!Clothing.Value) -
Click on the OK option to save the Expression Editor.
-
Save your report and proceed to
previewit. Observe the visibility of the column, which will now adjust dynamically based on the availability of data.
The IsNothing(Fields!Clothing.Value) expression evaluates to True when the field value is null or empty, and False when it contains data. By setting the Visibility property to False, the column will be hidden when the expression evaluates to True.
You can download the created sample report from here.
Hide the table row when the field value is empty
-
Drag and drop the table, then select the dataset and assign the field values. Select the tablix, enable the advanced mode, and set the visibility expression for the rows to hide them when they contain empty data.
-
In the Properties window or pane, locate the Visibility property. Click on the expression button (a white box) adjacent to the
Visibilityproperty.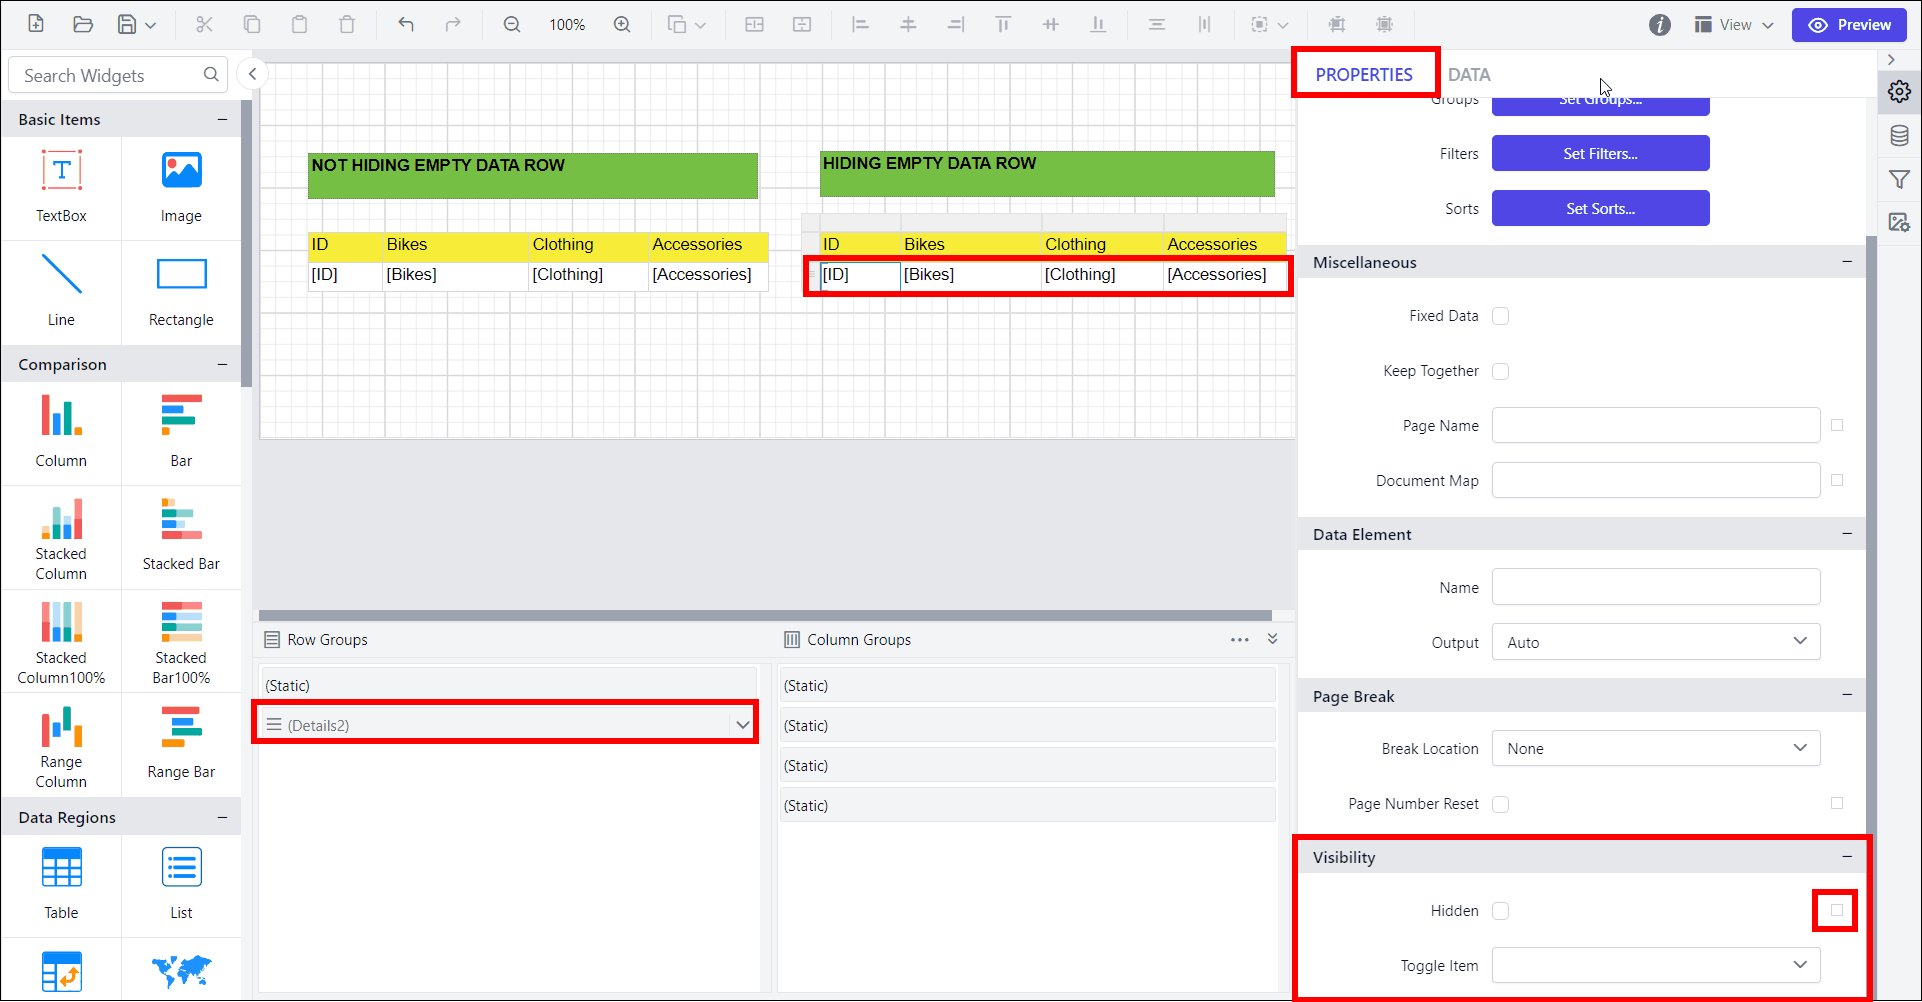
-
This action will open the Expression Editor, where you can define the logic for hiding the row based on data presence. Within the Expression Editor, enter the following expression, selecting the field that indicates the absence of data:
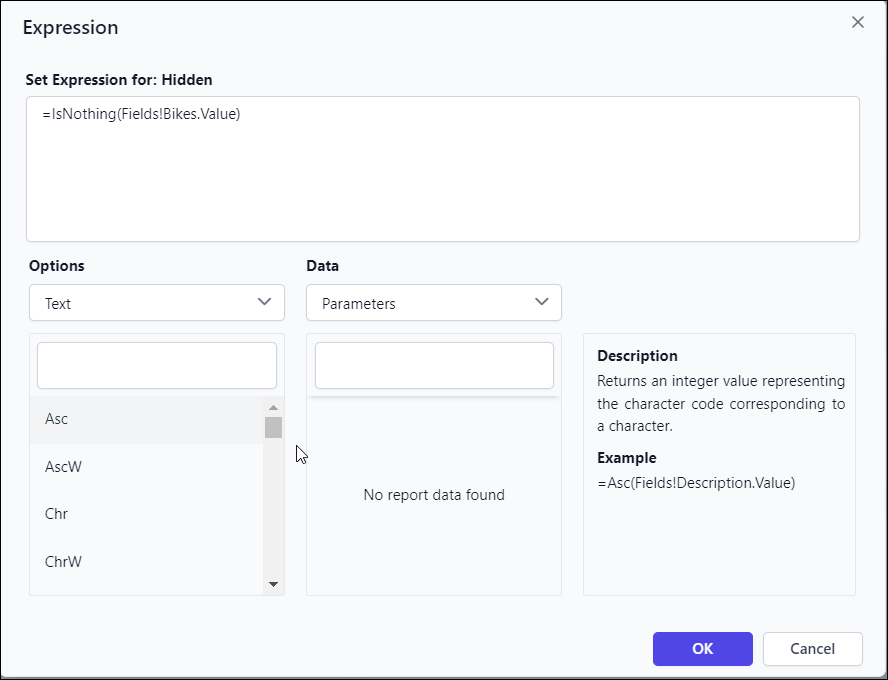
=IsNothing(<Your_field_name>)For example,
=IsNothing(Fields!Bikes.Value) -
Click on the OK option to save the Expression Editor.
-
Save your report and proceed to
previewit. Observe the visibility of the row, which will now adjust dynamically based on the availability of data.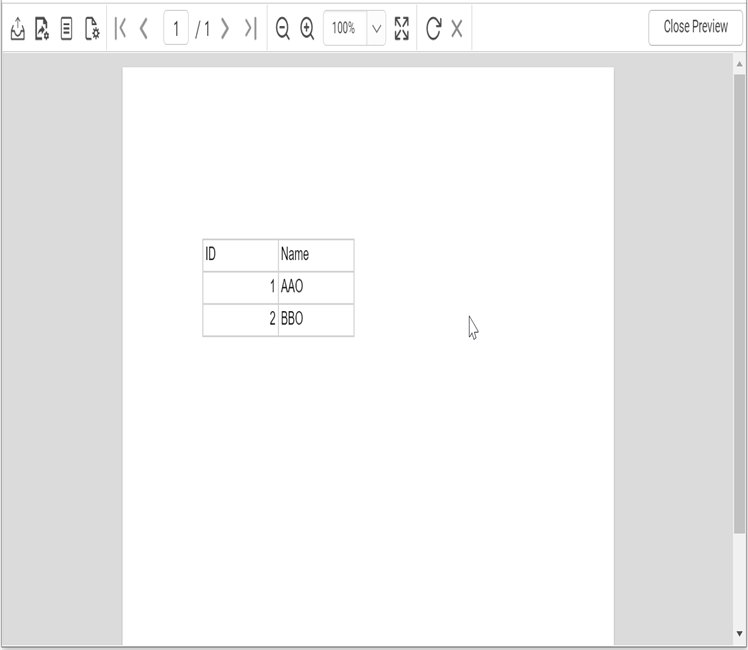
The IsNothing(Fields!Bikes.Value) expression evaluates to True when the field value is null or empty, and False when it contains data. By setting the Visibility property to False, the row will be hidden when the expression evaluates to True.
You can download the created sample report from here.
By following the steps outlined in this documentation, you can easily hide a column or row dynamically in Bold Reports® when the associated tablix contains no data. The utilization of the IsNothing() function within an expression provides you with the flexibility to control column or row visibility based on data presence. Implementing this technique enhances the visual appearance and usability of your Bold Reports® projects.