Excel
Excel is a spreadsheet tool used to store and organize data in tables. It helps you analyze information using formulas, filters, and functions. You can also visualize your data through charts, graphs, and pivot tables.
Example Configuration
version: 1.0.1
encrypt_credentials: false
union_all_tables: true
add_dbname_column: false
use_snake_casing: true
plugins:
  extractors:
  - name: FileSystem
      connectorname: FileSystem
      schemaname:
      config:
      properties:
        storage: local
        type: excel
        sheetname: Sheet1
        range: B6:H20
        include_header: true
        filePath: C:\BoldServices\app_data\elt\connectors\orderdata.xlsx
      metadata:
      select:
Configure the Bold Data Hub to connect Excel
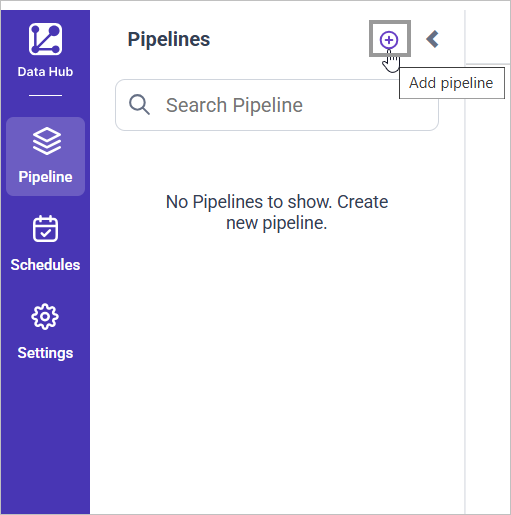
- Click the
Data Hubicon on the Navigation Pane.

- Click
Add Pipelineand provide the new pipeline’s name.
- Select the newly created pipeline and add the
Exceltemplate.

Configuration Parameters
| Parameters | Description |
|---|---|
| sheetname: | Specify the name of the Excel sheet from which the data should be read. |
| range: | Specify the cell range to extract data from a specific area of the sheet. If include_header is true, the first row from the specified range will be treated as column header. It is useful when headers are not in first row. |
| include_header: | Controls whether the first row should be treated as column names. If it is set to true,the first row is read as column headers. By default it is false and the first row is treated as data, and generic column names are assigned. |
- Click the “Upload File” button to upload your excel file.

- Copy the filepath and replace in filePath property. Also Provide the appropriate sheet name.


- Click Save and choose the desired destination to save the pipeline.

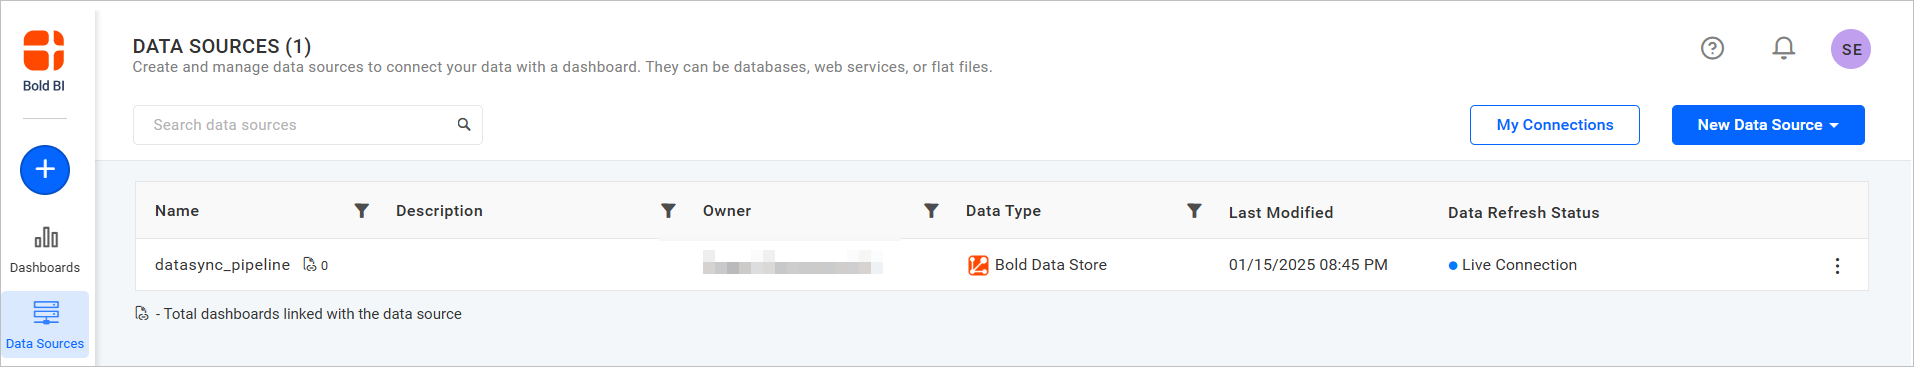
- Creating a Pipeline in Bold Data Hub automatically creates a Data Source in Bold Reports®. The Bold Reports® Data Source is a live data source to the destination database used in Bold Data Hub.
Schedule Bold Data Hub Job
- To configure interval-based scheduling, click on the schedules tab and select the created pipeline and click on the schedule icon and configure it.


- For on-demand refresh, click
Run Nowbutton.

- The Schedule history can be checked using the history option as well as logs.
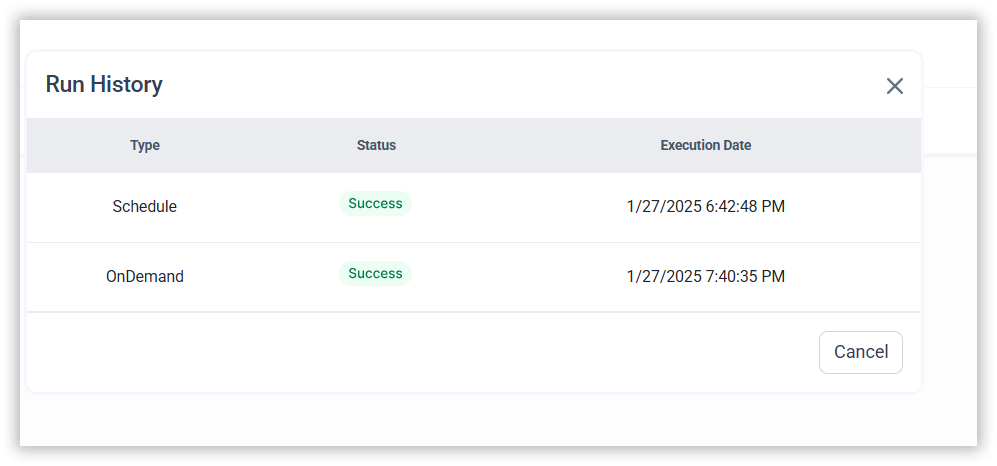
- Click on Logs to see if the run is completed and data source is created in Bold Reports®.
CONTENTS
CONTENTS
Thank you for your feedback and comments.We will rectify this as soon as possible!