Architecture Diagram for Bold Reports®
This section explains the architecture diagram of Bold Reports® On-Premise Edition.
Overview of Bold Reports®
Bold Reports® is an online solution for analyzing data on the web using interactive reports with key metrics, making it easy to track your business.
It is an end-to-end solution for creating, managing, and sharing interactive business reports, including a powerful report designer for easy composition.
Architecture Diagram for Bold Reports®
This topic provides users responsible for supporting Bold Reports® in their organization with an advanced description of the architecture of Bold Reports®.
In a multi-tenant architecture, multiple instances of an application operate in a shared environment. The instances (sites) are logically isolated but physically integrated. In the context of databases, this means that multiple sites share the same database, but each site has its own set of tables that are distinguished by schema and prefix. This allows for efficient resource utilization while ensuring data isolation and security for each site.
The diagram below describes the components of a Bold Reports® server and how Bold Reports® works on the server.
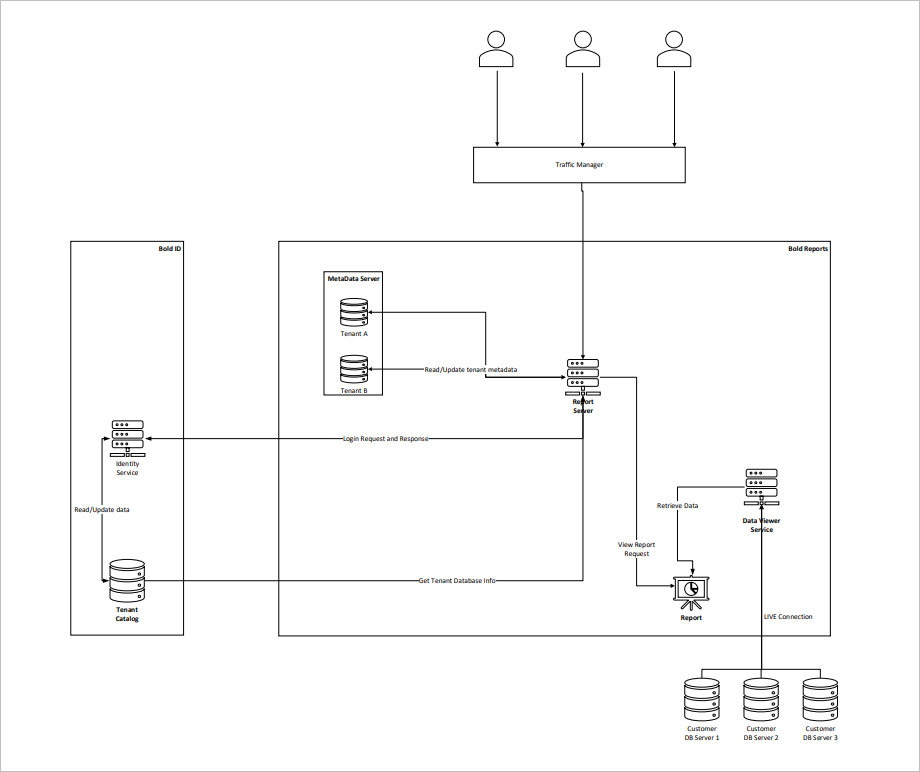
Bold Reports® is provided with a single installation process. After installing Bold Reports® on a server, you will have access to all of its functionality.
The Bold Reports® application has two types of functional systems:
- Bold ID - It manages user identities and sites.
- Bold Reports® Server- It manages reports, data sources, datasets, schedules, and user permissions.
Storage Options
Bold ID Application
Bold ID Application is an identity provider for Bold Platform products. The site details and user details are maintained in the Bold ID application. Login and logout have been processes are handled by this application. The Bold ID Application is a core application of the multi-tenant solution that manages the site and its user identity.
Site and user details are stored in the Site Catalog, which we call the as User Management Server(UMS), whereas the login processes are handled by the identity service. All these functionalities are carried out under the application called Bold ID.
In Bold ID, we support various login methods such as SSO, OAuth, Open ID, JWT token access, and Windows authentication; please refer here for more details.
Whenever you are accessing the Bold Reports® site directly, the Bold Reports® application will redirect the request to Bold ID to authenticate . If the user is valid and authorized, access to the site will be granted; otherwise, it will result in an authentication error.
Bold Reports® Application
Bold Reports® Server is a reporting application where we can maintain resources like reports, data sources, datasets, schedules, users, groups, and permissions separately, irrespective of other sites.
Both admin and non-admin users can perform CRUD operations on reporting items based on a set of privileges provided to them. Please refer here for permission management.
The Data Viewer Service (Report Designer) is one of the applications of the Bold Reports® Server, where we can design the report using a live connection to retrieve data and create and view the report. To create a new report, refer here.
The Report service (Report viewer) is an engine that is integrated by default into the data viewer service and report server to render/view the report.
We provide support to embed the report viewer and report designer in your application. Please refer here for more details.
Bold Reports® Data Architecture
Overview
The Bold Reports® architecture is designed to streamline data integration, transformation, and visualization processes, enabling users to create insightful reports with ease. This architecture leverages Bold Reports® capabilities to work seamlessly with databases, data warehouses, and datasets.
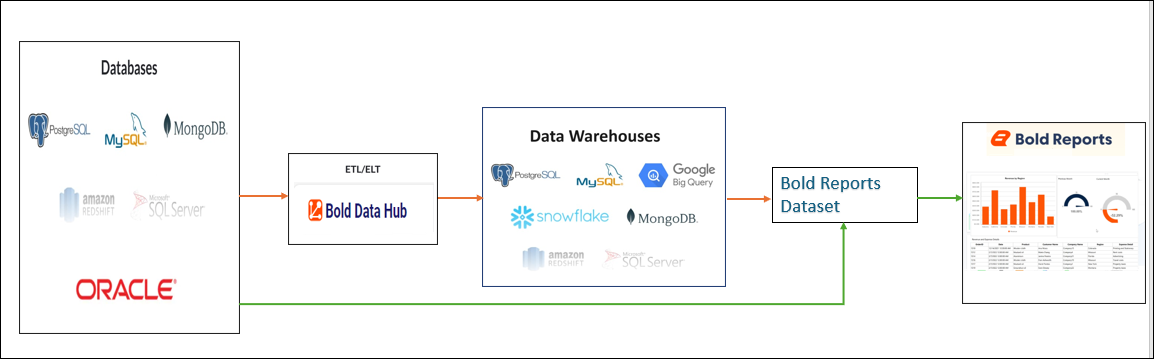
Databases:
- Bold Reports® integrates with various databases such as PostgreSQL, MySQL, Microsoft SQL Server, and Oracle.
- Data can be connected to Bold Reports® through the following modes:
- Live Connections: Directly connects to databases to fetch real-time data.
- Extract Connections: Data is processed and extracted for optimized performance.
ETL/ELT with Bold BI Data Hub:
- The Bold Data Hub serves as the core for ETL (Extract, Transform, Load) and ELT (Extract, Load, Transform) operations.
- It ensures data is cleaned, transformed, and optimized before being transferred to data warehouses or datasets, providing a reliable foundation for creating accurate reports.
Data Warehouses:
- Bold Reports® connects seamlessly with modern data warehouses such as Google BigQuery, Snowflake, Amazon Redshift, and other analytics-optimized systems.
- These data warehouses act as centralized repositories, storing structured and semi-structured data and preparing it for analytical workloads.
Bold Reports® Dataset:
- Datasets in Bold Reports® are created to provide structured data for report generation.
- Users can define queries, apply filters, and shape the data to fit specific reporting requirements.
Bold Reports® Visualization:
- Bold Reports® provides dynamic and interactive visualizations, including reports, charts, and tabular reports.
- These visualizations are built to support a variety of business needs, offering customizable layouts and styling options to suit specific user preferences.
Key Features of the Architecture
- Flexible Data Connectivity
- Scalability
- Seamless Integration